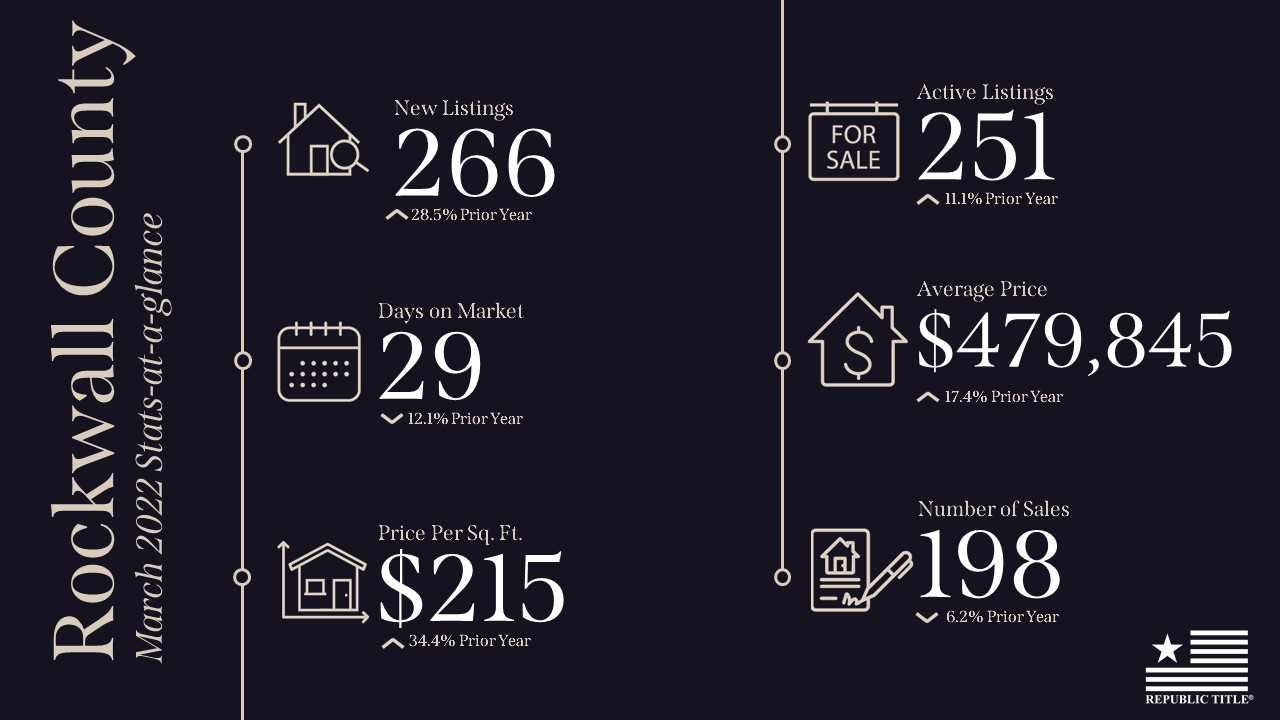
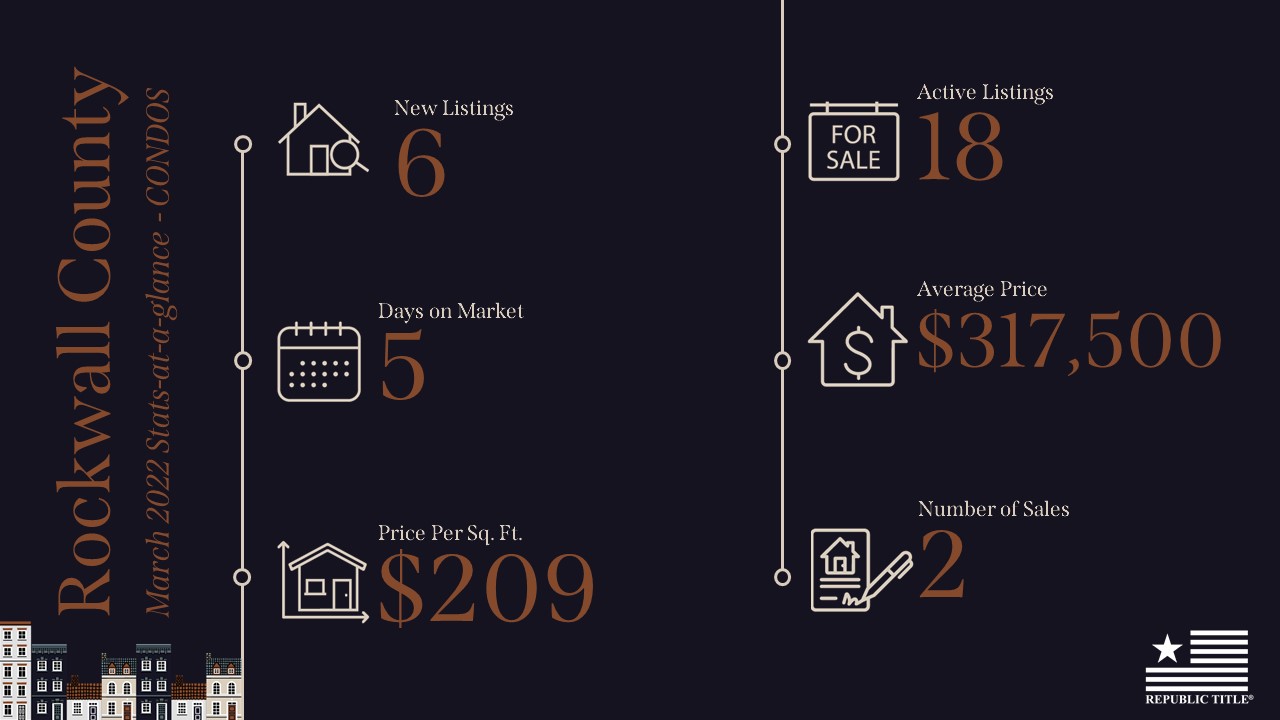
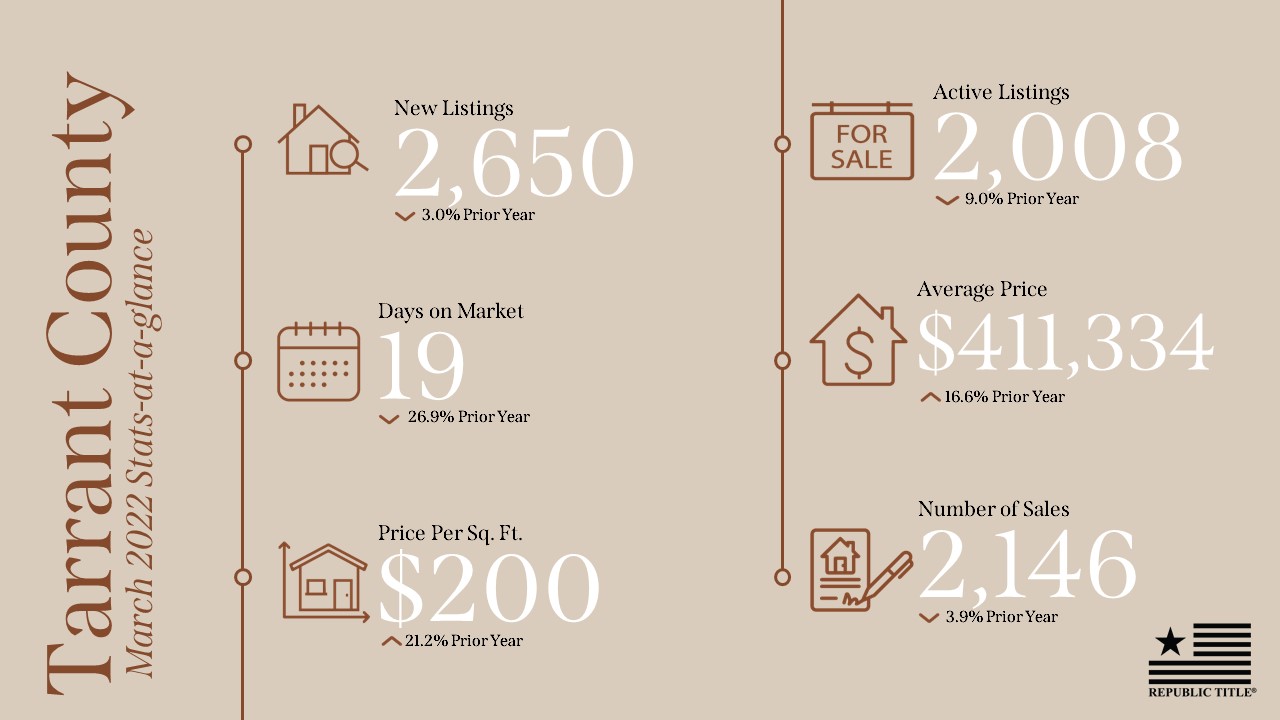
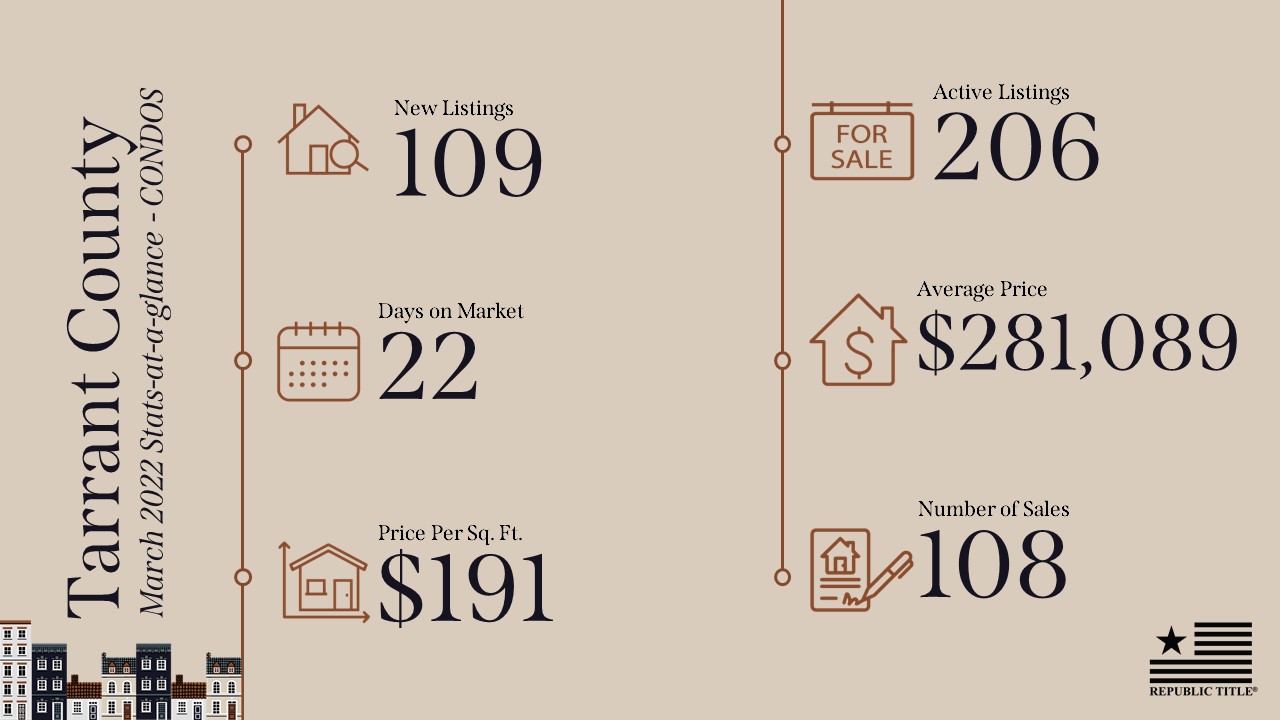
Texas housing sales continued to rise in January, compounding gains despite ongoing supply constraints. The months of inventory (MOI) slid to 1.4 months, putting downward pressure on the market. Single-family permits, however, increased, and housing starts continued to rise despite steep price hikes in lumber and other building inputs. Finding homes priced below $300,000 remained a great challenge to many Texans as inventory cannot keep up with booming demand. Sales have remained strong despite ongoing inventory limitations, particularly among lower priced cohorts. The state’s diverse and expanding economy, favorable business policies, and steady population growth still support a favorable outlook.
Supply1
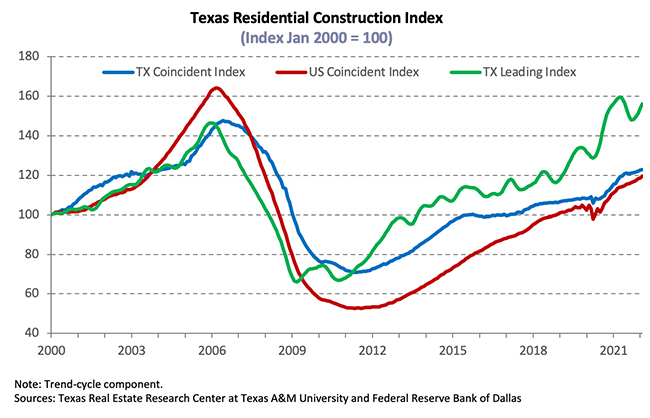
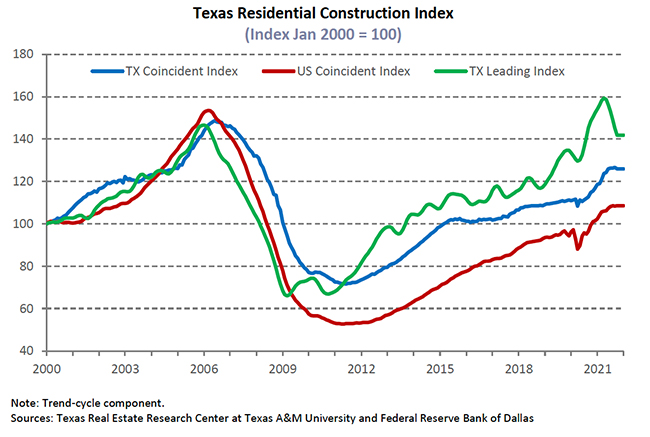
The Texas Residential Construction Cycle (Coincident) Index, which measures current construction activity, decreased nationally and in Texas due to falling employment outweighing heightened construction gains. The Texas Residential Construction Leading Index (RCLI) possibly reached a trough, signaling an increase in future activity. The downward trend was reverted by an increase in weighted building permits and residential construction value starts along with the ten-year real Treasury bill continuing to fall. The leading indexes among the major metros, however, continued to decline. Current inflationary conditions due to supply chain issues are putting downward pressure on construction activity and may impede construction activity in the coming months.
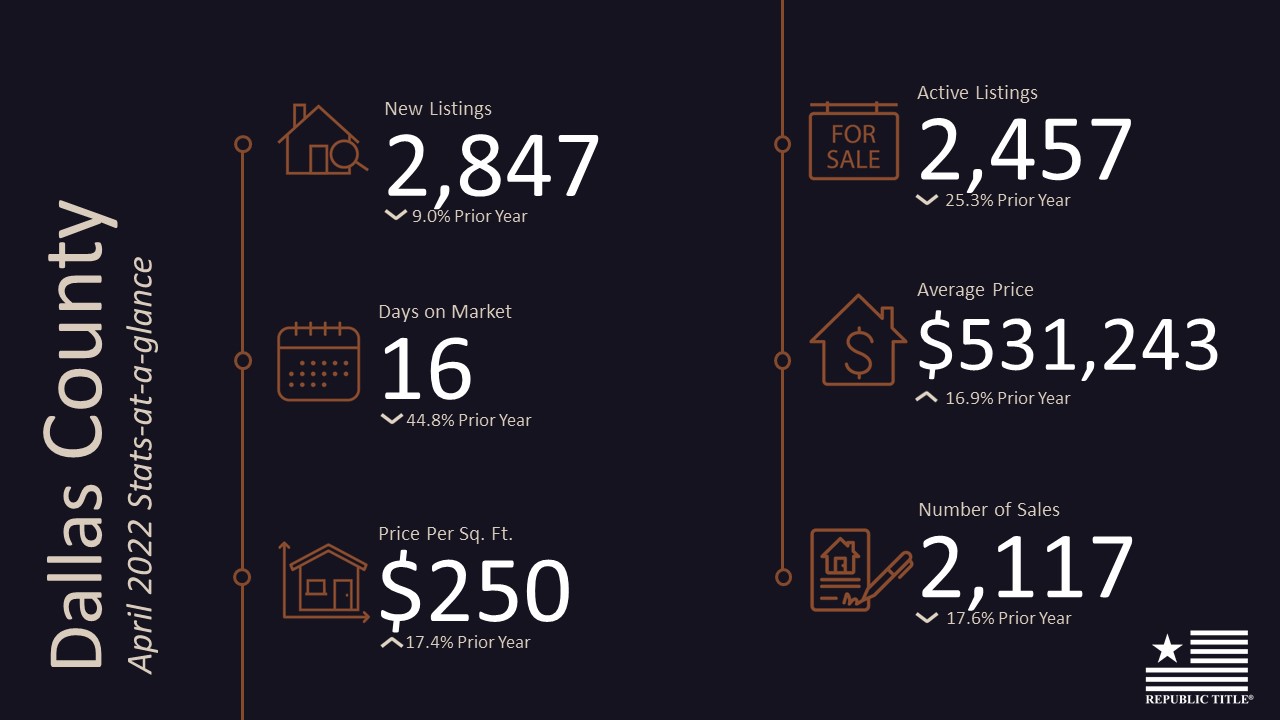
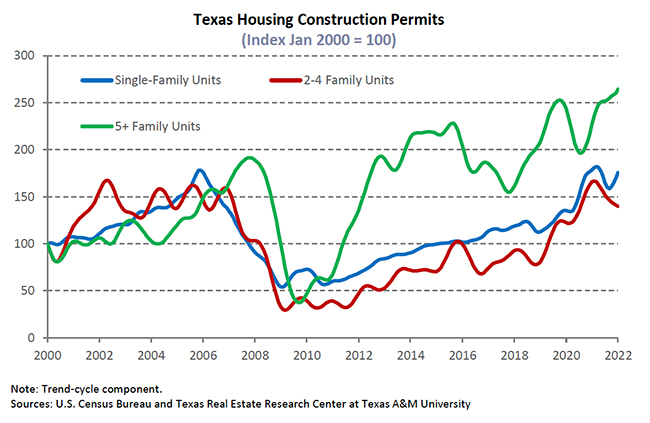
Single-family construction permits surged 7.1 percent, beating out the national increase of 6.5 percent month over month (MOM). Houston and Dallas-Fort Worth (DFW) remained on top of the national list and outnumbered Phoenix by approximately 1,000 permits. The largest rate of change of the major Texas metros came from San Antonio and DFW at 10 percent and 7.1 percent, respectively. Houston issued the highest number of permits at 4,837, marking a 2.2 percent uptick, while Austin issued 2,295 permits for a rise of 6.4 percent. Texas multifamily permits dropped 15.5 percent MOM; however, the metric was up 4.3 percent year to date (YTD).
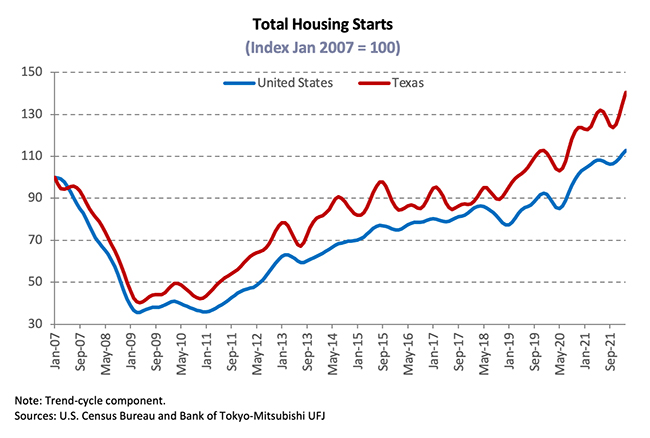
Lumber prices soared 61.2 percent, drastically increasing the cost of home building. Despite the lumber market disruption, robust economic conditions and copious demand pushed total Texas housing starts up for the third consecutive month, increasing at 2.1 percent. Single-family private construction values also increased in real terms. Austin and Houston values ticked up 4 and 3 percent MOM, respectively, contributing to the majority of the 2 percent uptick in statewide values. Dallas and San Antonio posted negative numbers at 1 and 3 percent, respectively.
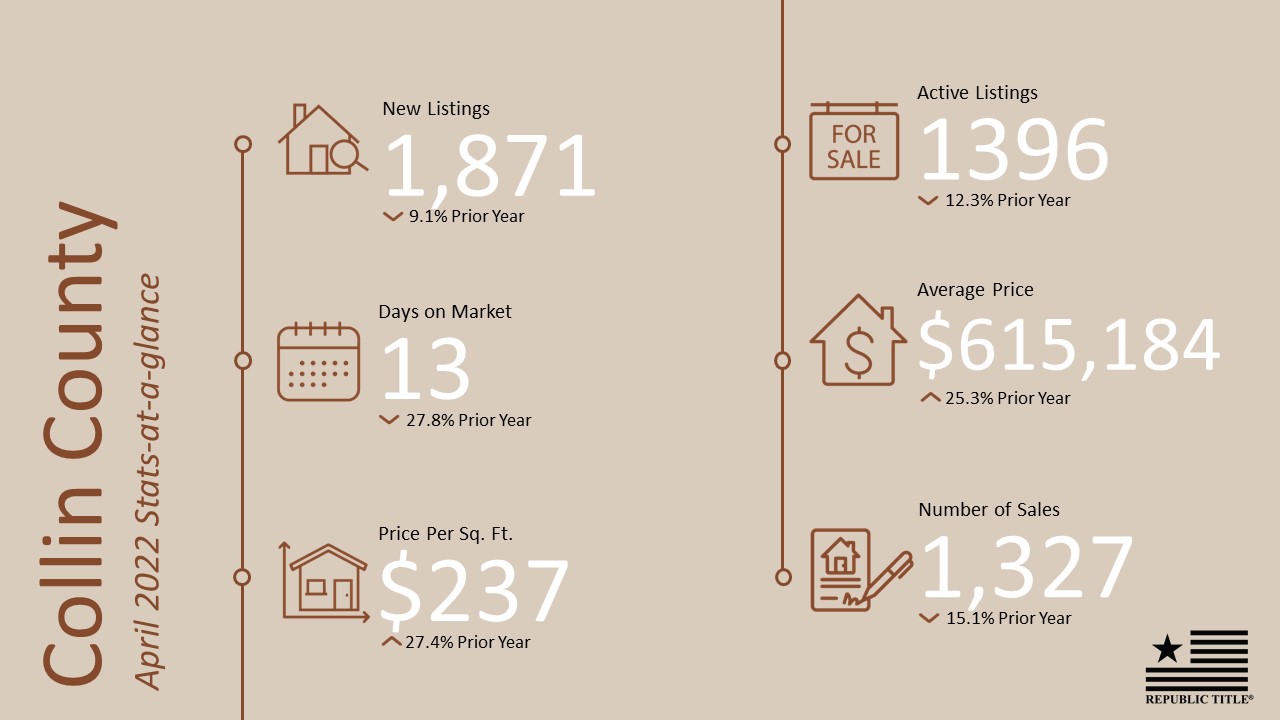
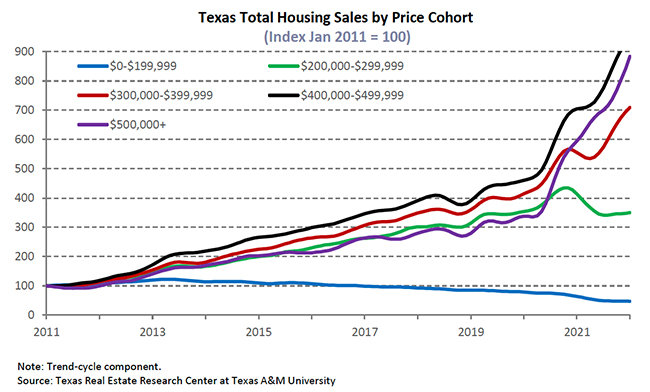
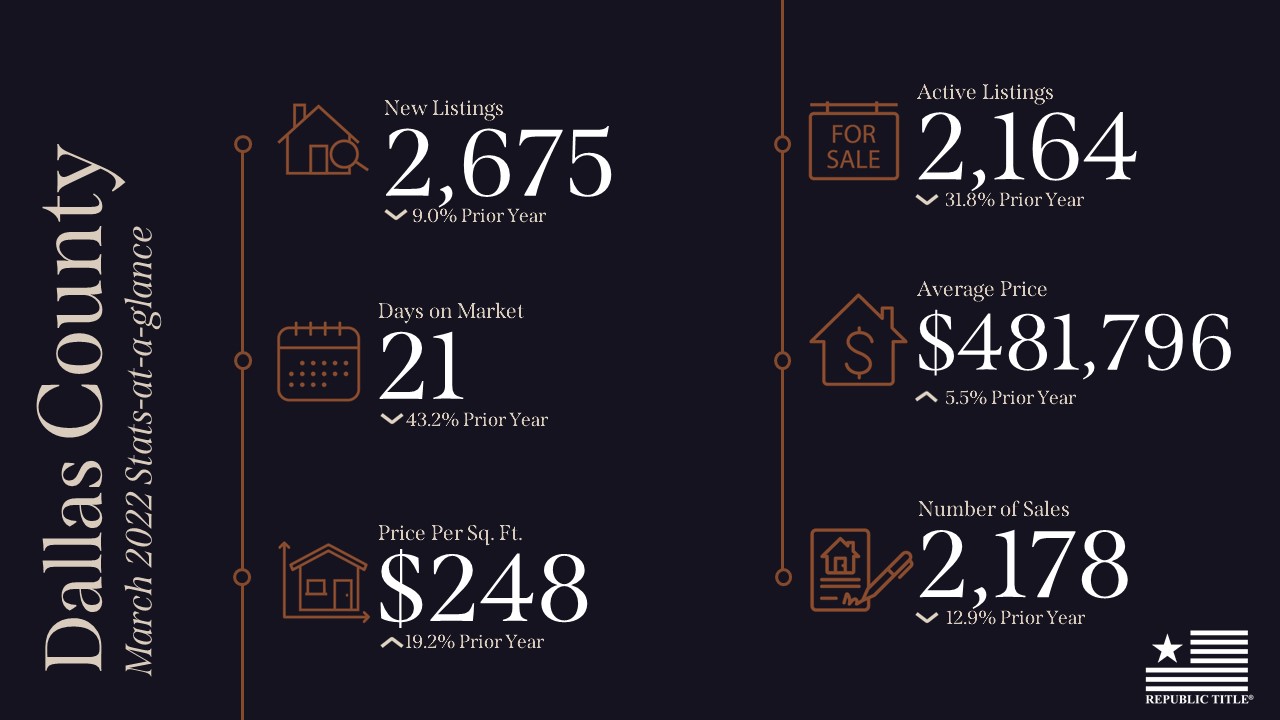
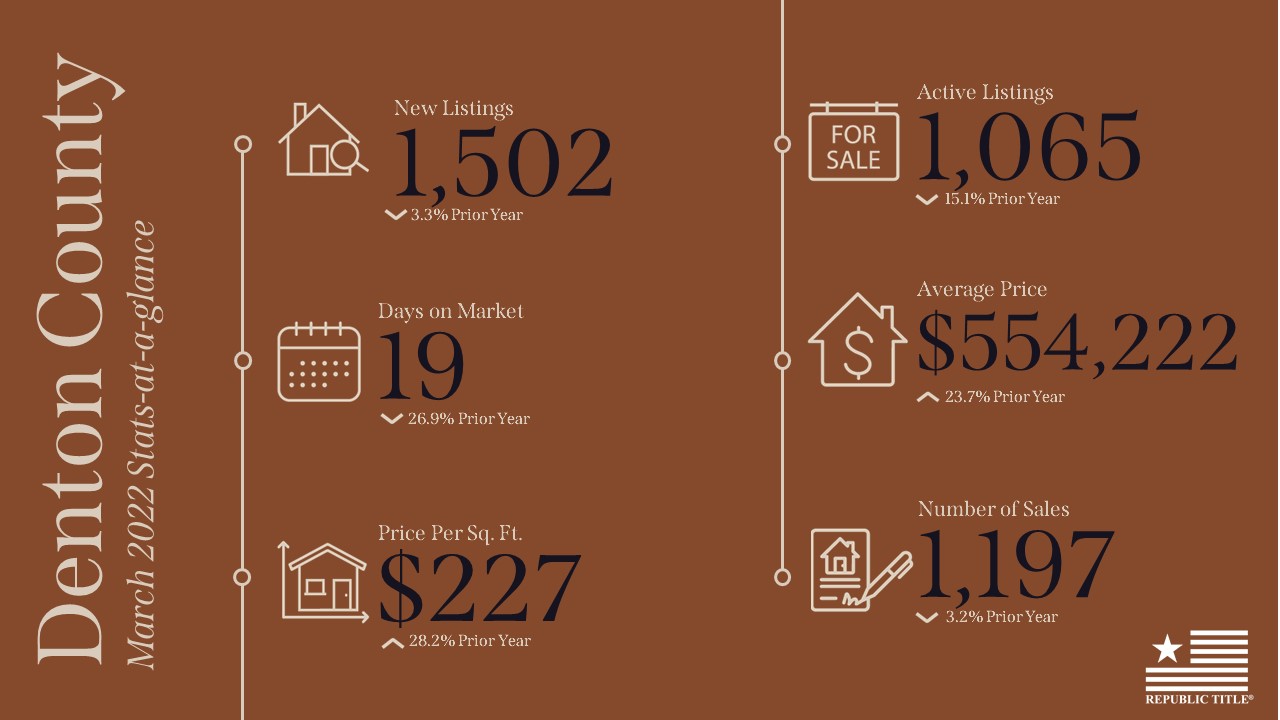
Texas’ months of inventory (MOI) fell to 1.4 months as active listings remained retracted while demand stayed high. A total MOI around six months is typically considered a balanced housing market. Supply remained severely limited, dropping across all price categories but most notably for homes in the lowest price range. The inventory for homes priced $200,000-$299,999 dropped to 0.94 months, and the lowest cohort (homes price less than $200,000) dropped 0.1 to 1.34 months. Total housing inventory in the major metros dropped significantly with the MOI remaining most constrained in Austin at 0.4 months. The metric in North Texas fell to 0.7 and 1.0 months in Dallas and Fort Worth, respectively. Houston’s MOI stayed steady at 1.6 months, while San Antonio declined to 1.5 months. Dwindling inventory persisted as a major headwind to the health of Texas’ housing market.
Demand
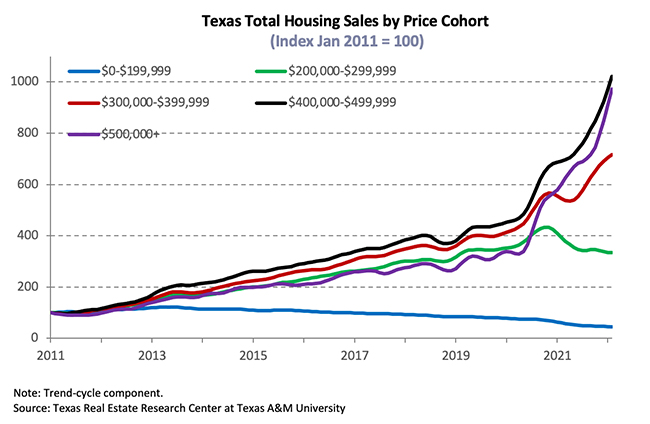
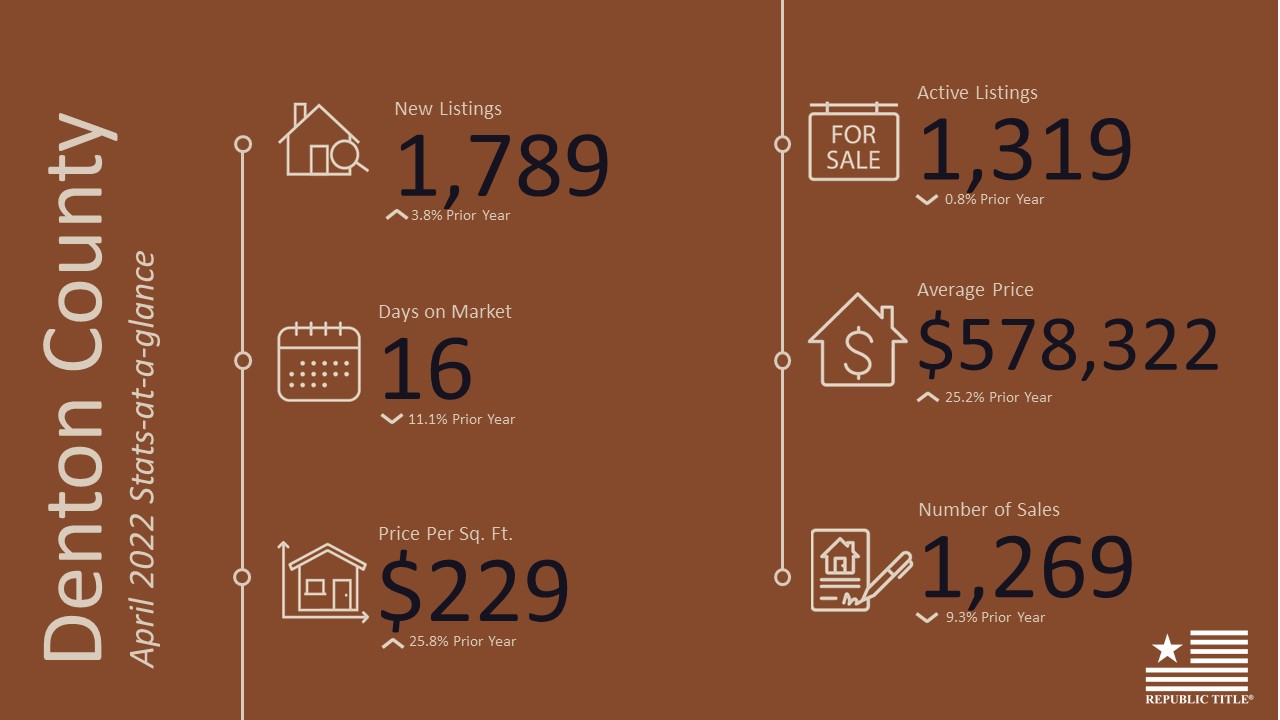
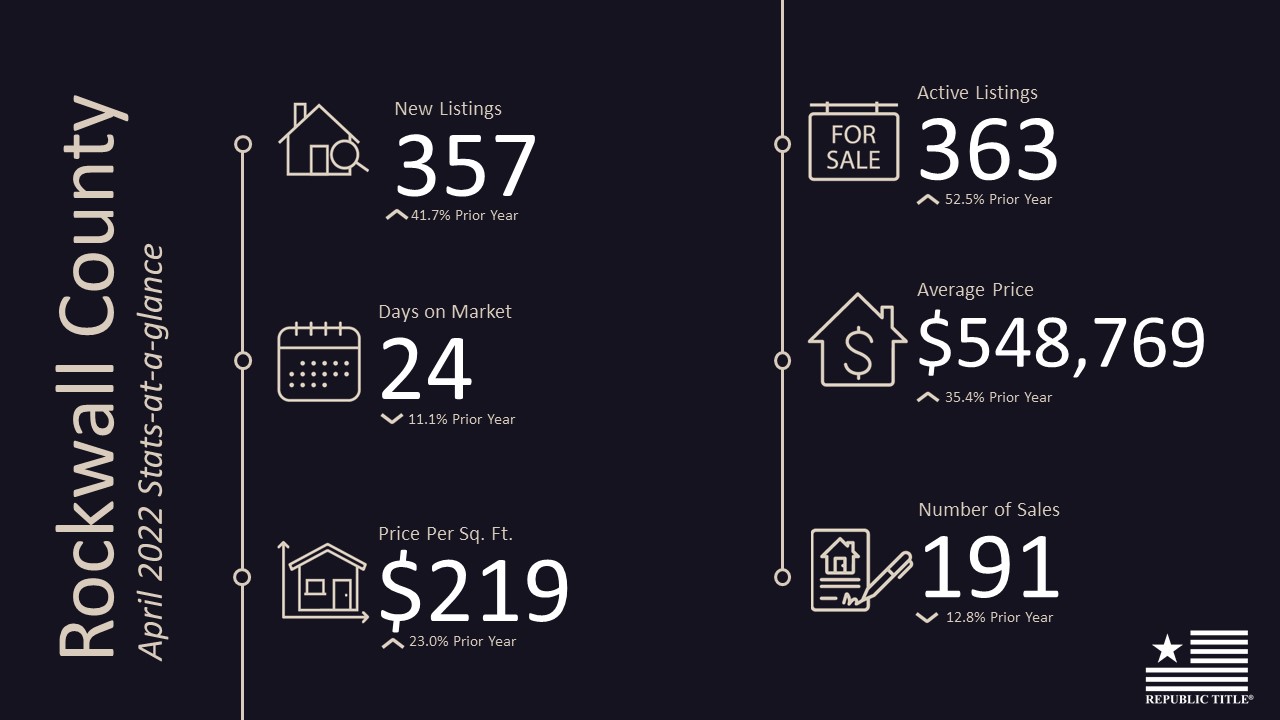
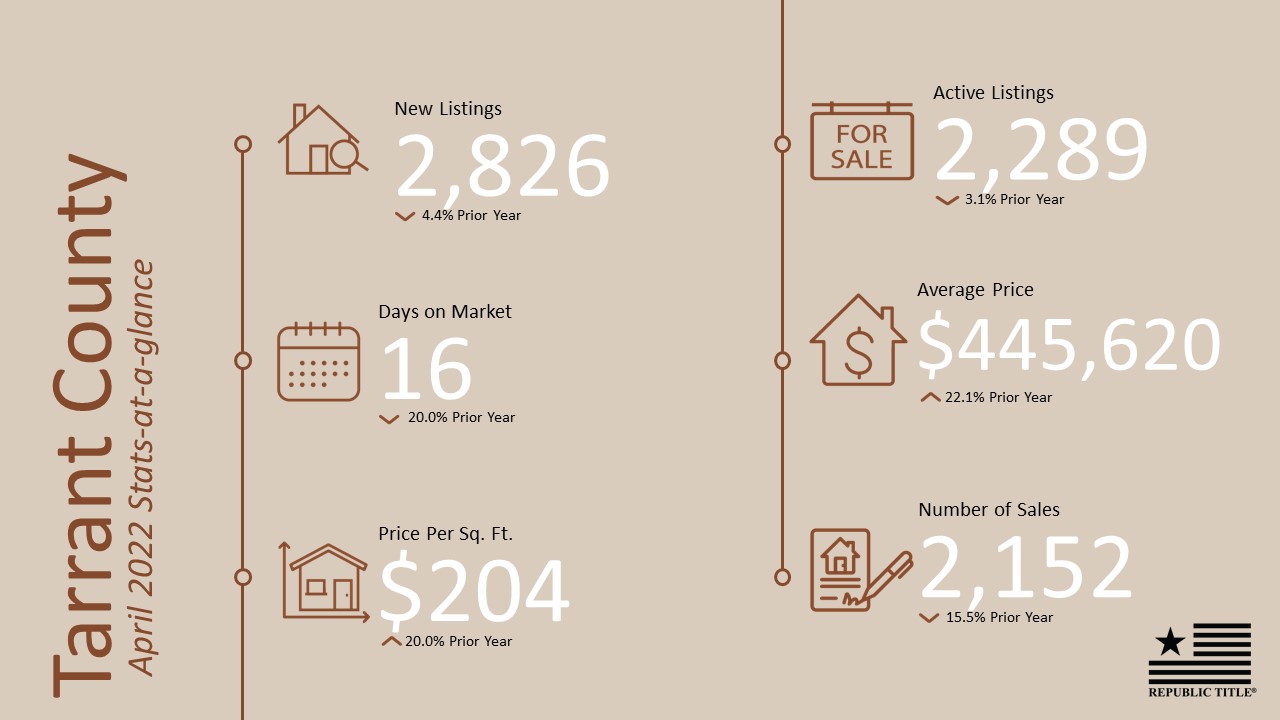
Monthly housing sales reached an all-time high for January in Texas with 38,900 closed listings in January. Total housing sales started off strong in 2022 with a 9.5 percent MOM increase, and the gains occurred across all price cohorts. The greatest increase was the $400,000-$499,999 cohort at 24 percent, while the lowest cohort rose only 4.7 percent by comparison. Houses in cohorts priced above $300,000 nearly doubled the percent gains in sales compared with those priced in the lowest two categories.
Housing sales increased across all major metros, led by Houston at 20.6 percent MOM. San Antonio followed with a hike of 8.7 percent. Meanwhile, Dallas and Austin experienced a 5.2 and 5.0 percent sales increase, respectively.
Texas’ average days on market (DOM) rose marginally to 33 days, increasing 0.5 percent MOM. The state DOM started rebounding since hitting a historical low of 29 days in August 2021, and it had continued rising for five consecutive months. Despite the marginal improvement in the buyers’ market, Austin remained the hottest housing market with an average DOM of 23 days. Dallas and Fort Worth’s DOM remained steady at an average of 26 days. DOMs for Houston and San Antonio were slightly higher than the state average, both at 34 days.
Market expectations are for the Federal Reserve to accelerate the tapering of assets purchases and to increase the Federal Funds rate in 2022 in an effort to combat rising inflation. The ten-year U.S. Treasury bond yield rose to 1.8 percent2, up 30 basis points from the previous month. The Federal Home Loan Mortgage Corporation’s 30-year fixed-rate hovered around 3.1 percent for the third consecutive month. The median mortgage rate for the typical Texas homebuyer climbed to 3.3 percent for GSE loans in December3 and rose to 3.1 percent for non-GSE loans. Refinance applications have declined on a monthly basis and were down 37.5 percent year over year (YOY). MOM purchase and refinance applications diminished 12.4 and 13.6 percent, respectively. (For more information, see Finding a Representative Interest Rate for the Typical Texas Mortgagee).
In December, the median loan-to-value ratio (LTV) constituting the “typical” Texas conventional-loan mortgage dropped from 86.7 a year ago to 83.5. The debt-to-income ratio (DTI) declined from 35.8 to 35.3 YOY, while the median credit score increased 4.8 points to 753 over the same period. The LTV for GSE borrowers dipped slightly from 85.3 in November to 84.9; meanwhile, their DTI also dropped slightly from 36.6 to 36.3.
Prices
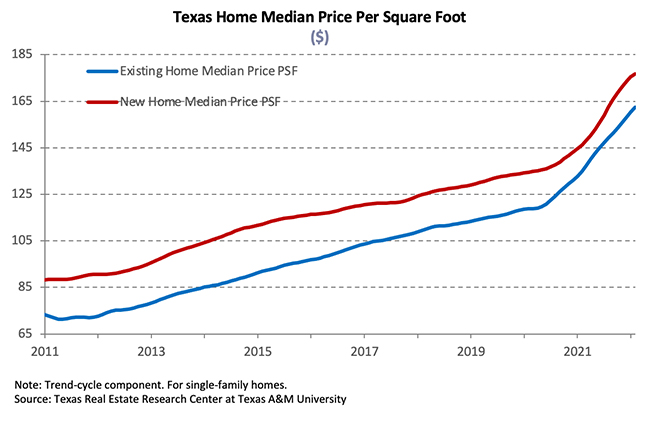
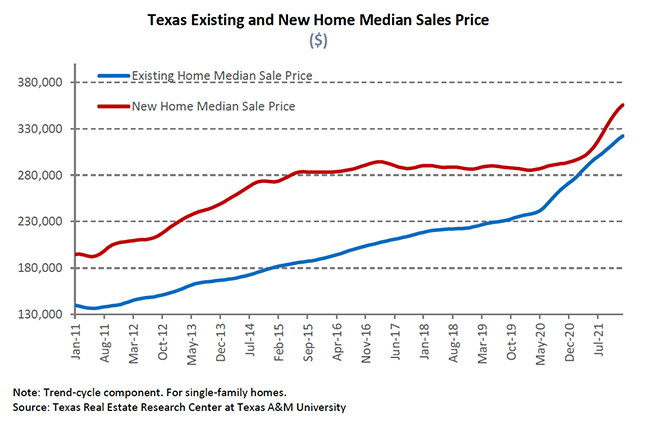
The ongoing shift in the composition of sales and price effects boosted the average and median home price. The Texas median home price rose for the 14th consecutive month, appreciating 1.9 percent on a monthly basis and 16 percent YOY to a record-breaking $376,363. The five major metros all hit historically high median prices. Austin led the pack with a median home price of $518,390 increasing 3.3 percent MOM. Dallas followed suit rising 2.7 percent to reach a median price of $408,572. The Houston metric ($325,077) and Fort Worth metric ($339,679) increased 2.5 percent and 1.8 percent, respectively, while the San Antonio metric ($308,279) gained a modest 0.7 percent.
The Texas Repeat Sales Home Price Index accounts for compositional price effects and provides a better measure of changes in single-family home values. Compared with January 2021’s 8.9 percent YOY increase, Texas’ index corroborated significant home-price appreciation, accelerating 19.6 percent YOY in 2022. The repeat sales index accelerated in all major metros for 14 consecutive months. The metric grew most rapidly in Austin with a 33.7 percent YOY increase. San Antonio posted a 19.9 percent annual hike, where Houston reported a similar climb of 16.5 percent. Prices in North Texas increased 26.2 and 23.8 percent in Dallas and Fort Worth, respectively. Increasing home prices pressured housing affordability, decreasing Texas’ affordability advantage over other states like California.
Single-Family Forecast
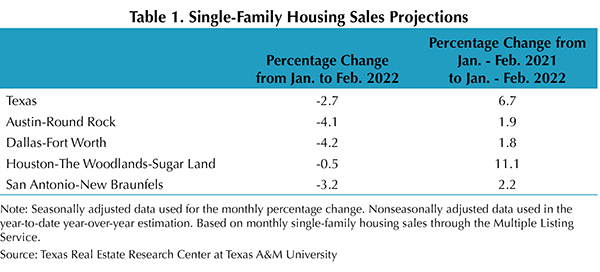
The Texas Real Estate Research Center projected single-family housing sales using monthly pending listings from the preceding period (Table 1). Texas sales reached a recent peak in December 2021, and the values have since declined. In February, Texas sales are expected to fall 2.7 percent. Likewise, the metric is estimated to dip 0.5 percent in Houston. Transactions in San Antonio are forecasted to plummet 3.2 percent. Austin and DFW are expected to see significant losses of 4.1 percent and 4.2 percent, respectively. Despite the monthly declines, sales from January to February 2022 should accelerate relative to the same period in 2021, with Houston anticipating a cumulative growth of 11.1 percent.
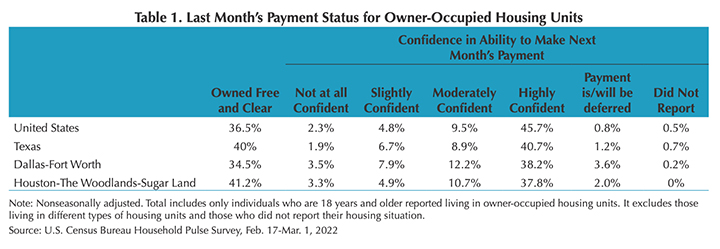
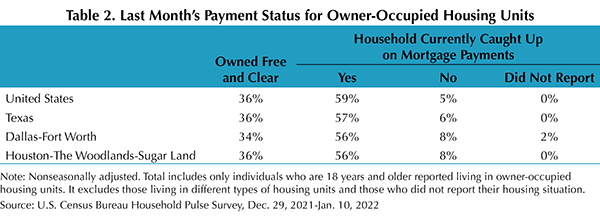
Household Pulse Survey
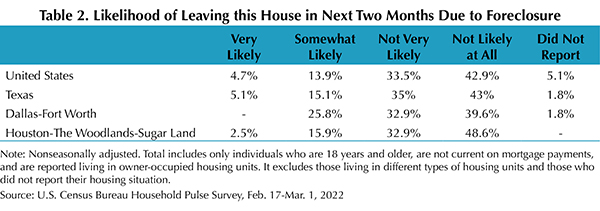
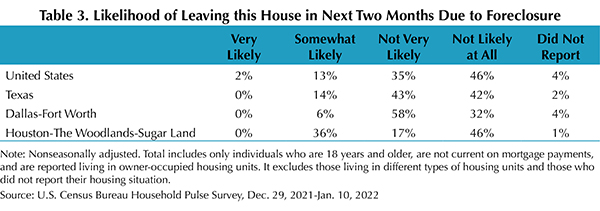
According to the U.S. Census Bureau’s Household Pulse Survey, the share of homeowners behind on mortgage payments balanced on the national level, and the share stepped up at the state level (Table 2). Meanwhile, for these mortgage owners, fewer of them needed to face the possibility of leaving due to foreclosure in Texas. The share of Texas respondents who reported themselves in the “not likely at all” group for leaving their house due to foreclosure jumped 15 percent, while the share reporting “somewhat likely” plummeted 9 percent (Table 3). In Houston, while the delinquent homeowners due to foreclosure remained high, more than half of the “not very likely” group predicted themselves as “not likely at all” to leave their house due to financial difficulties.