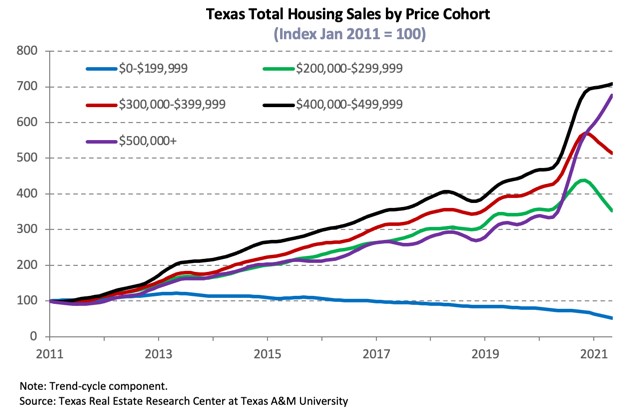


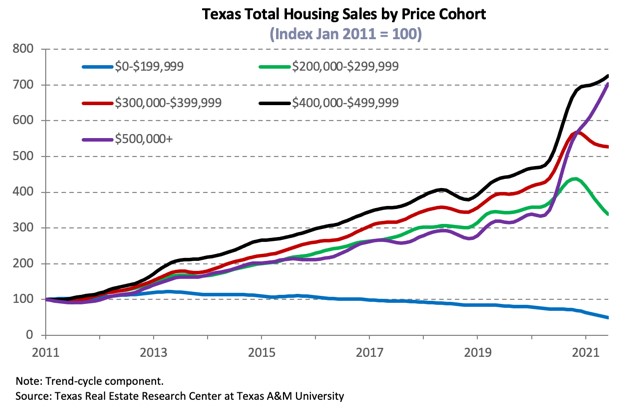
Total Texas housing sales fell 2.0 percent during the second quarter as inventories remained relatively low in June. Most of the quarterly decline can be attributed to the lack of existing homes priced less than $400,000, offsetting elevated luxury-home sales in the resale market and overall growth in new-home sales. Texas’ homeownership rate decreased amid reduced housing affordability. Overall, housing demand remained healthy but was hindered by depleted inventories, pushing median home-price growth into double-digit territory for the year. Supply-side indicators surged in response to the unprecedented low level of inventory and remained positive compared with year-ago levels.
Supply1
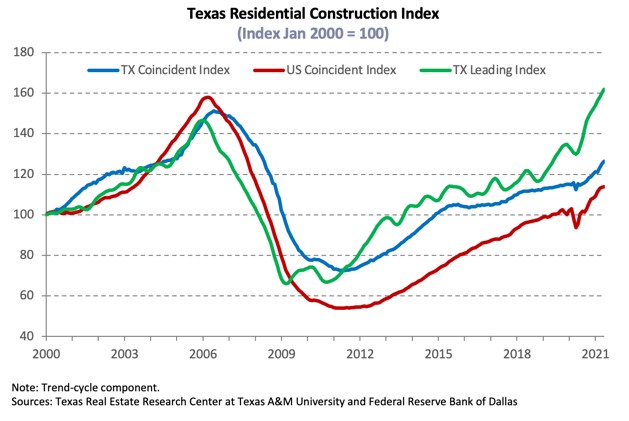
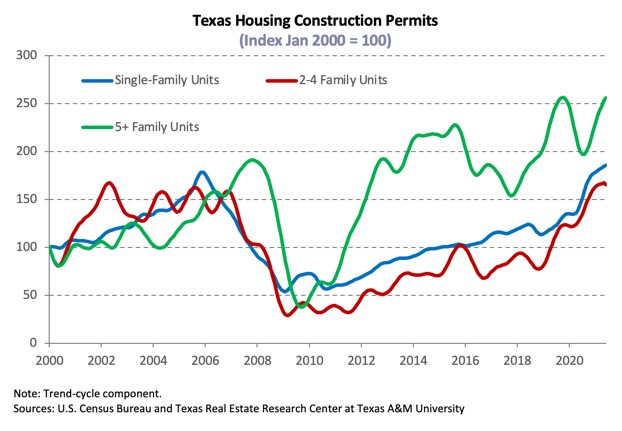
The Residential Construction Cycle (Coincident) Index, which measures current construction levels, elevated nationally and within Texas due to improved industry wages, employment, and construction values during June. Construction activity is expected to remain strong in coming months as indicated by the Texas Residential Construction Leading Index (RCLI), which rose to a record high amid elevated weighted building permits and housing starts as well as a decrease in the ten-year real Treasury bill yield. Although the RCLI indicated strong future activity, the trend flattened as growth rates in building permits and housing starts decelerated. Austin’s leading index reflected statewide fluctuations and similarly reached an all-time high. Houston and San Antonio’s indexes increased, despite issuing fewer building permits. The indexes in the North Texas metros flattened as weighted building permits and residential starts decreased.
According to Zonda, supply-side activity surged at the earliest stage of the construction cycle with a 21.0 percent quarterly increase in the number of new vacant developed lots (VDLs). Austin accounted for most of the gains as VDLs intended for homes selling for more than $400,000 doubled. Development also soared in San Antonio as activity heated up for lots targeted for homes priced between $300,000 and $399,000. New VDLs picked up for the second straight quarter in Dallas-Fort Worth (DFW) despite reduced investment in homes priced more than $500,000. Conversely, Houston’s lot development remained flat mainly due to depressed activity at the bottom of the price spectrum.
Quarterly fluctuations in single-family construction permits reflected movements in VDLs, although the metric receded 6.1 percent on a monthly basis, flattening the trend after a year-long rise. Houston and DFW topped the national list at the metropolitan level and accounted for most of the state’s improvement, issuing 4,789 and 4,627 non-seasonally adjusted permits, respectively. In Central Texas, permits staggered in June but trended upward after strong quarterly growth. Austin issued 2,346 single-family permits, while San Antonio issued 1,270. Meanwhile, Texas’ multifamily sector registered a surge in issuance as investment shifted from duplexes, triplexes, and four-unit structures to five-or-more units. The multifamily metric remained up 13.5 percent year to date (YTD) relative to the same period last year.
Even as lumber price remained at historically elevated levels, total Texas housing starts increased after stalling during the first quarter. Zonda data revealed roughly 36,800 homes broke ground in the Texas Triangle in 2Q2021, pushing single-family housing starts up 7.2 percent on a quarterly basis amid strengthening economic conditions and robust housing demand. Housing starts in North Texas reached an all-time high, increasing 14.5 percent from last quarter. Activity increased in Houston and San Antonio for homes priced more than $300,000 but slowed in Austin for similarly priced homes.
Single-family private construction values fell from last month’s record high as the metric trended downward in all of Texas’ major metros except San Antonio. Values there normalized quarter over quarter (QOQ). Austin’s single-family construction contracted 1.6 percent. Despite the downward trend, activity in Houston and DFW expanded 6.6 and 2.5 percent QOQ, respectively.
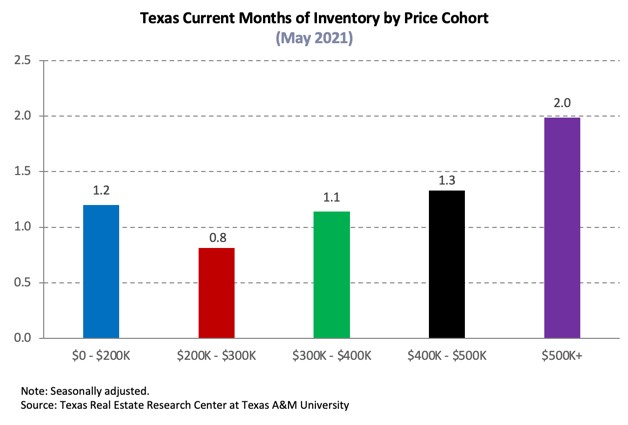
The number of homes added to Texas Multiple Listing Services ticked up in June after falling to historical lows. Sales, however, declined as home prices continued to climb, nudging Texas’ months of inventory (MOI) up to just 1.3 months. A total MOI around six months is considered a balanced housing market. Inventory for homes priced less than $300,000 remained hyper-constrained, dropping to 0.9 months. Meanwhile, the MOI for homes priced between $400,000 and $499,999, the price range at which inventory was at its most expansive, expanded to 2.1 months.
Supply in the major metros was even more constrained, although inventories expanded slightly. Austin’s MOI rose to half a month, while the metric in North Texas and San Antonio flattened to 1.0 and 1.2 months, respectively. Although Houston’s overall MOI was greater than the state average at 1.4 months, inventory for homes priced less than $300,000 slipped below 0.8 months. Depleted inventory is a major headwind to the continued health of Texas’ housing market.
Demand
Sales slowed in June amid ongoing inventory constraints, marking the fifth consecutive quarterly decline as total housing sales fell 2.0 percent QOQ. Activity for homes priced less than $400,000 offset quarterly growth of 11.5 percent in the luxury-home sector. Although the overall decrease occurred in all major metros, only San Antonio and Dallas posted quarterly contractions below the state average.
In contrast to decreased quarterly sales in the existing-home market, Zonda data revealed positive sales growth in three of the major metros’ new-home sectors. New-home sales in Austin, however, tumbled 14.9 percent to 4,936 sales, marking the second consecutive quarterly decline despite accelerated activity for homes priced more than $400,000. New-home sales in North Texas and Houston grew 5.2 and 3.9 percent QOQ, respectively, even as transactions diminished for homes priced less than $300,000. San Antonio’s metric climbed 2.2 percent QOQ.
Amid recovering economic conditions and overall robust sales activity, Texas’ homeownership rate declined to 63.6 percent, 1.8 percentage points below the U.S. rate, per the U.S. Census Bureau’s Current Population Survey/Housing Vacancy Survey. Nationally, homeownership improved for white households but decreased for minority households and householders between the ages of 35 and 44 years. Metro-level homeownership rates exceeded the national average only in Austin and Houston, where they improved to 65.4 and 66.0 percent, respectively. The metric fell in North Texas and San Antonio to 61.5 and 57.2 percent, respectively. Homeownership rates may continue depressed in the coming months as COVID-19 foreclosure-protection policies expire.
Texas’ average days on market (DOM) continued to trend downward, reaching a record low of 30 days. The historically low DOM indicated robust housing demand as sales decreased because of limited supply. Austin’s DOM shed almost six weeks off its year-ago reading, plummeting to an average of 15 days, while homes in North Texas sold after an average of just 22 and 23 days in Fort Worth and Dallas, respectively. San Antonio and Houston’s metrics also registered steep declines but hovered closer to the statewide average, falling to 30 and 33 days, respectively. All of the major metros experienced record lows in their average DOM, corroborating strong housing demand.
Amid low expectations of additional fiscal and monetary stimulus, economic growth forecasts for the rest of the year cooled as the initial and strongest stage of recovery likely reached its peak, and inflation pressures are believed to be temporary. The ten-year U.S. Treasury bond yield decreased to 1.5 percent after hovering at pre-pandemic levels of 1.6 percent2 for three consecutive months, but the Federal Home Loan Mortgage Corporation’s 30-year fixed-rate ticked up to 2.98 percent. The median mortgage rate within Texas held steady in May3 at 3.2 and 3.0 percent for GSE and non-GSE loans, respectively, but, similar to the national headline metric, remained below year-ago levels. Texas home-purchase applications declined for the third consecutive month in June, falling 25.4 percent YTD, and refinance applications declined 31.8 percent over the same period. Lenders adding more requisites and the shrinking pool of households able to refinance are likely impacting refinance activity. (For more information, see Finding a Representative Interest Rate for the Typical Texas Mortgagee.)
In May, the median loan-to-value ratio (LTV) constituting the “typical” Texas conventional-loan mortgage dropped from 88.3 a year ago to 83.3. The debt-to-income ratio (DTI) declined from 37.2 to 34.9, while the median credit score jumped 17 points in the last year to 756. The LTV and DTI for GSE borrowers decreased from 87.3 and 36.0 last April to 84.9 and 35.2, respectively. Overall improved credit profiles reflect the fact that only the most qualified housing applicants are able to outbid their competition for their desired homes amid exceptionally tight inventories and robust demand.
Prices
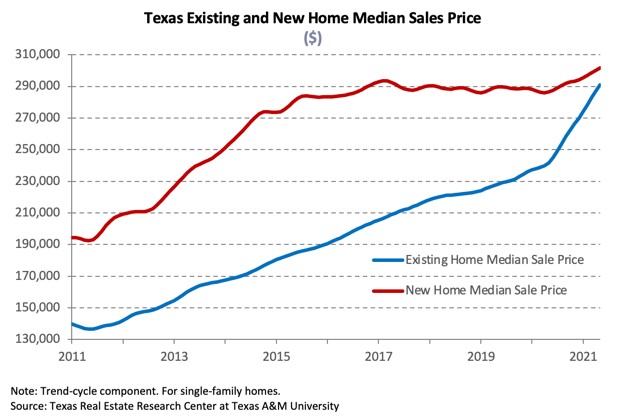
The Texas median home price rose for the sixth consecutive month, accelerating 19.3 percent YOY to a record-breaking $298,013 in June. The ongoing compositional sales shift toward higher-priced homes contributed to a higher median price. The share of luxury-homes sold in Austin more than doubled to two-fifths compared with the same time last year, contributing to the 43.2 percent YOY surge in the median price ($465,900). The Dallas metric ($364,400) increased 22.0 percent, while annual price growth in Fort Worth ($305,100) shot up to 21.7 percent after 23.6 percent growth the previous month. Houston ($301,000) and San Antonio’s ($279,300) metrics elevated 19.4 and 15.7 percent, respectively.
The Texas Repeat Sales Home Price Index accounts for compositional price effects and corroborated substantial and unsustainable home-price appreciation as the index soared 13.3 percent YOY. The metric skyrocketed 36.0 percent in Austin, followed by North Texas with annual home-price appreciation at 16.7 and 15.3 percent in Dallas and Fort Worth, respectively. San Antonio posted a 12.9 percent annual hike, while Houston’s index registered double-digit growth for the first time since the series started in 2014, elevating 10.2 percent. Rapid price growth outpaced wage gains, adding additional pressure to housing affordability.
Single-Family Forecast
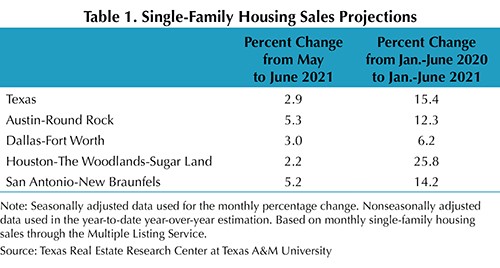
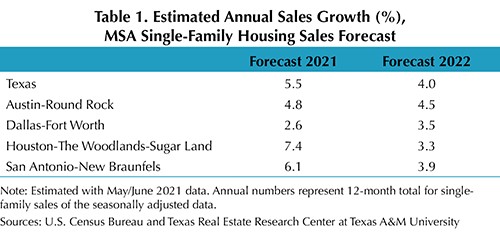
The Texas Real Estate Research Center updated its forecasts for 2021 and 2022 single-family housing sales (Table 1). Forecasts are subject to change due to the uncertainty surrounding the COVID-19 pandemic and the availability of reliable and timely data. Texas sales are expected to increase 5.5 percent in 2021. The housing market will continue to be characterized by strong demand with low inventories accompanied by strong price growth. Only sales in Houston and San Antonio are expected to exceed the state’s forecast, increasing 7.4 and 6.1 percent, respectively. Meanwhile, single-family sales in Austin and North Texas will likely normalize around 4.8 and 2.6 percent, respectively. Inventories of homes priced less than $300,000 will be especially low, affecting sales in that price range. Inventories should improve in the coming months as listings seem to have reached a trough and are rising, easing some of the price pressures.
Even with shortages of labor, appliances, lumber, and other construction materials driving up prices, new-home construction should register strong positive growth in 2021. The supply bottlenecks faced by homebuilders are anticipated to be resolved in the latter part of this year or next.
Economic growth and demographic trends, such as aging millennials and out-of-state migration, will help drive Texas housing demand in the remainder of 2021 and into 2022.
For 2022, expect the supply of homes for sale to increase and housing demand to remain relatively strong. This will help balance the market and slow home-price growth. Mortgage rates could be somewhat higher in 2022 than 2021 because of changes in the Fed’s monetary policy and because of inflationary pressures. If 2021’s high price growth is added to rising mortgage rates, demand should weaken in 2022. Affordability will continue to be an issue for buyers looking to purchase starter homes less than $300,000. In some regions, it will worsen as sharp increases in land, labor, and material costs make it difficult to build homes in that price range profitably.
Delinquencies and foreclosures will probably increase once forbearance ends in the fall of 2021. Both have been kept low due to government policies, but they are no longer seen as major issues facing the housing market because of the recovery in the labor market and government transfers benefiting households that in the past couldn’t make their mortgage payments on time. Also, given the lack of homes available for sale, the market could absorb an increased number of homes in delinquency or foreclosure. These homes could possibly be sold with a gain even before they enter into foreclosure. (For more information, see 2021 Mid-Year Texas Housing & Economic Outlook.)
Household Pulse Survey
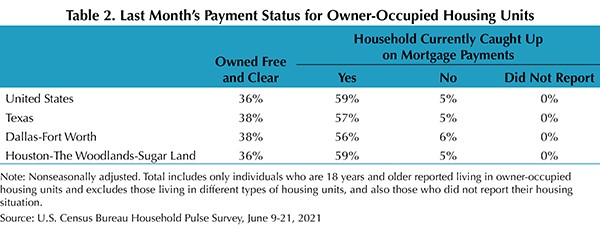
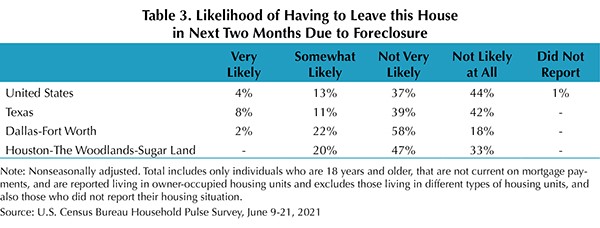
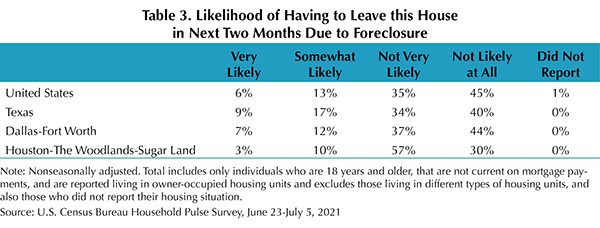
According to the U.S. Census Bureau’s Household Pulse Survey, the share of Texas homeowners behind on their mortgage payments increased to 6 percent in June (Table 2). The metric within Texas’ largest metropolitan areas, however, decreased below the statewide average to 5 percent in Houston and DFW. The share of Texas respondents who were not current and expected foreclosure to be either very likely or somewhat likely in the next two months grew to 26 percent in June, higher than the national rate of 19 percent (Table 3). The proportion of delinquent individuals who were at risk of foreclosure declined in North Texas and Houston, falling to 19 and 13 percent, respectively. The Federal Housing Finance Agency’s foreclosure and REO eviction moratoria for properties owned by Fannie Mae and Freddie Mac (the Enterprises) was extended through September 30, 2021. The Centers for Disease Control and Prevention renewed its federal eviction moratorium through the third quarter (October 3, 2021). Continued stability in the housing market is essential to Texas’ economic recovery.

________________
1 All measurements are calculated using seasonally adjusted data, and percentage changes are calculated month over month, unless stated otherwise.
2 Bond and mortgage interest rates are non-seasonally adjusted. Loan-to-value ratios, debt-to-income ratios, and the credit score component are also non-seasonally adjusted.
3 The release of Texas mortgage rate data typically lags the Texas Housing Insight by one month.

Source – James P. Gaines, Luis B. Torres, Wesley Miller, Paige Silva, and Griffin Carter (August 26, 2021)
https://www.recenter.tamu.edu/articles/technical-report/Texas-Housing-Insight