
Total Texas housing sales declined 4.1 percent in August from an all-time high the previous month as pent-up demand from the economic shutdown normalized. Nevertheless, sales were up 3.1 percent YTD compared with activity during the first eight months of 2019. Strong demand for housing supported permit issuance, which increased for the fourth straight month to record-breaking levels. Current inventory, however, extended a year-long fall, particularly at the bottom of the price spectrum. That shortage contributed to the shift in the distribution of sales toward higher-priced homes and pushed the median home price up 8.4 percent annually. The Real Estate Center’s Repeat Sales Home Price Index, however, suggested more moderate home-price appreciation while single-family housing sales in September are expected to recover fully from August’s backslide.
Supply
The Texas Residential Construction Cycle (Coincident) Index, which measures current construction levels, increased for the third consecutive month as industry employment, wages, and construction values inched up. The Residential Construction Leading Index also accelerated amid rising permit issuance, suggesting ongoing activity in the coming months. Conversely, the major metros’ leading indexes declined, with the exception of Houston, as multifamily building permits and housing starts dropped. A modest uptick in the real rate of the ten-year Treasury bill also pulled down the leading indexes.
Single-family construction permits increased 6.6 percent, a moderate improvement compared with the previous three months but still reached a record-breaking 14,000 permits. Texas remained the national leader, contributing 16 percent of the national total. All of Texas’ major metros issued post-Great Recession highs after accounting for seasonality, except for San Antonio, where the metric recorded 920 nonseasonally adjusted permits. Houston and Dallas posted 4,768 and 3,906 permits, respectively, while Austin issued 1,854. On the other hand, Texas’ multifamily permits dropped 28.4 percent, with the year-to-date (YTD) sum running 4 percent behind the total during the same period last year.
Total Texas housing starts fell 24.5 percent in August, normalizing to their two-year average as lumber prices accelerated for the fourth straight month. Single-family private construction values also slowed, although growth was still positive at 2.9 percent. The improvement was largely due to Austin values skyrocketing 30.4 percent to a record high. The metric increased modestly in North Texas and decreased slightly in San Antonio, while Houston values backtracked 14.6 percent.
The number of new listings hitting the market has failed to keep pace with sales, pulling Texas’ months of inventory (MOI) down to a record 2.4 months. A total MOI around six months is considered a balanced housing market. Inventory for homes priced less than $300,000 was even more constrained, sliding to less than 1.8 months. The MOI for luxury homes (homes priced more than $500,000), although elevated at 6.3 months, decreased for the third straight month.
Inventory was even more limited in the major metros, falling to 1.2 months in Austin as the MOI for homes priced from $200,000-$400,000 plummeted below one month. In North Texas, the MOI dropped to 1.9 and 1.7 months in Dallas and Fort Worth, respectively. San Antonio’s metric sank to 2.3 months, while Houston’s MOI slipped to 2.7 months.
Demand
Total housing sales decreased 4.1 percent in August from an all-time high the prior month as pent-up demand from the economic shutdown waned. The trend, however, remained on an upward trajectory as low mortgage rates stimulated activity. Every price cohort less than $400,000 registered a decline in sales; on the other hand, a record-breaking 4,000 luxury homes were sold. The number of Texas’ sales transactions so far in 2020 outpaced last year’s eight-month sum by 3.1 percent. National YTD sales fell half a percent relative to the same period in 2019.
Sales also declined at the metropolitan level, most notably in Houston, which registered a 7.9 percent monthly drop. Most of the pullback in activity was due to a reduction in sales for homes priced less than $400,000. The metric in Dallas and Fort Worth decreased 5.2 and 4.1 percent, respectively, while San Antonio sales fell 2.9 percent. Austin was the exception, although the increase in sales was modest. Nevertheless, the metric posted a record-breaking 3,622 sales as the share of luxury homes sold exceeded one-fifth for the first time ever.
Texas’ average days on market (DOM) slid below year-ago levels to 57 days, corroborating robust demand despite the pandemic-induced recession. The average home in all four major metros sold faster than during August 2019, with the Dallas and Fort Worth metric decreasing to 48 and 44 days, respectively. Austin’s DOM shaved almost two weeks off its reading from last year, falling to 49 days. At 58 days, the DOM in Houston and San Antonio, however, was slightly higher than the statewide average.
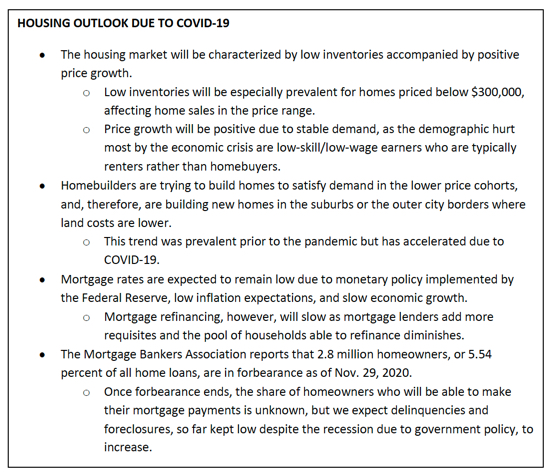
Persistent economic uncertainty surrounding the pandemic kept interest rates at historically low levels. The ten-year U.S. Treasury bond yield inched up slightly but stayed below 0.7 percent*, while the Federal Home Loan Mortgage Corporation’s 30-year fixed-rate was less than 3 percent for the first time in series history (starting in 1971). Mortgage rates extended a year-and-a-half-long slide within Texas during July, falling to 3.18 and 3.21 percent for non-GSE and GSE loans, respectively. The slide in rates pushed home-purchase applications up 15.1 percent YTD in August. Refinance activity continued to normalize after spiking at the onset of the pandemic but still remained 40 percent above year-end levels. (For more information, see Finding a Representative Interest Rate for the Typical Texas Mortgagee.)
In July, the median loan-to-value ratio (LTV) and debt-to-income ratio (DTI) constituting the “typical” Texas conventional-loan Texas mortgage decreased for the second straight month from 86.5 and 35.1 to 82.3 and 33.6, respectively. Meanwhile, the median credit score ticked up from 751 to 758, its highest reading in almost three decades. The median LTV (86.0) and DTI (35.5) of the typical Texas borrower who obtained a loan from a government-sponsored enterprise (GSE) also declined, albeit less drastically than the corresponding components of the typical conventional loan (from 86.7 and 35.6, respectively). The improved credit profiles may reflect tightening lending standards as economic uncertainty looms heading into autumn.
Prices
The Texas median home price flattened at $261,300 in August but climbed 8.4 percent year over year (YOY). The annual growth rate in Central Texas and Dallas surpassed the state average, pushing the median price to $347,800 and $251,000 in Austin and San Antonio, respectively, and $319,800 in Dallas. On the other hand, YOY growth slowed to around 6.5 percent in both Fort Worth and Houston for a median price of $260,700 in the former and $260,600 in the latter. The growth rate in median sale price reflects the relative strength of demand for higher-priced homes as the lower-end of the market has been more vulnerable to recent employment shocks and constrained inventory.
The Texas Repeat Sales Home Price Index accounts for such compositional effects and provides a better measure of changes in single-family home values. The index suggested more moderate home-price appreciation than the change in the median price, but it still accelerated 5.4 percent annually in August compared with 4.2 percent the month prior. Austin’s metric rose at the fastest clip, jumping 8.3 percent and pushing the statewide rate above 5 percent for the first time in three years. The index climbed 5.7 percent in Fort Worth and 5.1 percent in San Antonio. The metric increased more moderately in Dallas and Houston, posting 4.6 percent and 4.1 percent YOY growth, respectively.
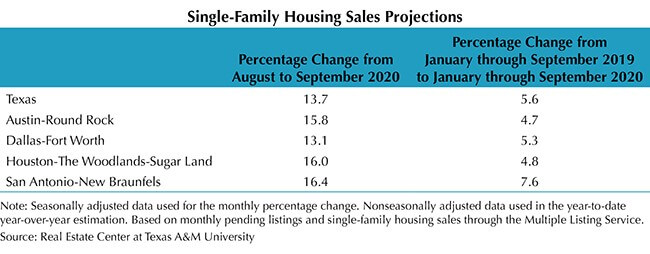
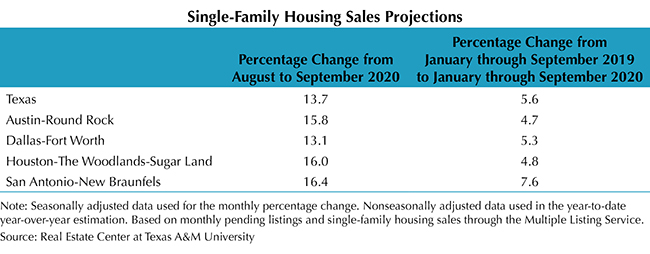
Single-Family Forecast
The Real Estate Center projected single-family housing sales using monthly pending listings from the preceding period (see table). Only one month in advance was projected due to the uncertainty surrounding the COVID-19 pandemic and the availability of reliable and timely data. Texas sales are expected to rebound 13.7 percent in September after decreasing by more than a tenth in August. The desire to capitalize on historically low interest rates is driving home sales with activity in Central Texas and Houston predicted to accelerate around 16 percent, while DFW sales are projected to increase 13.1 percent. Texas’ housing market remains a pillar of the state’s economic recovery.
________________
* Bond and mortgage interest rates are nonseasonally adjusted. Loan-to-value ratios, debt-to-income ratios, and the credit score component are also nonseasonally adjusted.
Source – James P. Gaines, Luis B. Torres, Wesley Miller, Paige Silva, and Griffin Carter (October 13, 2020)