The FAQs of Title Insurance for Homebuyers

For most of us, a home is the largest investment we’ll make in our lives. To buy with confidence, get owner’s title insurance. It’s the smart way to protect your property from legal claims. To help you understand how owner’s title insurance works, here are answers to common questions.

What is title?

Title is your right to own or use your property. Title also establishes any limitations on those rights.

What is a title search?

A title search is an early step in the homebuying process to uncover issues that could limit your rights to the property. After the title search is complete, the title company can provide a title insurance commitment and then, after any requirements are met and closing occurs, a title policy.

What is title insurance?

If you’re buying a home, title insurance is a policy that protects your investment and property rights.

There are two different types of title insurance: an owner’s policy and a lender’s policy.

  1. An owner’s policy is the best way to protect your property rights. Either the buyer or seller may pay for this policy. Ask your title professional how it’s handled in your area.
  2. A lender’s policy is usually required by the lender and only protects the lender’s financial interests. The buyer typically pays for this policy, but that varies depending on geography. Ask your title professional how it’s handled in your area.

Why should I purchase owner’s title insurance?

Owner’s title insurance protects your investment in your property from certain future legal claims regarding ownership of, or liens on, your property. For a one-time fee, you and your heirs* receive coverage for as long as you own your home. The owner’s policy also covers potential legal fees and court costs for settling claims covered by your policy.

What does owner’s title insurance cover?

Sometimes undiscoverable defects can come up after the title search. Under an owner’s title insurance policy, you are protected against certain undiscovered errors in the title.

Title issues include unknown:

  • Outstanding mortgages and judgments, or a lien against the property because the seller has not paid his taxes
  • Pending legal action against the property that could affect you
  • Unknown heir of a previous owner who is claiming ownership of the property

Unforeseeable title claims include:

  • Forgery: making a false document
    • For example, the seller misrepresents the identity of the person who sold the property.
  • Fraud: deception to achieve unfair gain
    • For example, someone steals your identity and either sells your house without your knowledge or consent, or takes out a second mortgage on the property and walks away with the money.
  • Clerical error: inconsistent paperwork and historical records
    • For example, an unforeseeable discrepancy in the property or fence line can cause confusion in ownership rights.

What does owner’s title insurance cost?

The one-time payment for owner’s title insurance is low relative to the value of your home. In Texas, rates are based on the sales price of the property and are set by the Texas Department of Insurance. You can calculate title insurance premium rates using the insurance calculator found on our website.

How long am I covered?

Your owner’s insurance policy lasts for as long as you or your heirs* own your property. Your life will change over time, but your protection never will.

What happens at closing?

Closing is the final step in executing the homebuying transaction and involves signing the documents that allows the creation of your new loan (if applicable), and transfer of ownership to occur. Upon completion of the closing and funding process, you get the keys to your home!


*This offers a brief description of insurance coverages, products and services and is meant for informational purposes only. Actual coverages may vary by state, company or locality. You may not be eligible for all of the insurance products, coverages or services described in this advertising. For exact terms, conditions, exclusions, and limitations, please contact a title insurance company authorized to do business in your location.

August 2020 DFW Area Real Estate Stats

The August 2020 DFW area real estate statistics are in and we’ve got the numbers! Take a look at our stats infographics, separated by county, with MLS area stats on each county report as well! These infographics and video are perfect for social sharing so feel free to post them!

To see past month’s reports, please visit our resources section here.

For the full report from the Texas A&M Real Estate Research Center, click here. For NTREIS County reports click here.

Texas Housing Insight – July 2020

Here is the July 2020 Summary from Texas A&M Real Estate Center.


Total Texas housing sales rose 17.1 percent in July, exceeding pre-pandemic levels with a record-breaking 36,165 sales amid historically low interest rates and steady demand. Supply-side activity bounced back with large increases in building permits and housing starts. Inventory levels, however, continued to trend downward, falling to an all-time low of 2.6 months. Strong demand and a dwindling number of listings contributed to accelerated home-price appreciation, but the pace ran below the seven-year averages in Texas’ major Metropolitan Statistical Areas (MSAs), except in Austin. Although the Real Estate Center’s single-family housing sales projection suggests activity took a step back in August from July’s high, the outlook remains overall positive.

Supply1

The Texas Residential Construction Cycle (Coincident) Index, which measures current construction levels, increased to its highest level this year as industry employment ticked up. Moreover, the Residential Construction Leading Index posted an all-time high due to record-low interest rates and rising building permits and housing starts, indicating strong activity in the coming months. The major metros’ leading indexes posted solid gains except for the San Antonio metric, which flattened as multifamily starts slowed.

Single-family construction permits rebounded completely from pandemic-related decreases in March and April, accelerating 21.8 percent to a post-crisis high to start the third quarter. Texas remained the national leader, contributing 16 percent of the national total. Houston and Dallas-Fort Worth (DFW) issued 4,952 and 3,750 nonseasonally adjusted permits, respectively, also peak levels since the Great Recession after accounting for seasonality. Permits increased to 2,077 in Austin and 1,002 in San Antonio. Texas’ multifamily sector improved as well, with permits rising 28.2 percent.

Total Texas housing starts continued to recover from coronavirus-related uncertainty, accelerating 39.8 percent to start the second half of the year just 2 percent below the post-Great Recession high reached in February 2020. Single-family private construction values, however, dipped 1.3 percent in July after two monthly increases. Most of the decrease was due to San Antonio’s 18.2 percent decline, offsetting Houston’s third straight improvement. DFW values ticked down, but the metric in Austin made up for a contraction the previous month.

Extended decreases in the supply of active listings and record sales pulled Texas’ months of inventory (MOI) down to an all-time low of 2.6 months. A total MOI of around six months is considered a balanced housing market. Inventory for homes priced less than $300,000 was even more constrained, sliding to less than 2.1 months. The MOI for luxury homes (homes priced more than $500,000) remained higher at 6.7 months despite dropping for the second straight month.

Inventory reached historical lows in all the major MSAs except for Houston, although the metro’s MOI ticked down to 2.8 months, its scarcest level in six years. The metric in Austin fell to 1.5 months while North Texas inventory slid to 2.1 and 1.9 months in Dallas and Fort Worth, respectively. San Antonio’s MOI inched down to 2.5 months.

Demand

Total housing sales reached a record-breaking 36,165 after climbing 17.1 percent in July, although the rate of increase moderated relative to the prior month. For the first time ever, sales for homes priced more than $400,000 accounted for more than 20 percent of total transactions while the share of sales of homes priced less than $200,000 sank to one-fourth.

Every major metro posted a historical number of sales, rebounding fully from sluggish activity earlier this year amid coronavirus concerns. While economic uncertainty is still prevalent, low mortgage rates and stable employment in the income bracket more likely to buy than rent supported the recovery. DFW led with 10,500 sales, but Houston and Austin registered the largest growth in percentage terms, with sales in each area increasing by one-fifth. Sales rose 12.9 percent in San Antonio, where the YTD sum outpaced transactions during the first seven months of last year by 4.3 percent.

Texas’ average days on market (DOM) stabilized at 64 days, suggesting the fluctuations from the economic shutdown in April have weakened. Similarly, upward momentum slowed to a halt at the metropolitan level. Demand was strongest in Fort Worth with a metric of 51 days. The DOM in Houston and San Antonio flattened to 65 and 66 days, respectively. Austin and Dallas’ DOMs posted solid declines, falling below year-ago readings to 54 days each.

During widespread local and federal eviction moratoria, the national and Texas foreclosure inventories fell to 0.7 and 0.5 percent, respectively, in 2Q2020. A recent extension of the Coronavirus Aid, Relief, and Economic Security (CARES) Act’s foreclosure moratorium (which prevents the lender or loan servicer from foreclosing on the home) for federally backed mortgages through the end of 2020 will help keep inventories from rising as much as they would under the previous expiration date of August 31. Under the CARES Act, borrowers have the right of up to 12 months of mortgage forbearance (an agreement to suspend payments without penalties).

Persistent economic uncertainty surrounding the pandemic kept interest rates at historically low levels. The ten-year U.S. Treasury bond yield moved above 0.7 percent2, but the Federal Home Loan Mortgage Corporation’s 30-year fixed-rate reached 3.0 percent for the first time in series history (starting in 1971). Mortgage rates extended a year-and-a-half-long slide within Texas, falling to 3.28 and 3.34 percent for nonGSE and GSE loans, respectively, pushing home-purchase applications up 8.3 percent YTD. Refinance activity slowly normalized after spiking at the onset of the pandemic. (For more information, see Finding a Representative Interest Rate for the Typical Texas Mortgagee.)

In June, there was a decrease in the median loan-to-value ratio (LTV) and debt-to-income ratio (DTI) constituting the “typical” Texas conventional-loan mortgage. Meanwhile, the median credit score shot up to an all-time high. The improved credit profile may reflect tightening lending standards as economic uncertainty looms heading into autumn. In contrast, both the median LTV and DTI of the typical Texas borrower who obtained a loan from a government-sponsored enterprise (GSE) increased for the fourth straight month.

Prices

Amid compositional changes in sales, the Texas median home price surged to $261,600 in July, climbing 9.3 percent YOY. Austin led with the greatest median home price of $347,200, followed by Dallas at $313,500. Houston’s metric surpassed the statewide average at $261,800, while the Fort Worth and San Antonio median prices were slightly lower at $257,200 and $252,300, respectively. The growth rate in median sale price, however, reflects the relative strength of demand for higher-priced homes as the lower-end of the market has been more vulnerable to recent employment shocks.

The Texas Repeat Sales Home Price Index accounts for such compositional effects and provides a better measure of changes in single-family home values. The index suggested more moderate home-price appreciation, rising 4.1 percent annually. Fort Worth’s metric tied the state’s in YOY growth, with the San Antonio index close behind, increasing 4 percent. In Dallas and Houston, the index rose 3.0 and 2.8 percent, respectively. On the other hand, price appreciation in Austin accelerated 7.2 percent, driving the statewide increase.

Single-Family Forecast

The Real Estate Center projected single-family housing sales using monthly pending listings from the preceding period (see table). Only one month in advance was projected due to the uncertainty surrounding the COVID-19 pandemic and the availability of reliable and timely data. Texas sales are expected to retreat 12.5 percent in August from July as the rush to capitalize on exceptionally low interest rates wanes and dwindling inventory inhibits activity. The downshift is not surprising given the unsustainable pace set in June and July fueled by pent-up demand from the economic shutdown. Nonetheless, overall monthly sales hover at high levels while the YTD sum through August 2020 is predicted to be greater than the sum of single-family sales in the first eight months of 2019. The estimated decline in the number of transactions from July to August 2020 is expected to be steepest in Houston, with sales projected to fall 16.4 percent. Dallas and San Antonio single-family sales are projected to decrease around 13 percent each, while Austin’s metric is projected to drop just 8.3 percent. Despite the slowdown, Texas’ housing market remains a pillar of the state’s economic recovery.

________________

All measurements are calculated using seasonally adjusted data, and percentage changes are calculated month over month, unless stated otherwise.

2 Bond and mortgage interest rates are nonseasonally adjusted.

Source – James P. Gaines, Luis B. Torres, Wesley Miller, Paige Silva, and Griffin Carter (September 14, 2020)

https://www.recenter.tamu.edu/articles/technical-report/Texas-Housing-Insight

REALTOR® Safety Tips

September is REALTOR Safety Month and there are tons of helpful safety tips to consider while showing real estate. Whether it be a safety strategy, safety apps, or hosting an open house, we hope that you find these tips useful.

Preview the Neighborhood
Preview the neighborhood and home before you show the home. Check for cell reception and familiarize yourself with entry and exit points in the home. If you cannot preview the home before showing it, at least review the floorplan so you know escape points.

Open House Safety
Don’t assume that everyone has left the premises at the end of an open house. Check all of the rooms and the backyard prior to locking the doors. Be prepared to defend yourself, if necessary.

Charged Cell Phone
Make sure your cell phone is fully charged when you are out showing.

Hide Personal Information
Tell your sellers: DON’T leave personal information like mail or bills out in the open where anyone can see it. Lock down computers and lock up laptops and any other expensive, easy-to-pocket electronics before your showing.

Nothing Personal
When talking to clients and prospects, be friendly but still keep your personal information private. This means avoiding mention of where you live, your after-work or vacation plans, and similar details.

Carry Less
If you carry a purse, lock it in your car trunk before arriving at an appointment. Carry only non-valuable business items (except for your cell phone), and do not wear expensive jewelry or watches, or appear to be carrying large sums of money.

Have an Excuse Ready
Having an excuse in mind can help you out of an uncomfortable situation. For example, you have to return an important missed call.

Take a Self Defense Class
Check with your broker to see if they would be willing to host a self-defense class at your office or call your local police department for additional class resources.

Download Safety Apps
There are dozens of safety apps for your phone that are specifically designed with REALTORS in mind. The majority of these apps provide GPS locating to your broker or emergency contacts when you’re out showing and let you enter in information about who you are meeting. The Nationals Association of REALTORs has a great list of safety apps on their website.

Make sure to check with your brokerage for any security measures that they have put into place.

For more real estate safety tips, visit nar.realtor/safety

Source: nvar.com, nar.realtor

July 2020 DFW Area Real Estate Stats

The July 2020 DFW area real estate statistics are in and we’ve got the numbers! Take a look at our stats infographics, separated by county, with MLS area stats on each county report as well! These infographics and video are perfect for social sharing so feel free to post them!

To see past month’s reports, please visit our resources section here.

For the full report from the Texas A&M Real Estate Research Center, click here. For NTREIS County reports click here.

Texas Housing Insight – June 2020

Here is the June 2020 Summary from Texas A&M Real Estate Center.


Total Texas housing sales rebounded almost 30 percent after three straight monthly declines corresponding to the initial wave of domestic COVID-19 cases. Falling interest rates and pent-up demand from the economic shutdown supported sales in the existing-home market and for new homes priced less than $300,000, pushing the Lone Star State’s second-quarter homeownership rate up to record-breaking levels. Ongoing uncertainty surrounding the virus, however, dampened supply-side activity in the second quarter with reduced lot development in all the major metros except for San Antonio and downward-trending building permits and housing starts. Although the pullback in construction is likely to be temporary, the decrease will exacerbate already low inventory levels.

Home-price appreciation accelerated in June after slowing to start the quarter. Nevertheless, housing affordability improved during the low interest rate environment and overall moderate price growth. The Real Estate Center’s single-family housing sales projection suggests a complete recovery in single-family homes sales will be reflected in July numbers. COVID-19 remains the greatest obstacle to the Texas housing market, and the resurgence in contracted coronavirus cases and hospitalizations in July could reverse progress.

Supply*

The Texas Residential Construction Cycle (Coincident) Index, which measures current construction levels, dipped slightly as construction values fell and hiring slowed. On the other hand, the Residential Construction Leading Index almost reached the post-recessionary high from December as interest rates continued to decrease and permits and housing starts picked up, suggesting positive momentum in the next few months. At the metropolitan level, Austin was the only major metro where the leading index decreased, pulled down by multifamily building permits.

According to Metrostudy, activity at the earliest stage of the construction cycle picked up slightly as the number of new vacant developed lots (VDLs) in the Texas Urban Triangle increased 3.5 percent quarter over quarter (QOQ). All of the second-quarter upturn, however, is due to VDLs in San Antonio more than doubling, with the $200,000-$300,000 price range accounting for most of the rebound. Houston and Austin’s 14.7 and 20.7 percent declines, respectively, kept total VDLs in negative YTD growth territory. The metric in Dallas-Fort Worth (DFW) ticked down 2.9 percent QOQ but the decrease slowed.

Despite sluggish activity to start the second quarter, single-family construction permits remained on track to exceed last year’s total after recovering 14.6 percent in June. Texas remained the national leader, contributing 16 percent of the national total. Nonseasonally adjusted permits increased to 1,105 and 4,028 in Fort Worth and Houston, respectively, almost reaching peak levels after accounting for seasonality. San Antonio permits rose to 889, while Austin and Dallas issued 1,540 and 2,358 permits, respectively. On the other hand, Texas’ multifamily fell 22.1 percent, declining for the third consecutive month.  

Total Texas housing starts rebounded 27.9 percent on a monthly basis but extended a downward trend. MetroStudy data revealed less than 26,000 single-family homes broke ground in the Urban Triangle during the second quarter, a 4.3 percent decline. Houston accounted for most of the decrease, with starts sinking 16.3 percent QOQ. The San Antonio metric fell for the second straight quarter, but activity in the $500,000-and-higher price range accelerated. In Austin and Dallas, however, starts increased 1.4 and 4.7 percent QOQ, respectively, with improvement in North Texas widespread.

After a brief reprieve in May, single-family private construction values decreased for the third time in four months, declining 18.8 percent. Quarterly construction values dropped across all four major metros due to the effects of the pandemic, ranging from a 22.75 percent plummet in DFW to 30.1 percent in Houston.

A dwindling supply of active listings and a resurgence in home sales pulled Texas’ months of inventory (MOI) down to an all-time low of 2.8 months. A total MOI around six months is considered a balanced housing market. Inventory for homes priced less than $300,000 was even more constrained, sliding below 2.1 months. The MOI for luxury homes (homes priced more than $500,000) also decreased, falling to 7.2 months.

Austin and San Antonio posted record-low inventories of 1.6 and 2.6 months, respectively. The MOI in Dallas declined to 2.3 months, while the Fort Worth metric dropped to 2.1 months. Only Houston maintained a MOI above the state average at three months.

Demand

Pent-up demand and record-low mortgage rates pushed total housing sales up 29.4 percent in June. Improvement stemmed from a pickup in existing-home sales transactions as activity in the new-home market stalled after a year of solid growth. Sales accelerated more than 6 percent QOQ for new homes priced less than $300,000, but the $400,000-and-higher price range took a large step back. The divergence exemplifies the increasing demand for more affordable homes as many millennials become first-time homebuyers.

Fluctuations in second-quarter new-home sales varied across the major metros. Houston posted its sixth consecutive improvement, pushing transactions to 8,732. San Antonio new-home sales rebounded 16.1 percent QOQ to 3,640 after faltering to start the year. Although activity in DFW decreased during the second quarter, North Texas remained the top market with 9,100 transactions. Austin extended a downward trend, selling only 4,736 new homes after reaching an all-time high in 4Q2019.

Despite falling sales in April and May, Texas’ 2Q2020 homeownership rate rose its highest level on record (beginning 1996) at 67.5 percent, lessening the gap between the national rate to only half a percent, the smallest in eight years. National homeownership rates were higher across all races, including minorities. At the metropolitan level, Austin registered the greatest increase in homeownership, rising almost 6 percentage points to 65.3 percent. The metric in DFW and San Antonio ticked up to 64.7 and 66.2 percent, respectively. Houston boasted the state’s highest percentage of occupied housing units that were owner-occupied at 68.2 percent. Homeownership, however, could suffer as COVID-19 foreclosure-protection policies expire.

Approximately two months after the forced economic shutdown, Texas’ average days on market (DOM) inched up to 64 days, at least partially due to slower activity during April. The major metros recorded softer demand. Houston and San Antonio’s metrics exceeded the state average, rising to above 64 and 65 days, respectively. The average home in North Texas sold after 59 days in Dallas and 51 days in Fort Worth. Austin was the exception, as the DOM decreased to 53 days compared with 57 days this time last year.

Continued uncertainty stemming from the ongoing spread of the coronavirus pandemic kept interest rates at historically low levels, although increased oil prices slowed the downward slide. The ten-year U.S. Treasury bond yield ticked above 0.7 percent, but the Federal Home Loan Mortgage Corporation’s 30-year fixed-rate sank below 3.2 percent for the first time in series history (starting in 1971). Mortgage applications for home purchases rose 9.8 percent, jumping into positive YTD growth territory. Refinance activity decreased for the third straight month but remained at levels one-and-a-half times greater than at year-end.

Elevated volumes of mortgage applications corresponded to falling Texas mortgage rates. (For more information, see Finding a Representative Interest Rate for the Typical Texas Mortgagee.) In May, the median back-end debt-to-income ratio (DTI), loan-to-value ratio (LTV), credit score, and interest rate constituting the “typical” conventional-loan Texas mortgage were 36.10, 85.57, 747, and 3.35 percent, respectively. The typical Texas borrower who obtained a loan from a government-sponsored enterprise had a DTI of 36.14 and LTV of 87.49 while receiving an interest rate of 3.45 percent.

Prices

The Texas median home price jumped 3.9 percent to $249,100 in June after subdued growth to start the second quarter. Annual price appreciation accelerated 4.2 percent. Movements in metropolitan median prices moved similarly to statewide fluctuations, with Austin’s metric leading the state at $324,700. The median price shot up to $298,800 in Dallas and exceeded $250,000 in Fort Worth and Houston. San Antonio’s median home price increased to $240,800.

The Texas Repeat Sales Home Price Index, a better measure of changes in single-family home values, provides insight into how Texas home prices evolve. The index corroborated healthy price appreciation, rising 4.5 percent YOY. The metric in North Texas also advanced, jumping 3.1 in Dallas and 4.3 percent in Fort Worth. The Austin and Houston indexes slowed but maintained healthy growth of 5.6 and 2.6 percent, respectively. Meanwhile, price appreciation in San Antonio stabilized at 3.5 percent.

Slower home-price growth and historically low interest rates increased housing affordability in Texas’ major metros during the second quarter. Houston and Fort Worth were the most affordable locales, with both indexes climbing to 1.8, indicating that a family earning the median income could afford a home 80 percent more than the median sale price. The metric in Austin and Dallas registered double-digit YOY gains, exceeding 1.7 and 1.6, respectively, with the former posting a five-year high. Meanwhile, San Antonio’s index rose steadily to 1.7. Continued improvement is important to Texas’ demographic advantages that have supported the state’s economic prosperity over the past decade.

Single-Family Forecast

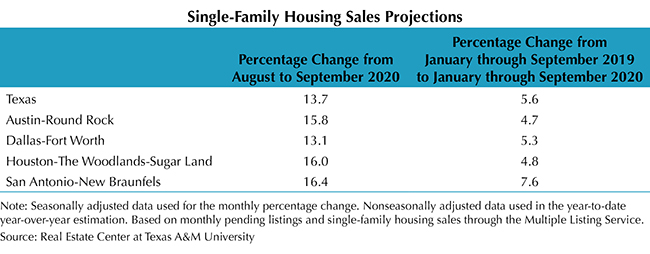
The Real Estate Center projected single-family housing sales using monthly pending listings from the preceding period (see Table 1). The Center projected only one month in advance due to uncertainty surrounding the COVID-19 pandemic and the availability of reliable and timely data. Sales are expected to rebound completely from the pandemic-induced shutdown in July. Texas single-family sales are estimated to increase 22 percent, while Houston should outshine the other metros with 25.2 percent growth. In Austin and Dallas, single-family sales are projected to bounce back 24.6 and 22.6 percent, respectively. San Antonio’s improvement is forecasted to be slightly lower than state’s at 17.8 percent but still sizeable nonetheless. Texas’ housing market recovery has so far outpaced its labor market’s less steady comeback.
________________

All measurements are calculated using seasonally adjusted data, and percentage changes are calculated month over month, unless stated otherwise.

Source – James P. Gaines, Luis B. Torres, Wesley Miller, Paige Silva, and Griffin Carter (August 12, 2020)

https://www.recenter.tamu.edu/articles/technical-report/Texas-Housing-Insight

6 Ways To Grow Your Real Estate Business By Using LinkedIn

LinkedIn is one of the most under-rated but highly valued networking sites you can be using in 2020!  The most important thing to remember about LinkedIn, at its core, it is an online resume.  It’s also likely to be among the first handful of results to come up on a Google search, and might be the first place a potential client looks to review your credentials.  Most clients won’t choose a real estate agent who appears to lack knowledge, education and expertise.  So it’s wise to set yourself up for success and utilize this powerful tool.

So, YES, LinkedIn is extremely important and a must-have in today’s digital world.  It’s also the perfect place to promote yourself, your real estate listing, and boast about the skills you bring to the table.

Here are the top 6 things you should focus on with LinkedIn:

  • Your Profile:

Fill out each section to include all levels of education, all accreditations and current and past positions.  Include a high quality professional photo of yourself.  Be sure to include a LinkedIn Banner image that includes a call-to-action (your phone number, your email, etc).  Your headline should be catchy and stand out.  Be sure to fill in your summary section to include real estate listings and other statistics that will jump out to potential clients.  Be sure to use keywords or phrases (real estate, real estate agent) throughout your headline and your summary to increase search engine optimization.  Also encourage previous clients to give you a recommendation so your LinkedIn profile is a non-stop shop for anyone who comes across it.  Upload videos and links to enhance your profile.  Customize your URL and use it everywhere (advertising, business cards, posts, etc).

  • Connections:

61% of real estate agents on social media view it as a way to connect to the community.  LinkedIn revolves around businesses, employees and their connections, so it’s the perfect network for real estate agents who work in an industry predicated on connections, referrals and being involved in the community.  Reach out to everyone in your sphere, alums, etc.  Remember LinkedIn is the best social media platform for professional networking, which means connect with everyone.  Take advantage of the biggest networking platform ever!

  • Content:

This is where many real estate professionals go wrong.  What doesn’t work is just content about listings (remember the 80/20 rule) in hopes of generating sales leads.  What does work is highlighting your professional experience, education and network strength.

Try these 6 content ideas to maximize your effectiveness on LinkedIn:
    1. Share real estate news, industry updates or trends.  Don’t forget to include a caption with your thoughts and opinions as well as a call to action soliciting others opinions and thoughts.  Remember, it’s about engagement so ask questions.
    2. Share information or updates about your local city.  Remember people are very patriotic when it comes to the city they live in, so find local information to share.  Also, now that LinkedIn allows the use of hashtags, include local hashtags in all your posts so anyone searching for that hashtag might come across you, and in turn check out your profile.
    3. Thoughtful and conversational posts.  Try something that will resonate with others such as your struggles, wins, inspiration, or something you overcame.  These are going to be the best conversation starters you can share on LinkedIn.  As real estate agents, you go through a lot, so sharing that will resonate with your audience.
    4. Networking events you’ve attended.  Include connections you made and give them an @mention, photos, food, the service, highlight the event, the vibe and your takeaways.  It shows your connecting with people in your local city.  Often times you’ll hear people say, it’s not what you know, it’s who you know.  That’s why this works.
    5. Native video uploads.  Every platform, whether it’s Facebook or Instagram, wants you to use the video feature that is native inside the program.  This doesn’t mean go to YouTube and share it to LinkedIn.  It means, open up a post on LinkedIn and use their Video icon and shoot native video within LinkedIn.  This will keep connections engaged longer in the LinkedIn program and hopefully on your profile.  Our best recommendation for video ideas would be “value added” for the consumer (i.e., Buyer/Seller Tips, Market Updates, community highlights, business you’ve interviewed, etc.).
    6. Write LinkedIn Articles.  When you write an article on LinkedIn, everyone in your connection list receives a notification.  You couldn’t ask for better advertising than that.  If you are a blogger, this is a perfect place to use the content you’ve already created and post it within LinkedIn as an article.

So, take the time, get your profile set up for success, start connecting with former and current clients, friends, colleagues, etc. and work on creating great content.

Helpful Terms for Buying/Selling Your Home

Buying or selling a home is one of the most important undertakings of a lifetime. When buying or selling a home, there are many real estate terms that may be unfamiliar to you. Check out this list of commonly used terms that you may find helpful during the process.

AIR:  Adjustable Interest Rate

AMORTIZATION SCHEDULE: A schedule showing the principal and interest payments throughout the life of the loan.

APPRAISED VALUE: An opinion of the value of a property at a given time, based on facts regarding the location, improvements, etc. of the property and surroundings.

CD/CLOSING DISCLOSURE: This form is a statement of final loan terms and closing costs. Sometimes referred to as ICD or Integrated Closing Disclosure.

COMMITMENT:  The document by which a title insurer discloses to all parties connected with  a particular real estate transaction all the liens, defects, and burdens and obligations that affect the subject property.

CREDIT REPORT: A report on the past ability of a loan applicant to pay installment payments.

DOCUMENT PREPARATION FEE: A charge by an attorney for preparing legal documents for transaction.

ESCROW FEE: A fee charged by the title company to service the transaction, to escrow monies, and cover documents. Usually split between buyer and seller.

ESCROW ACCOUNT: Funds held by the lender for payment of taxes and insurance when due. Usually does not include maintenance fees.

HOA ASSESSMENT FEES: Charged by the homeowner’s association as set out in subdivision restrictions.

HOMEOWNER’S INSURANCE:  Protects the property and contents in case of loss; must be for at least the loan amount or for 80% of the value of the improvements, whichever is greater.

INSPECTIONS: An examination of property for various reasons such as termite inspections; to see if required repairs need to be made before funds are received, etc.

INTEREST: Money paid regularly at a particular rate for the use of money lent.

LOAN TITLE POLICY: Required by the lender to insure that the lender has a valid lien; does not protect the buyer.

ORIGINATION FEE:  A fee the buyer pays the lender to originate a new loan.

OWNER’S TITLE POLICY: Insures that the buyer has title to the property, that there are no other claims as to ownership. Among other matters, it also insures access to the property, the right to occupy the property, good and indefeasible title, and that there are not other types of specific liens against the property. 

POINT:  1% of the loan amount.

PREPAIDS: Items to be paid by the buyer in advance of the first scheduled payment of the loan (Homeowner’s Insurance Premium, Mortgage Insurance Premium, Prepaid Interest, Property Taxes and a maximum of three additional items).

PREPAYMENT PENALTY:  Charged by the lender for premature payment of a loan balance.

PRIVATE MORTGAGE INSURANCE: Insurance against a loss by a lender (mortgagee) in the event of default by a borrower (mortgagor).

REALTOR FEES:  An amount paid to the REALTOR® as compensation for their services. RECORDING FEES: Charged by the County Clerk to record documents in the public records. RESPA:  Real Estate Settlement Procedures Act.

RESTRICTIONS: Certain limitations or conditions related to the future use of the property put on the property by a prior owner. These restrictions stay with the property until they expire or are amended as per certain procedures set forth in the restrictions.

SURVEY:  Confirms lot size and any encroachments or restriction violations.

TAX CERTIFICATES: Certificates issued by taxing authorities showing the current year’s taxes, the last year the taxes were paid, and any delinquencies to be collected at closing.

TAX PRORATION: Means that the payment of the taxes for the year of sale are divided between the Buyer and Seller, usually based on the amount of time the Seller owned the property during that year. Prorations, and how they are calculated, are typically addressed in the Contract of Sale.

TIL:  Truth in Lending.

TIP: Total Interest Percentage; the total amount of interest the borrower will pay over the loan term as a percentage of the loan amount.

TOTAL OF PAYMENTS: Total amount paid after all payments of principal, interest, mortgage insurance and loan costs are scheduled. 

To download our Helpful Terms for Buying/Selling Your Home flyer,  visit Helpful Terms for Buying and Selling Your Home.

June 2020 DFW Area Real Estate Stats

The June 2020 DFW area real estate statistics are in and we’ve got the numbers! Take a look at our stats infographics, separated by county, with MLS area stats on each county report as well! These infographics and video are perfect for social sharing so feel free to post them!

To see past month’s reports, please visit our resources section here.

For the full report from the Texas A&M Real Estate Research Center, click here. For NTREIS County reports click here.

Texas Housing Insight – May 2020

Here is the May 2020 Summary from Texas A&M Real Estate Center.


Total Texas housing sales continued to fall in May, but the decline slowed to a 2.1 percent monthly decrease. Nonetheless, the inventory of homes for sale fell to a record low of 3.2 months, possibly due to owners pulling their homes off the market or failing to list them in the first place during the COVID-19 pandemic. Increased caution during the buying process resulted in softer demand, pushing the average days on market up to 61 days. The Repeat Sales Home Price Index, however, suggested stable price gains.

The coronavirus outbreak is the greatest threat to the Texas housing market since the 1986-90 recession via disruptions to buyer and seller confidence, the negative income shock, and wariness of visiting or showing homes for sale. Mortgage applications for home purchases and the Real Estate Center’s single-family housing sales projection, however, implied that home sales were beginning to recover before the second wave of new coronavirus cases.

Supply*

The Texas Residential Construction Cycle (Coincident) Index, which measures current construction levels, inched up in May as the industry began rehiring some of the jobs shed during the economic shutdown. The Residential Construction Leading Index, however, continued to trend downward as falling housing starts offset increased permitting activity and decreased real interest rates, suggesting sluggish activity in the near future. The metropolitan leading indexes also extended downward trajectories.

Private bank loan data revealed construction activity accelerated 3.4 percent quarter over quarter (QOQ) during the first three months of 2020. After a sluggish second half of 2019, single-family investment increased 2.9 percent QOQ. Meanwhile, multifamily loan values rose for the fifth straight quarter, jumping 3.8 percent QOQ to a record-breaking $8.9 billion. Second-quarter financing, however, may stall as lending standards tightened at the onset of the pandemic.

As the statewide stay-at-home mandate expired and economic uncertainty temporarily calmed, single-family construction permits recovered 12.6 percent in May. Although levels remained nearly a fifth below that of peak issuance during February, Texas remained the national leader, contributing 17 percent of the national total. Houston topped the list with 3,035 nonseasonally adjusted permits, followed by Dallas-Fort Worth (DFW) with 2,799. Rockwall County accounted for much of the Dallas metropolitan division’s 14.1 percent improvement, the greatest increase in the Texas Urban Triangle, after adjusting for seasonality. San Antonio registered an upturn in activity, posting 787 nonseasonally adjusted permits. Issuance remained sluggish in Austin, however, with only 1,412 permits. In Texas’ multifamily sector, permits fell 18 percent, but the trend maintained a strong upward trajectory.

Total Texas housing starts fell 30.1 percent to a six-year low with particular weakness in the multifamily sector. Single-family private construction values increased 5.8 percent after adjusting for inflation with Houston posting the largest improvement, rising 20.2 percent, followed by San Antonio with a 10.0 percent climb. Values jumped 3.9 percent in Austin but extended a two-month fall in DFW, declining 3.7 percent.

Despite decreased sales, Texas’ months of inventory (MOI) fell to a historic 3.2 months as the state’s supply of active listings plummeted to its lowest level in three-and-a-half years. A total MOI around six months is considered a balanced housing market. Inventory for homes priced less than $300,000 slid to an all-time low of 2.4 months as the price range registered increased sales. On the other hand, the supply of active luxury home (homes priced more than $500,000) listings expanded for the first time this year while closed listings fell, pushing the MOI up to 7.6 months. This disparity exemplifies the shortage of affordable housing during a time when the rocky economic atmosphere may make lower-priced homes look more financially feasible to the potential homebuyer.

Inventory in the major metros decreased across the board in every price cohort except for homes priced more than $500,000. The supply of active listings fell the most in Central Texas, which, combined with falling sales, resulted in more substantial changes. Austin’s MOI slid to 1.9 months after two straight monthly increases, while the San Antonio metric recorded a historic low of just three months. In Dallas and Fort Worth, inventory inched down to 2.6 and 2.4 months, respectively. The Houston MOI was the only one above the statewide average at 3.4 months.

Demand

Public health precautions and social distancing measures during the previous couple of months continued to weigh on total housing sales, which decreased 2.1 percent in May. Sales for homes priced less than $300,000 increased marginally but remain one-fifth below peak levels this year. Still, Texas registered a smaller decline than the U.S. as a whole, as nationwide sales sank 6.6 percent.

North Texas sales fell 4.7 and 1.9 percent in Dallas and Fort Worth, respectively. Sales declined 7.7 percent in Austin and 3.0 percent in San Antonio. Houston was the exception with sales rising 1.9 percent. YTD levels are still behind last year’s pace during the first five months, much less record-breaking activity during February.

Reduced showing and visiting of homes during March and April translated to slightly softer housing demand, pushing Texas’ average days on market (DOM) up to 61 days and ending a year-long downward trend. The Houston and San Antonio DOMs hovered just above the statewide average, ticking up to 62 and 63 days, respectively. In Austin, the average home sold after 55 days, six days slower than the previous month. The metric in North Texas increased by five days to 57 and 50 days in Dallas and Fort Worth, respectively. Demand for existing homes softened more than for new homes in every location except Fort Worth, possibly reflecting more willingness to visit and purchase new construction.

The ongoing spread of the coronavirus kept interest rates at historically low levels, but an upturn in oil prices slowed the downward slide. The ten-year U.S. Treasury bond yield flattened at 0.7 percent, but the Federal Home Loan Mortgage Corporation’s 30-year fixed-rate dropped to its lowest reading on record at 3.2 percent. Mortgage applications for home purchases rose by a third in May after three straight decreases yet remained 4.5 percent below year-end levels. Refinance activity stumbled on the month, although applications were up 60.8 percent YTD.

Prices

The Texas median home price contracted 2.3 percent in May, falling to a near-annual low of $240,500. In year-over-year (YOY) terms, the median sale price appreciated just 1.6 percent, the smallest annual change since 2012. A shift in sales composition may explain the monthly decline, but the distribution was similar relative to the same period last year. Another explanation for the subdued price appreciation is that the state’s sale-to-list price ratio fell for the second consecutive month, with the recent decrease the steepest in nine years. The shift in leverage toward buyers coincided with softer demand.

At the metropolitan level, median home prices declined on a monthly basis in all but Austin, where the metric flattened to $317,700 following a 4.6 percent decrease the prior month. Annual growth was sluggish except in San Antonio, where the median price rose 3.5 percent YOY to $235,400, but the increase remained below the long-term average pace. The metric in both Fort Worth and Houston was $240,800, while Dallas’ median price fell to $287,300.

The Texas Repeat Sales Home Price Index, a better measure of changes in single-family home values, provides insight into how Texas home prices evolve. Although the index did decelerate on a monthly and annual basis, a YOY increase of 3.4 percent suggests the pandemic’s effect on home values has been minimal. Houston’s and San Antonio’s indexes grew less than the statewide measure, rising 2.5 and 3.1 percent YOY, respectively. Austin’s metric jumped 4.9 percent but recorded its slowest rate in seven months. Only in North Texas did the index accelerate, climbing 2.9 percent in Dallas and 4.0 percent in Fort Worth.

Single-Family Forecast

The Real Estate Center projected single-family housing sales using monthly pending listings from the preceding period (Table 1). Only one month in advance was projected due to the uncertainty surrounding the COVID-19 pandemic and the availability of reliable and timely data. Sales are expected to increase in June for the first time since February, when activity peaked. Texas’ single-family sales are estimated to rebound 33.7 percent, with Austin leading the major metros, climbing 39.1 percent. Dallas and Houston single-family sales are expected to jump 36 and 35 percent, respectively, while San Antonio’s sales increase 30 percent. Nevertheless, the data indicate a full recovery will not be reached in June. Even then, a third-quarter comeback may be threatened if the second wave of COVID-19 cases triggers another economic shutdown.


All measurements are calculated using seasonally adjusted data, and percentage changes are calculated month over month, unless stated otherwise.

Source – James P. Gaines, Luis B. Torres, Wesley Miller, Paige Silva, and Griffin Carter (July 14, 2020)

https://www.recenter.tamu.edu/articles/technical-report/Texas-Housing-Insight