Spotlight on Prosper
Click here for a printable version of the Prosper Fast Facts and view all DFW Area Fast Facts here. Whether you’re a lifelong resident or new to the area, there’s always something new to discover about your neighborhood. With that in mind, we created a Fast Facts sheet for cities and neighborhoods all over the […]
Spotlight on Preston Hollow
Click here for a printable version of the Preston Hollow Fast Facts and view all DFW Area Fast Facts here. Whether you’re a lifelong resident or new to the area, there’s always something new to discover about your neighborhood. With that in mind, we created a Fast Facts sheet for cities and neighborhoods all over […]
How to Protest Your Property Taxes (and Win)

The property tax protest deadlines are fast-approaching, so if you find yourself in need of help or don’t know where to start in protesting, look no further! Last week Republic Title sponsored a webinar with Candysdirt.com and PropertyTax.io on How to Protest Your Property Taxes (and Win) to help provide valuable information on protesting property […]
Spotlight on Parker
Click here for a printable version of the Parker Fast Facts and view all DFW Area Fast Facts here. Whether you’re a lifelong resident or new to the area, there’s always something new to discover about your neighborhood. With that in mind, we created a Fast Facts sheet for cities and neighborhoods all over the […]
March 2024 DFW Real Estate Stats
https://youtu.be/n0ygLPyn63c In March, there’s significant news across all reported counties: new and active listings have surged, particularly notable spikes seen in Collin and Denton counties. Despite this uptick in listing activity, inventory remains tight, with less than three months’ worth available. Closed sales in Collin, Dallas, Denton, Rockwall, and Tarrant counties have seen an almost […]
History of Earth Day
Earth Day was founded in 1970 as a day of education about environmental issues, and Earth Day 2024 occurs on Monday, April 22. The holiday is now a global celebration that’s sometimes extended into Earth Week, a full seven days of events focused on green living. The brainchild of Senator Gaylord Nelson and inspired by […]
Where To See Wildflowers in DFW
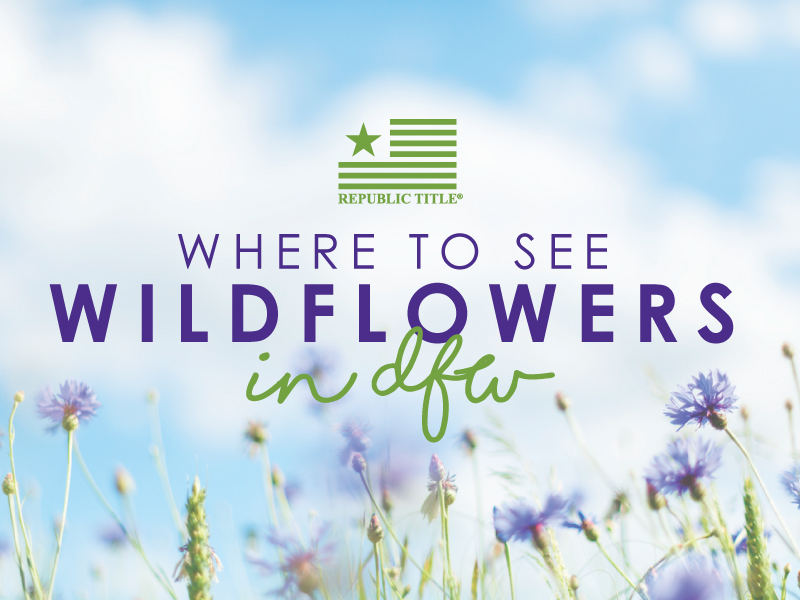
Spring is in bloom, and along with warmer temperatures and more daylight, fields of flowers—including tulips or the state’s pride, bluebonnets—are one of the season’s gifts. Whether you’re looking for a family photo op or want to teach your kids about how flowers grow, you don’t have to go far to find spectacular displays. Here […]
Texas Housing Insight January 2024 Summary
Housing sales rebounded from last month’s drop despite mortgage rates remaining at elevated levels. The average home price grew alongside sales, with the cost rising over $9,000 since December 2023. Single-family starts decreased while permits increased. Home Sales Skyrocket According to the latest data, Texas had a 14.6 percent increase in total home sales month […]
Spotlight on North Richland Hills
Whether you’re a lifelong resident or new to the area, there’s always something new to discover about your neighborhood. With that in mind, we created a Fast Facts sheet for cities and neighborhoods all over the DFW area. Our DFW Area fast facts have detailed real estate insights, things to do, places to shop and […]
Best Patios for Al Fresco Dining in DFW

Spring is in the air, and it’s time to start planning for some al fresco dining in the beautiful outdoor spaces that Dallas-Fort Worth has to offer. Whether you’re looking for a romantic spot for a date night or a place to catch up with friends over brunch, there are plenty of patios to choose […]