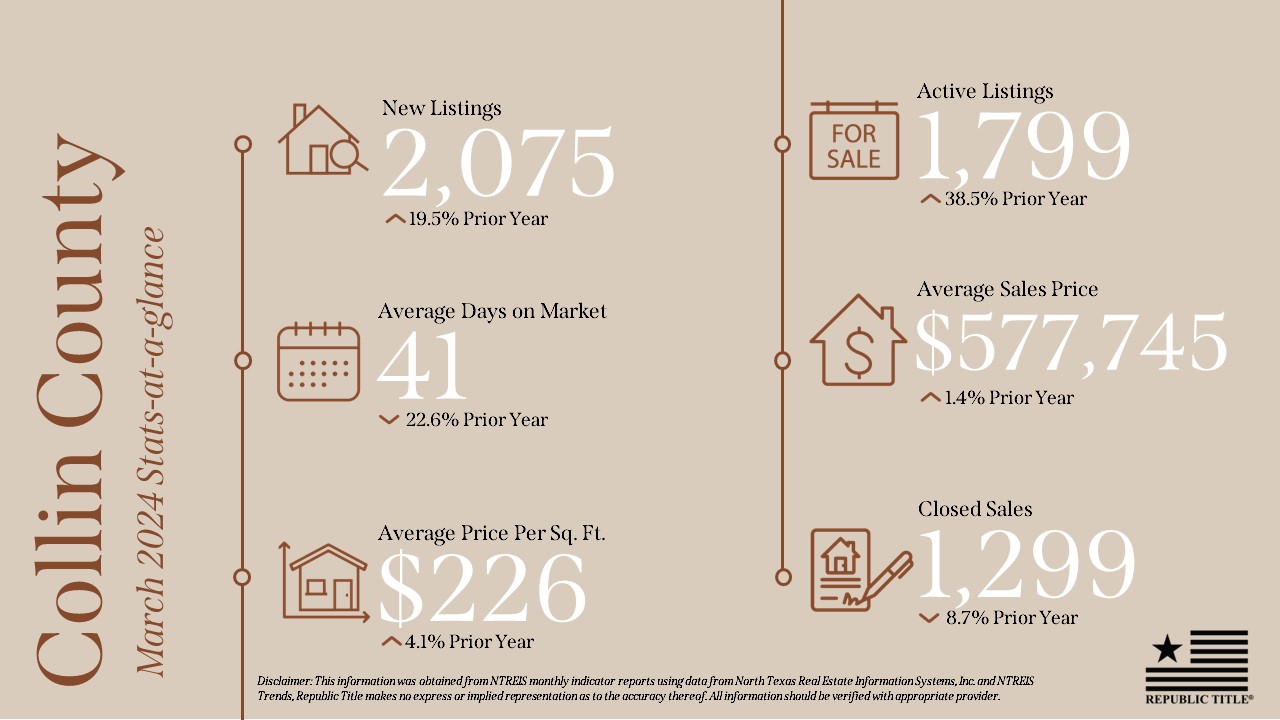
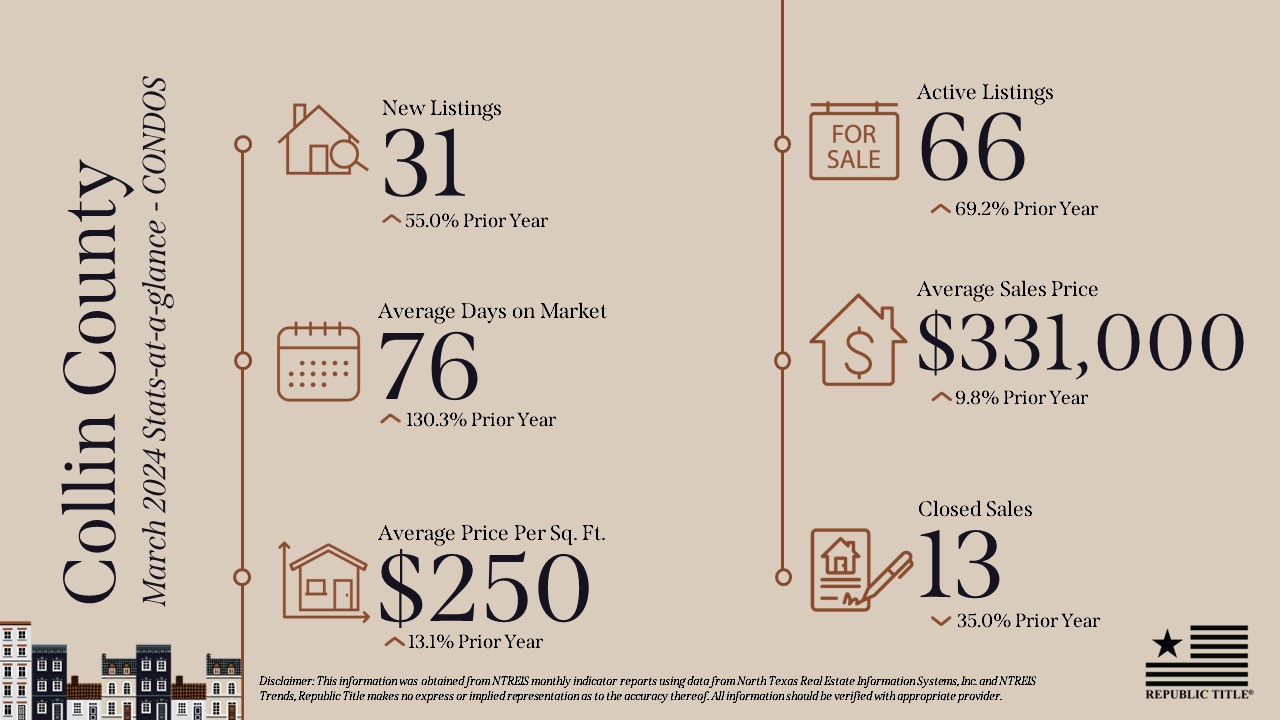
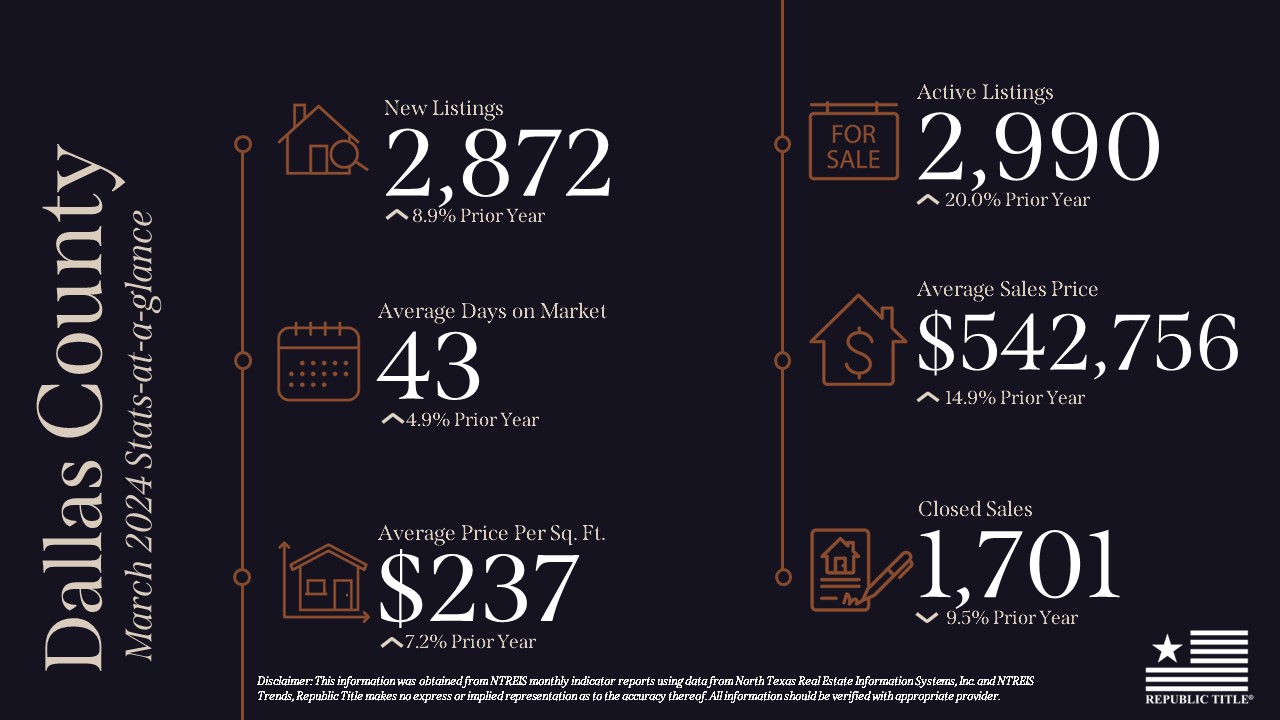
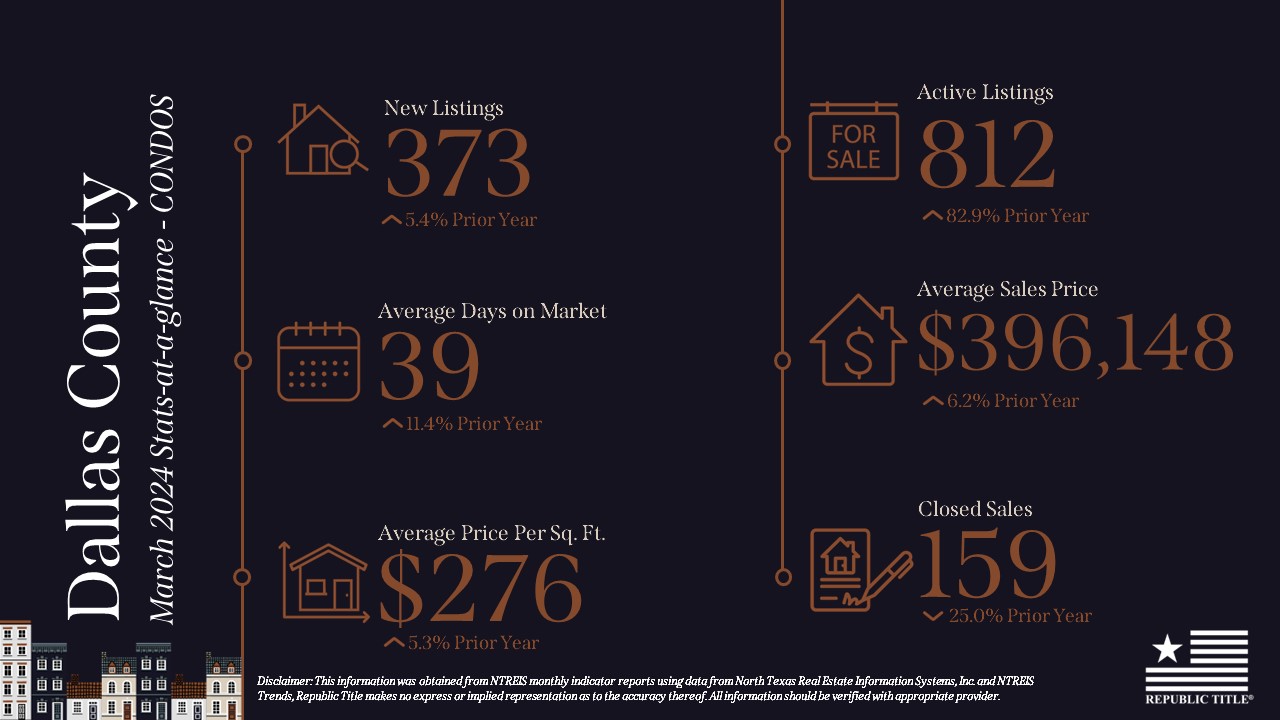
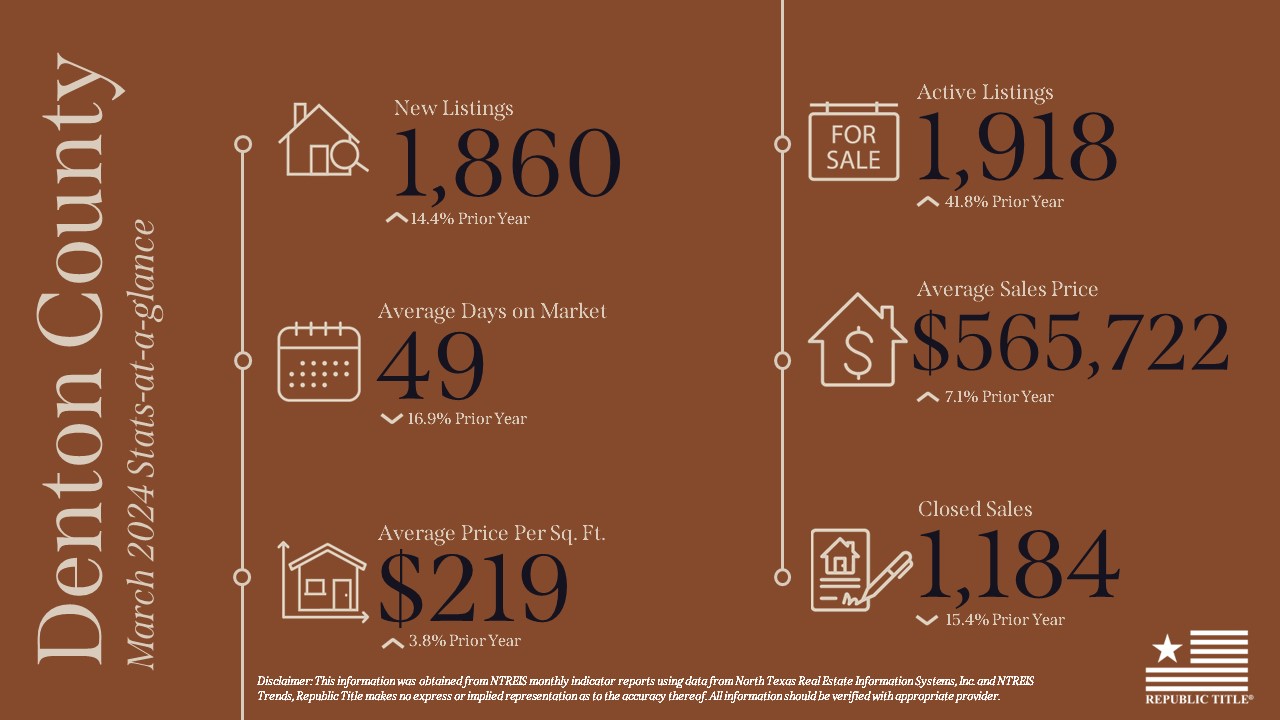
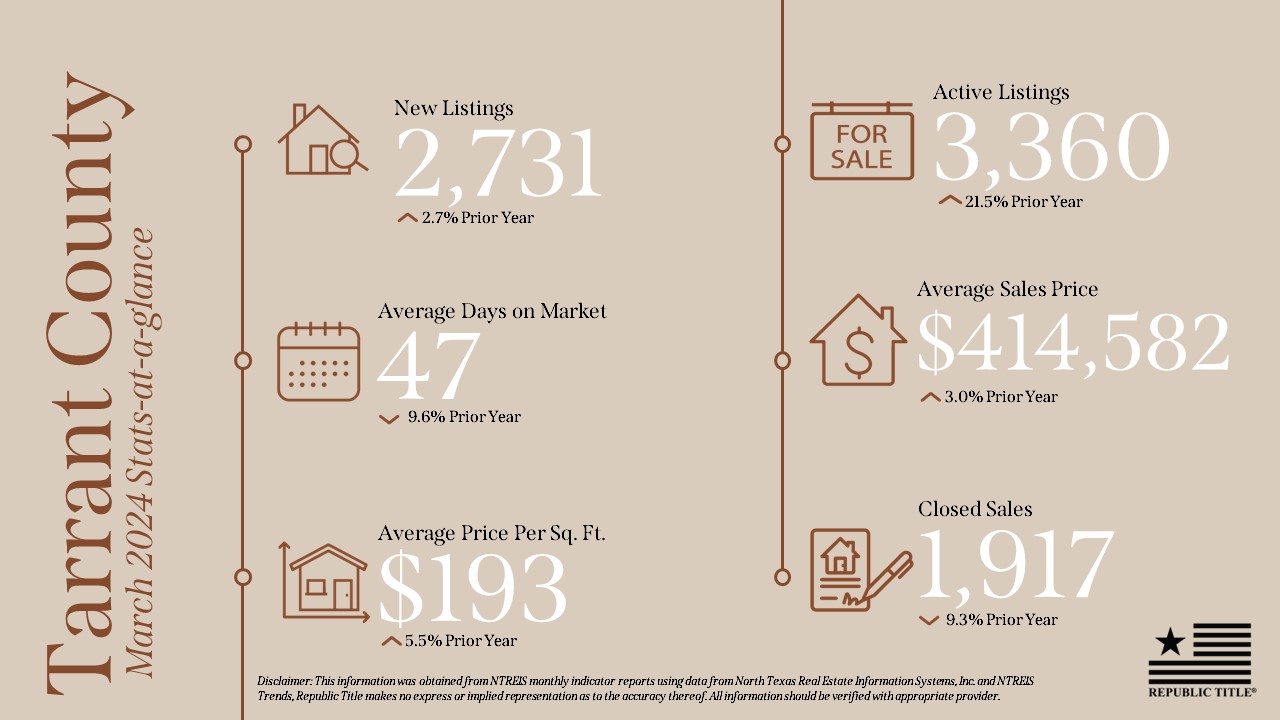
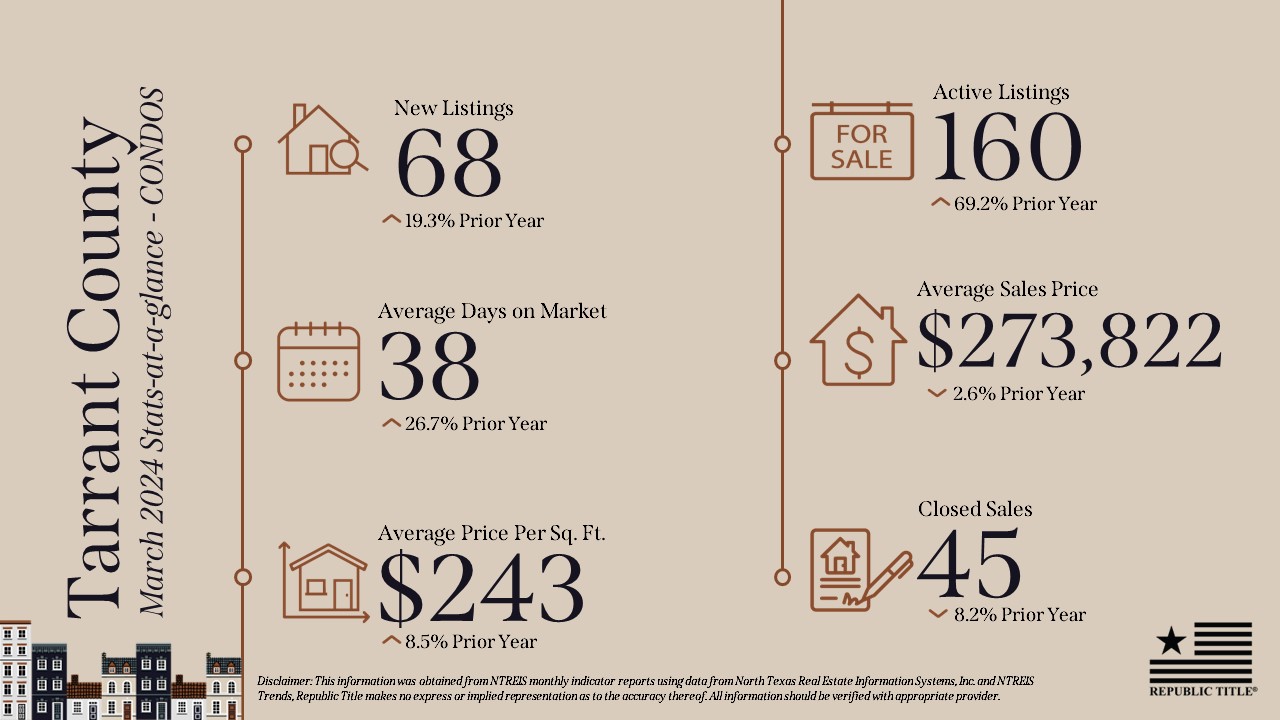
In March, there’s significant news across all reported counties: new and active listings have surged, particularly notable spikes seen in Collin and Denton counties. Despite this uptick in listing activity, inventory remains tight, with less than three months’ worth available.
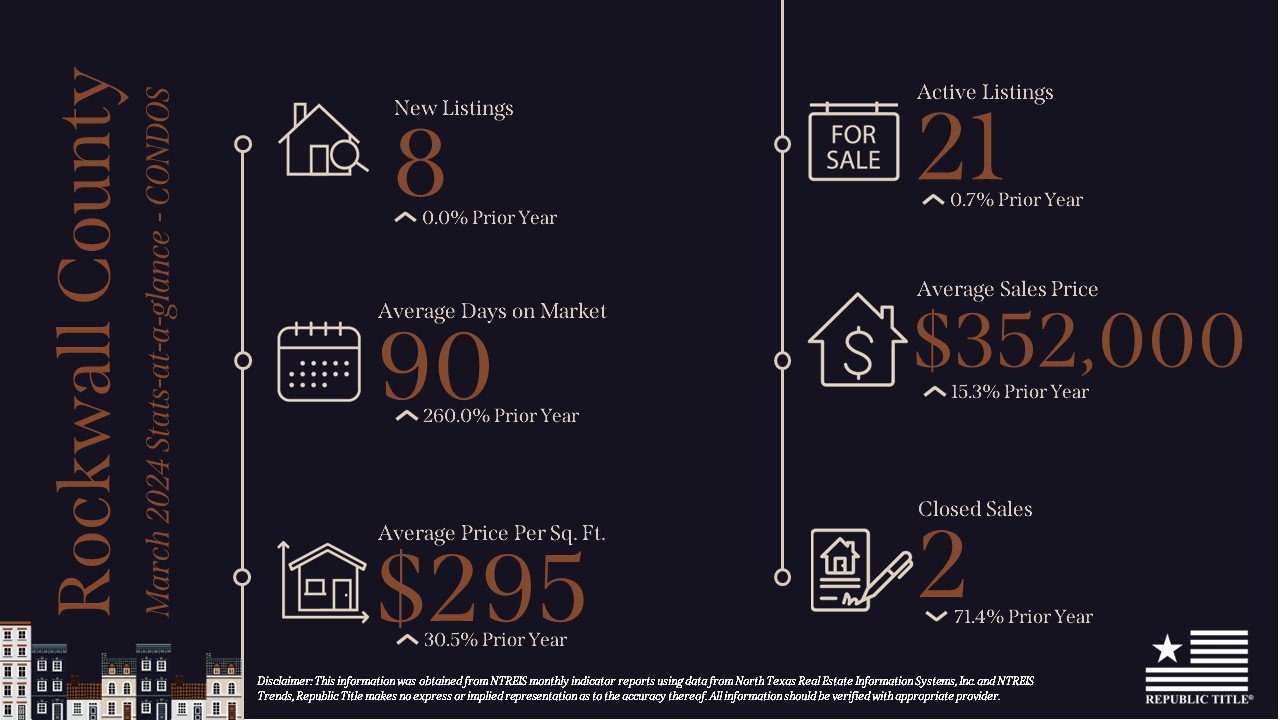
Closed sales in Collin, Dallas, Denton, Rockwall, and Tarrant counties have seen an almost 10% increase each, except for Rockwall County, where there’s a notable decline of nearly 40% compared to the previous year. Additionally, noteworthy is the decrease in days on market across all counties except Dallas, where it has risen by almost 5% compared to last year.
Given the inventory challenges, it’s unsurprising that average sales prices have edged up slightly from the previous year, with increases of less than 5% across most counties. However, Dallas County stands out with a significant 14.9% jump in average sales price compared to 2023.
Even still, the spring and summer market is upon us and given that the DFW Metroplex is in the top 10 of people moving here, so it promises to be a busy selling season!
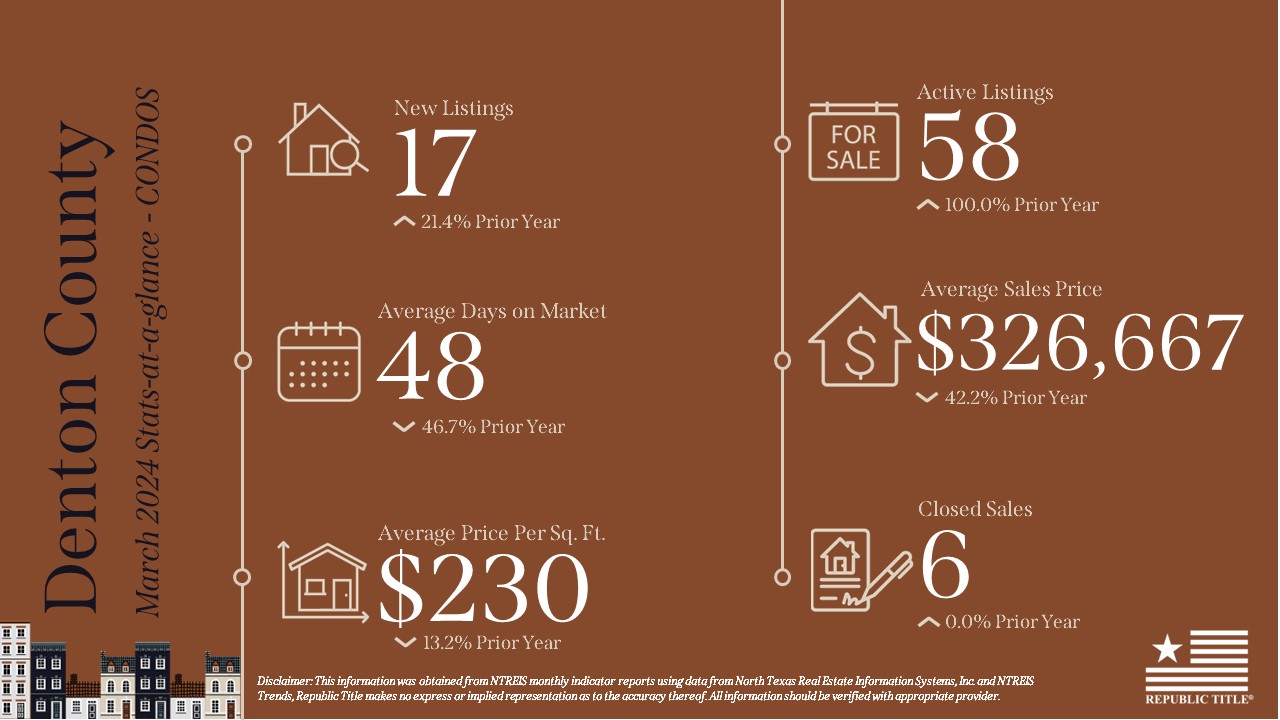
Our stats infographics include a year over year comparison and area highlights for single family homes broken down by county. We encourage you to share these infographics and video with your sphere.
For more stats information, pdfs and graphics of our stats including detailed information by county, visit the Resources section on our website at DFW Area Real Estate Statistics | Republic Title of Texas.
For the full report from the Texas A&M Real Estate Research Center, click here. For NTREIS County reports click here.