Class-Calendar-Blog-Header

June Class Calendar

Republic Title is pleased to offer a variety of continuing education classes for our customers. Join us in June for classes including:

Create Gorgeous Visual Content Using FREE Tools!
Join Annette Carvalho-Jordan, VP/Real Estate Technology Trainer as she gets you started creating beautiful designs for your real estate business and your social media profiles using Canva.com and more!
June 3rd
10:00 am – 11:00 am
Zoom

Documents & What They Do
Licensees must be familiar with a multitude of documents in the practice of real estate. Join us for this class which focuses on various real estate documents including Deeds, Deeds of Trust, Assignments and more describing the purpose and applicability of each.
June 8th
10:00 am – 11:00 am
Zoom

Death, Divorce & Real Estate
Join us to learn important laws surrounding death and divorce such as separation, homestead issues, community property and probate.
June 14th
10:00 am – 11:00 am
Republic Title Prosper

Social Media Content Planning 101
All good social media begins with a plan. Join us to learn how effective content planning and execution will keep you top of mind with your sphere and help you win more business. In this class, you will learn tips for social media content planning, where to find great content resources, and planning tools to help you organize your social media content calendar.
June 15th
10:00 am – 11:00 am
Zoom

Boost Your Business With Remine
Join us for an overview of Remine; a powerful map-based search tool accessible through the NTREIS portal. This class will demonstrate Remine’s intuitive platform that reimagines the MLS and helps to solve and analyze some of the biggest challenges real estate agents face today.
June 16th
10:00 am – 11:00 am
Caddo Office Reimagined

Death, Divorce & Real Estate
Join us to learn important laws surrounding death and divorce such as separation, homestead issues, community property and probate.
June 16th
2:00 pm – 3:00 pm
Zoom

Backup, Contingent & Multiple Offers
This class will prepare licensees to handle the unique aspects of backup, contingent and multiple offer transactions by reviewing pertinent TREC addenda along with critical dates and deadlines.
**APPROVED TREC CONTRACT COURSE**
June 21st
10:00 am – 11:00 am
Zoom

To see a current list of available classes and to register, please visit www.republictitle.com/residential-education.

April-2022-b

April 2022 DFW Area Real Estate Stats

April stats are here and we have the numbers! 

The housing market in North Texas continues to be hot! New listings are up consistently in all five counties over March 2022 as the Spring market continues to heat up. Despite higher mortgage rates, demand remains strong in North Texas. Average sales prices are up ranging from 16% in Dallas County to 35% in Rockwall County compared to April 2021.

Our stats infographics include a year over year comparison and area highlights for single family homes broken down by county. We encourage you to share these infographics and video with your sphere.

For more stats information, pdfs and graphics of our stats including detailed information by county, visit the Resources section on our website at DFW Area Real Estate Statistics | Republic Title of Texas.

For the full report from the Texas A&M Real Estate Research Center, click here. For NTREIS County reports click here.

Lingo You Should Know

Lingo You Should Know

When you are preparing to buy a home, there are many words that may be unfamiliar to you. This list of
commonly used real estate terms is intended to help you in the home buying or selling process.

Appraisal
The estimated value of a property based on a qualified appraiser’s written analysis. Banks typically require appraisals before issuing loans to ensure the estimated value of the property adequately supports the sales price and the loan being taken out by the Buyer.

Appreciation
The increased value of your home from when you purchased it is considered its appreciation in value.

Assessed Value
This is the dollar value that the county appraisal district assigns to your home for the purpose of property taxes. This value may differ from a home appraisal value or market value.

Buyer’s Agent
A real estate agent who represents the interests of homebuyers.

Closing Costs
These refer to miscellaneous expenses to close the deal. Expenses can include recording fees, title insurance, commissions, surveys, and more.

Closing Disclosure
Final account of your loan’s interest rate and fees, mortgage closing costs, your monthly mortgage payment, and the total of all payments and finance charges. This document also notes the amount the Buyer has to bring to closing.

CMA
CMA stands for Comparative Market Analysis. This report looks at similar homes in your area that were sold or are currently on the market and can help determine an accurate value for your home.

Comparables
Also known as “Comps.”, which are used as a comparison in determining the current value of a property that is being appraised.

Contingencies
Particular conditions that must be met prior to closing a real estate transaction such as a home inspection (to ensure the home has no serious defects), a financing contingency (which releases a Buyer from the sales contract if their loan falls through), or a contingency that a Buyer must first sell their current home.

Deed
The recorded legal document transferring ownership or title to a property.

Deed of Trust
A recorded lien on the property which secures the Promissory Note and gives the lender the ability to foreclose if there is a default.

Earnest Money
Money that the Buyer deposits with the title company or directly with the Seller as a good faith gesture that they are serious about buying a home.

Effective Date
The date the Buyer and Seller have agreed to all terms and actually executed the contract.

Escrow
A legal arrangement in which a third party temporarily holds large sums of money or assets until a particular condition has been met (e.g., the fulfillment of a purchase agreement).

Executed
When a legal document has had its contents agreed upon by the Buyer and Seller and is signed by all parties to the document it is Executed.

HOA Resale Certificate
A document issued by a Property Owners Association or Condo Association (if applicable) that outlines the fees associated with the transfer of the property that are to be collected from the Buyer and Seller at closing.

Home Inspection
A thorough professional examination that evaluates the structural and mechanical condition of a property (plumbing, foundation, roof, electrical, HVAC systems, etc.) to identify problems with the house before purchasing. A pest inspection is also common as well as a pool inspection when applicable.

Home Warranty
Limited Warranty Coverage on some of the items in your home that can lead to costly repairs when in need of work, such as, HVAC systems, appliances, and even pest control. Every policy is different, it is important to understand what is covered and what is not. The Seller can provide a dollar amount towards a Home Warranty if it is selected and agreed upon within the contract.

Mortgage Lender
The lender providing funds for a mortgage. Lenders also manage the credit and financial information review, the property and the loan application process through closing.

Multiple Listing Service (MLS)
The MLS is a local organization that collects, catalogs, and distributes home listings for sale and lease as well as data on past sales. REALTORS® get access to the MLS by being a paid member of the organization. Some of the information in the MLS is distributed to popular listing websites.

Offer
A formal request to buy a home. This is most often presented to a Seller in the form of the contract and addenda required to purchase/sell a property that outlines all the terms and conditions of the offer.

Principal
The remaining unpaid balance on your mortgage. At closing, accrued and unpaid interest on the principal will also be due and payable.

Real Estate Agent
A professional with a real estate license who has passed a test as required by the state who may represent a Buyer or Seller in a real estate transaction.

REALTORS®
This is a real estate agent who is also a member of the National Association of REALTORS®, meaning they uphold certain standards and codes of ethics.

Real Estate Broker
A real estate agent that has additional education, has passed the state Broker’s exam, and meets minimum transaction requirements.

Real Property
Land and anything permanently affixed thereto — including buildings, fences, trees, and minerals.

Sales Contract
The finalized and executed contract and applicable addenda.

Seller’s Agent
The real estate agent who represents the Seller of a piece of property. Their job is to act in the best interests of the Seller, marketing their home to potential Buyers, and negotiating on the Seller’s behalf.

Survey
A drawing of your property prepared by a Registered Professional Land Surveyor that locates the boundary lines, any improvements, easements, building lines, encroachments of any structures or improvements over the property lines, easements, or building lines on the property.

Survey Deletion Coverage
The Owner’s Title Policy contains a standard exception to: “Any discrepancies, conflicts, or shortage in area or boundary lines, or any encroachments or protrusions, or any overlapping of improvements.” When the Buyer purchases Survey Coverage, and the survey has been approved by the title company this standard exception is amended to remove everything except the words “shortages in area” and exceptions are added to exclude any matters currently shown on the survey from coverage in the Policy.

Title
Document that refers to your right of ownership and thus your ability to sell.

Title Insurance
Insurance purchased to protect against any unknown liens or debts that may be placed against the property as well as any claims by anyone else that they own or have any rights to your property that are not known or disclosed at closing.

Click here for print version.

What-To-Do-With-Smart-Home-Devices

What To Do With Smart Home Devices

In today’s high tech world, many homes are equipped with the latest smart home technology and security devices. As a real estate agent, it is important to be in the know on how the TREC Contract addresses security devices in the home. Listen in as Republic Title’s Janet Allen and Scott Rooker discuss:

  • What does the TREC Contract tell us about security devices?
  • What does the seller need to do if they are leaving security systems and devices in the house that are controlled by app or phone?
  • What should I expect at closing if I am buying a home with security devices?
  • How is a buyer able to access and operate smart devices in their new home?

For more information, go to Blog for videos like this and other helpful information. Blog | REPUBLIC TITLE

Housing-Insight-January-2022-Summary

Texas Housing Insight January 2022 Summary

Texas housing sales continued to rise in January, compounding gains despite ongoing supply constraints. The months of inventory (MOI) slid to 1.4 months, putting downward pressure on the market. Single-family permits, however, increased, and housing starts continued to rise despite steep price hikes in lumber and other building inputs. Finding homes priced below $300,000 remained a great challenge to many Texans as inventory cannot keep up with booming demand. Sales have remained strong despite ongoing inventory limitations, particularly among lower priced cohorts. The state’s diverse and expanding economy, favorable business policies, and steady population growth still support a favorable outlook.

Supply1

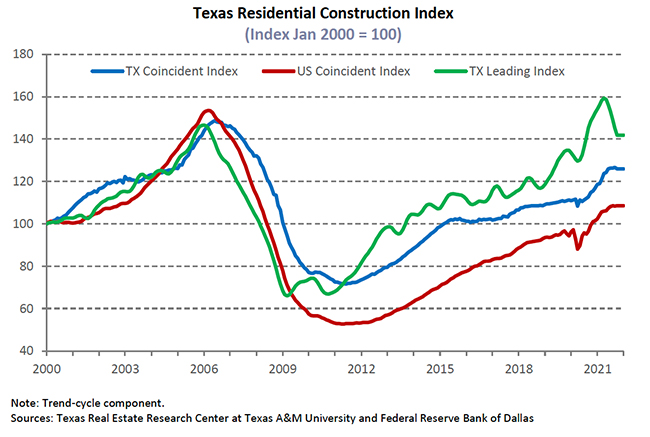
The Texas Residential Construction Cycle (Coincident) Index, which measures current construction activity, decreased nationally and in Texas due to falling employment outweighing heightened construction gains. The Texas Residential Construction Leading Index (RCLI) possibly reached a trough, signaling an increase in future activity. The downward trend was reverted by an increase in weighted building permits and residential construction value starts along with the ten-year real Treasury bill continuing to fall. The leading indexes among the major metros, however, continued to decline. Current inflationary conditions due to supply chain issues are putting downward pressure on construction activity and may impede construction activity in the coming months.

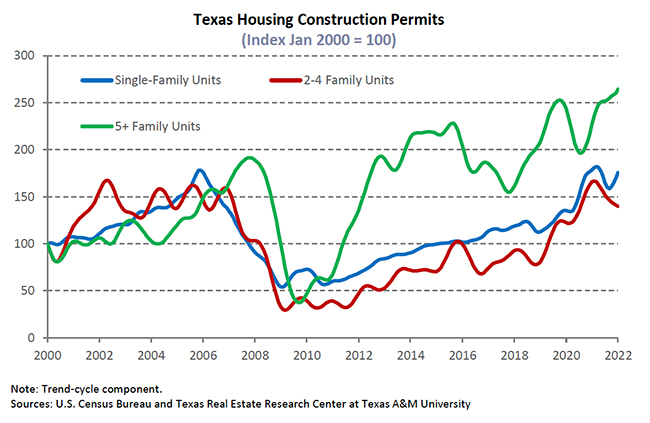
Single-family construction permits surged 7.1 percent, beating out the national increase of 6.5 percent month over month (MOM). Houston and Dallas-Fort Worth (DFW) remained on top of the national list and outnumbered Phoenix by approximately 1,000 permits. The largest rate of change of the major Texas metros came from San Antonio and DFW at 10 percent and 7.1 percent, respectively. Houston issued the highest number of permits at 4,837, marking a 2.2 percent uptick, while Austin issued 2,295 permits for a rise of 6.4 percent. Texas multifamily permits dropped 15.5 percent MOM; however, the metric was up 4.3 percent year to date (YTD).

Lumber prices soared 61.2 percent, drastically increasing the cost of home building. Despite the lumber market disruption, robust economic conditions and copious demand pushed total Texas housing starts up for the third consecutive month, increasing at 2.1 percent. Single-family private construction values also increased in real terms. Austin and Houston values ticked up 4 and 3 percent MOM, respectively, contributing to the majority of the 2 percent uptick in statewide values. Dallas and San Antonio posted negative numbers at 1 and 3 percent, respectively.

Texas’ months of inventory (MOI) fell to 1.4 months as active listings remained retracted while demand stayed high. A total MOI around six months is typically considered a balanced housing market. Supply remained severely limited, dropping across all price categories but most notably for homes in the lowest price range. The inventory for homes priced $200,000-$299,999 dropped to 0.94 months, and the lowest cohort (homes price less than $200,000) dropped 0.1 to 1.34 months. Total housing inventory in the major metros dropped significantly with the MOI remaining most constrained in Austin at 0.4 months. The metric in North Texas fell to 0.7 and 1.0 months in Dallas and Fort Worth, respectively. Houston’s MOI stayed steady at 1.6 months, while San Antonio declined to 1.5 months. Dwindling inventory persisted as a major headwind to the health of Texas’ housing market.

Demand

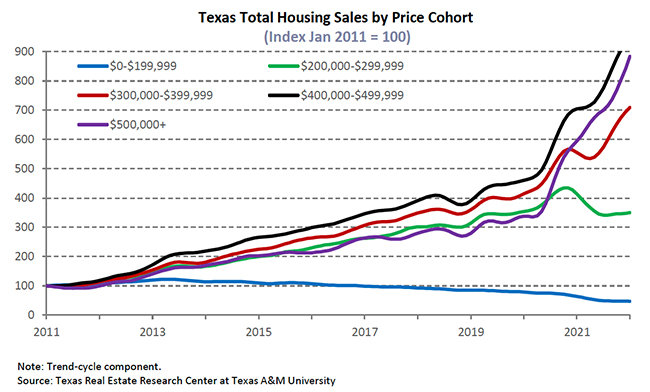
Monthly housing sales reached an all-time high for January in Texas with 38,900 closed listings in January. Total housing sales started off strong in 2022 with a 9.5 percent MOM increase, and the gains occurred across all price cohorts. The greatest increase was the $400,000-$499,999 cohort at 24 percent, while the lowest cohort rose only 4.7 percent by comparison. Houses in cohorts priced above $300,000 nearly doubled the percent gains in sales compared with those priced in the lowest two categories.

Housing sales increased across all major metros, led by Houston at 20.6 percent MOM. San Antonio followed with a hike of 8.7 percent. Meanwhile, Dallas and Austin experienced a 5.2 and 5.0 percent sales increase, respectively.

Texas’ average days on market (DOM) rose marginally to 33 days, increasing 0.5 percent MOM. The state DOM started rebounding since hitting a historical low of 29 days in August 2021, and it had continued rising for five consecutive months. Despite the marginal improvement in the buyers’ market, Austin remained the hottest housing market with an average DOM of 23 days. Dallas and Fort Worth’s DOM remained steady at an average of 26 days. DOMs for Houston and San Antonio were slightly higher than the state average, both at 34 days.

Market expectations are for the Federal Reserve to accelerate the tapering of assets purchases and to increase the Federal Funds rate in 2022 in an effort to combat rising inflation. The ten-year U.S. Treasury bond yield rose to 1.8 percent2, up 30 basis points from the previous month. The Federal Home Loan Mortgage Corporation’s 30-year fixed-rate hovered around 3.1 percent for the third consecutive month. The median mortgage rate for the typical Texas homebuyer climbed to 3.3 percent for GSE loans in December3 and rose to 3.1 percent for non-GSE loans. Refinance applications have declined on a monthly basis and were down 37.5 percent year over year (YOY). MOM purchase and refinance applications diminished 12.4 and 13.6 percent, respectively. (For more information, see Finding a Representative Interest Rate for the Typical Texas Mortgagee). 

In December, the median loan-to-value ratio (LTV) constituting the “typical” Texas conventional-loan mortgage dropped from 86.7 a year ago to 83.5. The debt-to-income ratio (DTI) declined from 35.8 to 35.3 YOY, while the median credit score increased 4.8 points to 753 over the same period. The LTV for GSE borrowers dipped slightly from 85.3 in November to 84.9; meanwhile, their DTI also dropped slightly from 36.6 to 36.3.

Prices

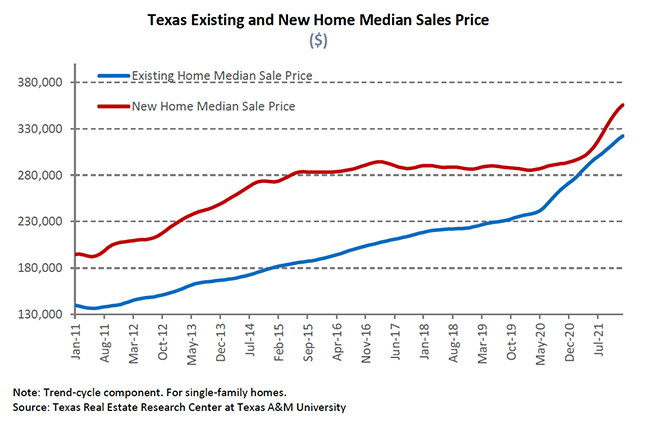
The ongoing shift in the composition of sales and price effects boosted the average and median home price. The Texas median home price rose for the 14th consecutive month, appreciating 1.9 percent on a monthly basis and 16 percent YOY to a record-breaking $376,363. The five major metros all hit historically high median prices. Austin led the pack with a median home price of $518,390 increasing 3.3 percent MOM. Dallas followed suit rising 2.7 percent to reach a median price of $408,572. The Houston metric ($325,077) and Fort Worth metric ($339,679) increased 2.5 percent and 1.8 percent, respectively, while the San Antonio metric ($308,279) gained a modest 0.7 percent.

The Texas Repeat Sales Home Price Index accounts for compositional price effects and provides a better measure of changes in single-family home values. Compared with January 2021’s 8.9 percent YOY increase, Texas’ index corroborated significant home-price appreciation, accelerating 19.6 percent YOY in 2022. The repeat sales index accelerated in all major metros for 14 consecutive months. The metric grew most rapidly in Austin with a 33.7 percent YOY increase. San Antonio posted a 19.9 percent annual hike, where Houston reported a similar climb of 16.5 percent. Prices in North Texas increased 26.2 and 23.8 percent in Dallas and Fort Worth, respectively. Increasing home prices pressured housing affordability, decreasing Texas’ affordability advantage over other states like California.

Single-Family Forecast

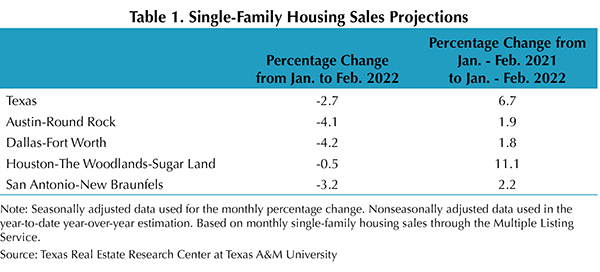
The Texas Real Estate Research Center projected single-family housing sales using monthly pending listings from the preceding period (Table 1). Texas sales reached a recent peak in December 2021, and the values have since declined. In February, Texas sales are expected to fall 2.7 percent. Likewise, the metric is estimated to dip 0.5 percent in Houston. Transactions in San Antonio are forecasted to plummet 3.2 percent. Austin and DFW are expected to see significant losses of 4.1 percent and 4.2 percent, respectively. Despite the monthly declines, sales from January to February 2022 should accelerate relative to the same period in 2021, with Houston anticipating a cumulative growth of 11.1 percent.

Household Pulse Survey

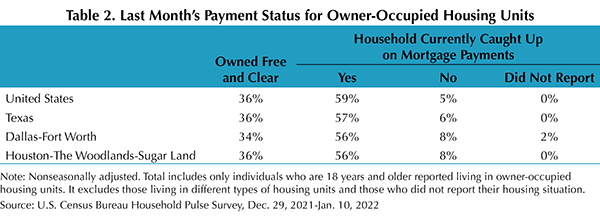
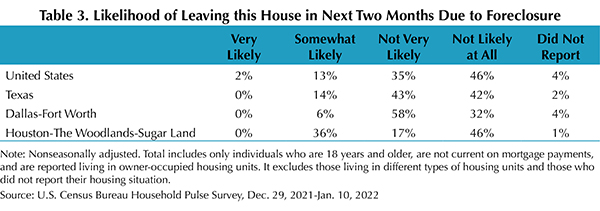
According to the U.S. Census Bureau’s Household Pulse Survey, the share of homeowners behind on mortgage payments balanced on the national level, and the share stepped up at the state level (Table 2). Meanwhile, for these mortgage owners, fewer of them needed to face the possibility of leaving due to foreclosure in Texas. The share of Texas respondents who reported themselves in the “not likely at all” group for leaving their house due to foreclosure jumped 15 percent, while the share reporting “somewhat likely” plummeted 9 percent (Table 3). In Houston, while the delinquent homeowners due to foreclosure remained high, more than half of the “not very likely” group predicted themselves as “not likely at all” to leave their house due to financial difficulties.

________________

1 All measurements are calculated using seasonally adjusted data, and percentage changes are calculated month over month, unless stated otherwise.
2 Bond and mortgage interest rates are nonseasonally adjusted. Loan-to-value ratios, debt-to-income ratios, and the credit score component are also nonseasonally adjusted.
3 The release of Texas mortgage rate data typically lags the Texas Housing Insight by one month.

Source – Joshua Roberson, Weiling Yan, and John Shaunfield (May 3, 2022)

https://www.recenter.tamu.edu/articles/technical-report/Texas-Housing-Insight

May-Landscape-Tips

May Landscape & Gardening Tips & To-Dos

Need help planting a successful garden or landscape? Here are some May planting tips from the Dallas Arboretum horticulture staff and the Dallas County Master Gardeners that can help keep your home garden looking beautiful this Summer. Heat tolerant plant care should be your focus in May.

  • Plant your heat tolerant summer annuals and tropicals, if you haven’t already. Our favorites for the heat are Lantana, Ornamental Sweet Potato Vine, Purple Fountain Grass, Ornamental Peppers, Coleus, Elephant Ears, Caladiums, Pentas, and Tropical Hibiscus.
  • Continue planting perennials, trees and shrubs. Just be sure to water them in well as the temperature rises and continue watering them regularly, making sure to saturate the root ball on trees and shrubs as much as twice per week, throughout the summer.
  • The last of the heat tolerant veggies and annual herbs can be planted until mid month, including Southern Peas, Sweet Potatoes, Basil and Oregano.
  • Fertilize your lawn and garden with a high nitrogen fertilizer, following recommended application rates.
  • Be sure to water grass regularly during the hot summer months, up to one inch depth, 2 to 3 times weekly, or what your city water restrictions will allow.
  • Mow your lawn once per week to maintain good healthy growth and reduce any unnecessary wear and tear on lawn equipment.
  • Continue pruning and reshaping any spring blooming shrubs and vines after they finish flowering.