


All measurements are calculated using seasonally adjusted data, and percentage changes are calculated month-over-month, unless stated otherwise. Data are current as of June 22, 2024.

Housing activity for both new and existing homes decreased in May. Despite a rise in active listings, home prices remained the same at $340,000 for the second month in a row.
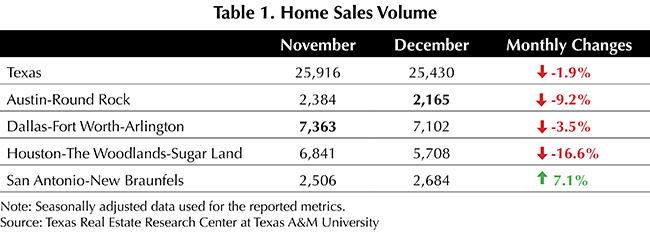
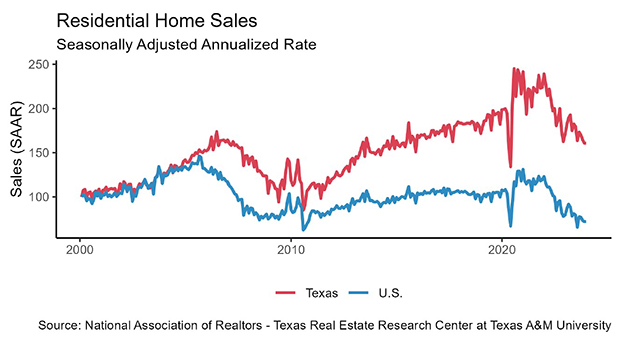
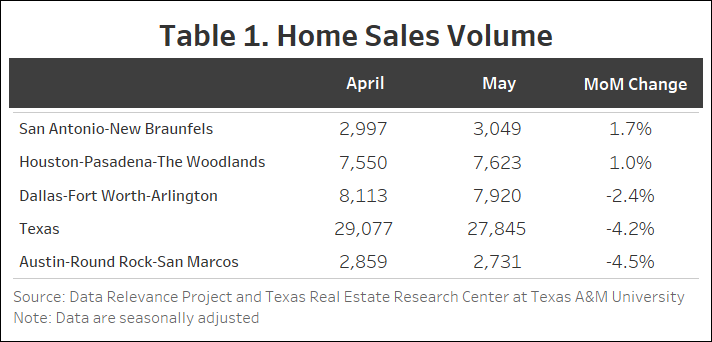
Texas witnessed a 4.2 percent decrease in total seasonally adjusted home sales month over month (MOM), resulting in 27,845 homes sold (Table 1). Austin and Dallas experienced decreases of 4.5 percent (2,731) and 2.4 percent (7,920), respectively. However, San Antonio and Houston experienced slight increases of 1.7 percent (3,049) and 1 percent (7,623). Overall, there has been a significant downward trend for sales compared with the past few years.
New listings have been steadily increasing, although there is a slight drop of 2.9 percent (45,878) in May. Among the Big Four, San Antonio experienced the only increase at 6.4 percent. Austin saw the largest decline at 13.3 percent while Dallas dropped 6.6 percent. Houston’s new listings were relatively unchanged.
The state’s average days on the market (DOM) remained unchanged at 57. Austin and San Antonio each fell by two days while Dallas has remained at 50 days for two months. San Antonio continues to have the highest days on market among the Big Four with 71 days followed by Austin at 65 and Houston and Dallas have continued to average 50.
The number of active listings went up from 111,053 to 116,404 (4.8 percent). The level of active listings increased across three of the Big four with Dallas (7.3 percent) and Austin (6.3 percent) leading the way with 26,758 and 11,604 listings, respectively.
Pending listings during May have been on a decline of 7.5 percent. All the Big Four except Houston experienced a substantial decline during this month. San Antonio pending listings fell the most dropping 10.6 percent followed by DFW and Austin dropping 8.4 and 7.8 percent, respectively. Houston was the only major city that experienced an increase in pending listings of less than 1 percent. The slowdown in sales and pending listings have contributed to the higher-than-normal active listing count.
Treasury and mortgage rates remain below their peak 2023 levels but have been increasing since the start of the year. The average ten-year U.S. Treasury Bondyield fell six basis points to 4.48 percent. The Federal Home Loan Mortgage Corporation’s 30-year fixed-rate fell by two basis points to 7.52 percent.
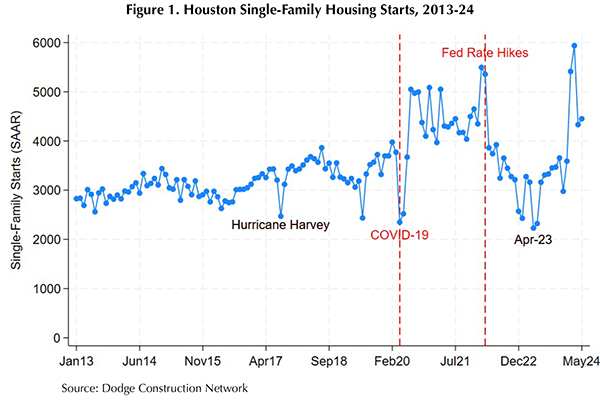
Outside of Hurricane Harvey (and a data anomaly in June 2019), Houston’s single-family housing starts were relatively stable month to month during the 2010s, exhibiting a slight downturn during the 2015 oil bust followed by a steady upward trend in the latter half of the decade. Figure 1 illustrates the trend breaks and increased volatility that characterized the COVID-19 pandemic and post-pandemic eras. Historically, low interest rates and a shift in preferences toward more living space (for both health concerns and work-from-home accommodations) fueled demand for single-family housing. Homebuilders, who also leveraged lower costs of financing, responded with a surge in single-family housing starts to levels not seen since the onset of the Great Recession.
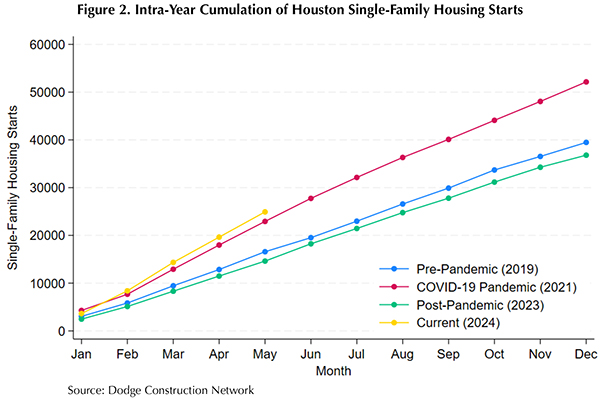
The Federal Reserve’s interest-rate hike in March 2022 marks a transition in the post-pandemic period, when housing starts descended and bottomed out at decade-level lows. In the second half of 2023, however, Houston housing starts trended near pre-pandemic levels, and activity surged to a record-high in March 2024. Despite correcting downward from the spring-time surge, the volume of starts remained above pre-pandemic levels. Figure 2 plots the intra-year progression of single-family start totals, highlighting the current trajectory in context of pre-pandemic, COVID-19 pandemic, and post-pandemic economic conditions. Houston is on a record-setting pace for single-family housing starts in 2024, but economic disruptions from Hurricane Beryl and projections of a hyper-active hurricane season present headwinds and short-run uncertainty.
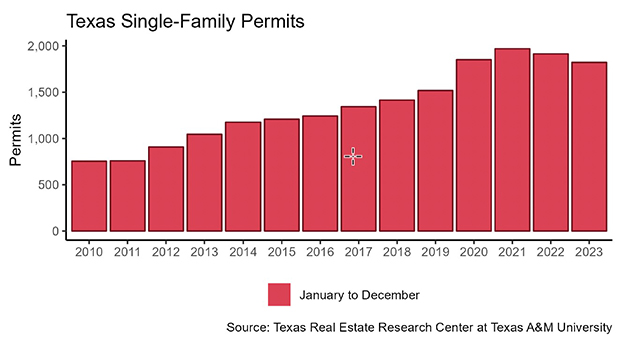
Texas’ number of single-family construction permits decreased by 2 percent MOM, reaching 13,539 issuances. San Antonio had the biggest monthly increase adding 1,048 permits or 9.7 percent. Houston had a slower month for permits with a decline of 15 (4,098) percent, following a big increase in April. Dallas decreased by a negligible 0.4 percent (4,207). Austin experienced a modest increase of 1.7 percent (1,409).
Construction starts declined according to data from Dodge Construction Network. Seasonally adjusted single-family starts decreased by 3.09 percent MOM to 13,290 units. After a massive drop in April of 27 percent, there was a slight upward swing in single-family starts for Houston of 2.8 percent (4,452). Dallas dropped by 17.8 percent (3,451) while San Antonio and Austin reported modest increases of 3.2 percent (892) and 1.6 percent (1,420), respectively.
The state’s total value of single-family starts climbed from $11.8 billion in May 2023 to $16.65 billion in May 2024. Houston accounted for 36.4 percent of the state’s total starts value followed by Dallas with 26.4 percent.
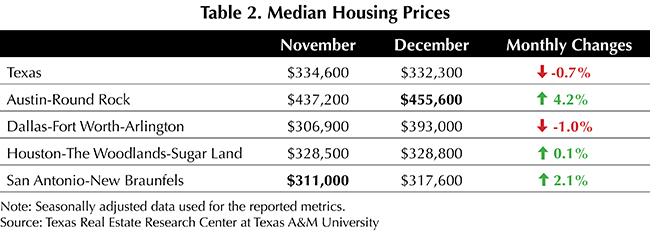
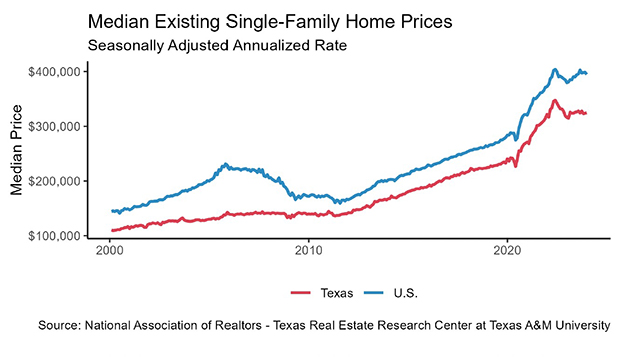
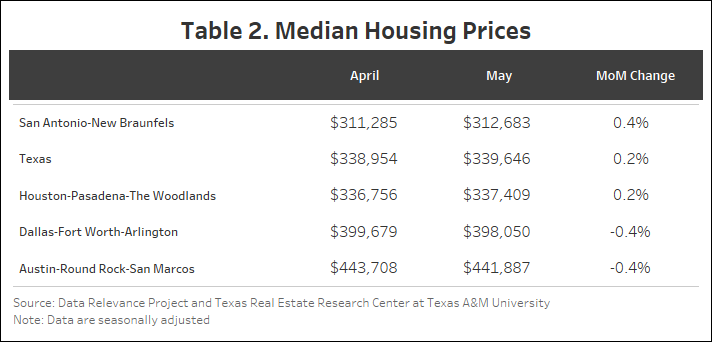
Texas’ median home price has remained stable at approximately $340,000 for four months (Table 2). The prices have remained stable this month with San Antonio and Houston increasing by 0.4 percent and 0.2 percent, respectively. Austin and Dallas both have declined by 0.4 percent. Despite there being an increase in new listings and active listings, housing prices have remained resilient. The Texas Repeat Sales Home Price Index (Jan 2005=100) grew 0.4 percent MOM and 2.2 percent year over year (YOY). Austin’s annual appreciation remains below the state’s average, falling by 1.5 percent YOY.
Source: Texas Housing Insight | Texas Real Estate Research Center (tamu.edu)


Seasonally adjusted housing sales bounced back in April following March’s decline. New listings
grew for the fourth month in a row resulting in the total active listings count growing to its highest level since July 2012. Home prices remained the same at $340,000 for the second month in a row.
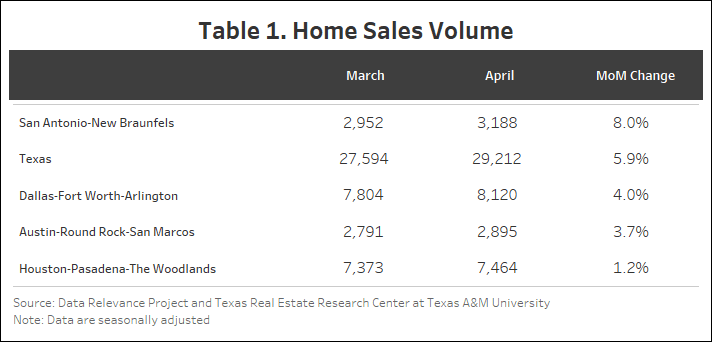
Texas witnessed a 5.9 percent increase in total seasonally adjusted home sales month over month (MOM), resulting in 29,212 homes sold (Table 1). All the major cities saw a slight increase in home sales. Previously, San Antonio had the highest decline at 9.2 percent, but looks to be recovering at an increasing rate of 8 percent—the highest among the Big Four, followed by Dallas at 4 percent.
New listings have been steadily increasing from December to April (2.8 percent) with only a slight decline of 0.5 percent in March. The April 2024 number stands at 47,000. Among the Big Four, Dallas has been declining for two months and is currently at 11,523 new listings. Austin, however, has increased by 25 percent between January and April.
The state’s average days on the market remained unchanged at 57. Austin fell by almost four days while Dallas rose by less than one. San Antonio is the only Big Four metro to experience an increase of a little over three days. As of April, San Antonio had the highest days on market of the Big Four, at 72 days. Austin followed at 66 days. Houston had the lowest at 46 days.
The number of active listings went up from 106,428 to 111,707 (4.9 percent) following the increase in new listings. Pending listings during April went up by only 0.6 percent. This growth was driven largely by Houston (10 percent) but offset by Dallas (5.6 percent) and San Antonio (3.3 percent). The Big Four experienced an upward trend in active listings with an addition of 1,555 for Austin (16.5 percent). Houston experienced a similar increased trend in active listings (10.7 percent) with an addition of 2,788 listings, almost five times that of the previous month. Dallas and San Antonio experienced relatively modest increases of 8.2 percent and 2 percent, respectively.
Treasury and mortgage rates remain below their peak 2023 levels but have been increasing since the start of the year. The average ten-year U.S. Treasury Bond yield jumped almost 33 basis points to 4.54 percent. The Federal Home Loan Mortgage Corporation’s 30-year fixed-rate rose by 17 basis points to 6.99 percent.
The housing market may be adjusting to a new normal that is characterized by an average 30-year fixed mortgage rate above 6 percent. Despite the persistence of higher mortgage interest rates, Texas’ residential mortgage activity is steadily improving as more pre-approved customers are searching for homes. Texas’ robust labor market and general economic strength are supporting housing demand despite scattered signals of financial distress across the nation. Financial vulnerability (e.g., rising credit card delinquencies) are currently concentrated on the lower end of the income distribution, where households are less likely to be prospective homebuyers. While that credit-health distinction somewhat shields the home-purchase market, it has broader implications for housing affordability and may carry consequences for the future economy.
Texas’ number of single-family construction permits increased by 0.9 percent MOM, reaching 13,805 issuances. After a massive dip in March, Houston has increased by almost 30 percent while all other major cities experienced moderate changes. Austin was the only city that had a fall of 5.9 percent (1,411) while San Antonio and Dallas experienced slight increases of 3.5 percent (953) and 1.6 percent (4,063), respectively.
Construction starts reduced according to data from Dodge Construction Network. Seasonally adjusted single-family starts decreased by 15.1 percent MOM to 13,731 units. Part of the pullback could be because February was such a strong month for starts, signaling an earlier-than-normal start to the construction home season. Houston had been experiencing an almost vertical increase from 56.8 percent in February, which began to slow down and has declined by 25.2 percent, while Dallas increased slightly by 10.7 percent (4,052). In contrast, Austin and San Antonio saw declines of 17.5 percent and 4.6 percent, respectively.
The state’s total value of single-family starts climbed from $9.15 billion in April 2023 to $13.19 billion in April 2024. Houston accounted for 36.2 percent of the state’s total starts value. Starts value activity is up from last year as Austin and San Antonio also posted moderate increases.
Texas’ median home price has remained stable at approximately $340,000 for two months (Table 2). However, across most major metropolitan areas, home prices saw a decline. Notably, Austin experienced an increase of 5.1 percent, moving the price from $421,572 to $443,247. Austin had the highest increase among the four major cities with a price change of $21,675. Prices increased by 2.1 percent in Houston and by a mere 0.7 percent in Dallas. San Antonio is the only city among the Big Four to experience a decline (0.9 percent).

The Texas Repeat Sales Home Price Index (Jan 2005=100) grew 0.9 percent MOM and 2.6 percent year over year (YOY). Austin’s annual appreciation remains below the state’s average, falling by 2 percent YOY.
Seasonally adjusted housing sales fell in March following February’s growth. Despite the drop, three months into the year cumulative sales are at the same level as last year. Home prices on the other hand remained the same at $340,000 for the second month in a row.
Texas Housing Insight is a summary of important economic indicators that help discern trends in the Texas housing markets. All measurements are calculated using seasonally adjusted data, and percentage changes are calculated month-over-month, unless stated otherwise.Data current as of March 22, 2024.

Seasonally adjusted housing sales fell in March following February’s growth. Despite the drop, three months into the year cumulative sales are at the same level as last year. Home prices, on the other hand, remained the same at $340,000 for the second month in a row.
Texas witnessed a 7.1 percent decrease in total seasonally adjusted home sales month over month (MOM), resulting in 27,595 homes sold (Table 1). Although most major cities experienced an upward trend in February, there was a slight downturn across the board in March. Notably, San Antonio saw the most significant decline at 9.2 percent, representing a decrease of over 296 sales compared to February. Conversely, Dallas-Fort Worth had the smallest decline, with only 259 fewer sales (a 3.2 percent decrease).

After a consistent increase in new listings from December to February, Texas experienced a slight dip, declining from 45,696 to 45,448 listings (0.5 percent). Among the major cities, only San Antonio defied the trend, maintaining stable new listings. However, both Dallas and Houston saw significant drops. Dallas witnessed a reduction of 2,399 listings (17.2 percent), while Houston experienced a decrease of 1,394 listings (9.8 percent).
The state’s average days on the market (DOM) decreased by one day from 57 to 56. Austin fell by almost ten days while Dallas fell by a mere two days. There weren’t any notable changes in Houston and San Antonio. Statewide inventory increased from 3.9 to 4.1 months.
The number of active listings went up from 101,933 to 106,269 (4.2 percent) despite the slight decline in new listings. One explanation for the increase could be the sudden decrease in pending listings, which fell 6.2 percent. The Big Four experienced an upward trend in active listings with an addition of 334 for Austin (3.6 percent). Both Dallas and Houston experienced a similar increased trend in active listings by 2.2 percent with an addition of 524 and 570, respectively. San Antonio experienced a modest increase of 226 (1.8 percent).
Treasury and mortgage rates remain below their peak 2023 levels but have been increasing since the start of the year. The average ten-year U.S. Treasury Bondyield stayed at 4.21 for the second consecutive month. The Federal Home Loan Mortgage Corporation’s 30-year fixed-rate rose by 4 basis points to 6.82 percent.
Texas’ number of single-family construction permits increased by 2.6 percent MOM, reaching 14,013 issuances. In Houston, there was a significant decline of 24.1 percent compared to the previous month. In contrast, Austin and San Antonio saw more modest increases, with 2.1 percent and 5.5 percent, respectively. Dallas permits decreased by 5.2 percent.
Construction starts rose alongside permits, according to data from Dodge Construction Network. Single-family starts rose by 2.6 percent MOM to 16,104 units. Houston had been experiencing an almost vertical increase from 56.8 in February, which is slowly reducing. It currently stands at 9.6 percent in March. San Antonio had a modest increase of 2.9 percent, and Austin rose by 15.8 percent. Dallas had surprisingly no change after the previous month’s 42 percent increase.
The state’s total value of single-family starts climbed from $6.55 billion in March 2023 to $9.51 billion in March 2024. Houston accounted for 36.6 percent of the state’s total starts value. Starts value activity is up from last year as Austin and San Antonio also posted moderate increases.
Texas’ median home price remained stable at approximately $340,000 compared to the previous month (Table 2). However, across most major metropolitan areas, home prices saw a decline. Notably, San Antonio experienced an increase of 4.2 percent, while Austin had the highest decline among the four major cities at 5.2 percent. Dallas saw a minor decrease of 0.3 percent, while Houston declined by 1.7 percent.

The Texas Repeat Sales Home Price Index (Jan 2005=100) grew 0.6 percent MOM and 2.8 percent year over year (YOY). Austin’s annual appreciation remains below the state’s average, falling by 0.7 percent YOY.
Source: Texas Housing Insight | Texas Real Estate Research Center (tamu.edu)


Housing sales rebounded from last month’s drop despite mortgage rates remaining at elevated levels. The average home price grew alongside sales, with the cost rising over $9,000 since December 2023. Single-family starts decreased while permits increased.
According to the latest data, Texas had a 14.6 percent increase in total home sales month over month (MOM), resulting in 29,209 homes sold (Table 1). Notably, all major cities in Texas experienced an upswing in housing sales compared to fourth quarter 2023. The most significant increase was in Houston (37.3 percent) with a remarkable surge of over 2,000 additional sales compared to December. The rest of the Big Four experienced strong monthly gains of over 10 percent.

The state’s average days on market remained unchanged with both Dallas and Houston hovering at 50 days for the second consecutive month. Both Austin (74 days) and San Antonio (64 days) recorded decreases, falling by four and three days, respectively.
Statewide active listings rose slightly to 105,475. For the second straight month, San Antonio (12,542) was the only one of the Big Four to post a monthly increase at 2.4 percent. Austin had the largest drop in active listings with a 2.4 percent loss to 8,109. Dallas (22,008) and Houston (24,699) had reductions of less than half a percent.
The state’s new listings rose to 43,817 in January. All four major metros posted monthly increases with San Antonio leading the way at 14 percent. Houston also had a strong increase of 9 percent. Amid the rise in active listings, the months of inventory (MOI) increased to 3.7. Dallas fell from 3.1 to 2.7 since November.by 0.5 percent in January.
Treasury and mortgage rates remain below their elevated 2023 levels as the ten-year U.S. Treasury Bondyield rose four basis points to 4.06 percent. However, the Federal Home Loan Mortgage Corporation’s 30-year fixed-rate rose 18 basis points to 6.64 percent.
Texas’ single-family construction permits increased 1.8 percent MOM to 12,723 issuances. Dallas continued its fall from last month, dropping 2.6 percent to 3,415 starts while Houston experienced a minor fluctuation of less than 1 percent. Austin and San Antonio reported strong increases of 7.9 and 14.3 percent, respectively.
Construction starts fell alongside permits, according to data from Dodge Construction Network. Single-family starts decreased 1 percent MOM to 11,908 units. Austin reported the only monthly increase among the Big Four, rising just shy of 2 percent. Houston (1.3 percent) and San Antonio (0.5 percent) moderated. Dallas starts plummeted in January, falling 22.1 percent to 2,537 starts.
The state’s total single-family starts value climbed from $2 billion in January 2023 to $2.7 billion in January 2024. Houston accounted for a third of the state’s total starts value. Starts activity is up from last year as Austin and San Antonio posted moderate increases.
The state’s median home price rose 2.8 percent, reaching $341,840 (Figure 1). Among the major metropolitan areas, Houston and Dallas recorded the only increases, with 3.3 percent and 1 percent, respectively. Conversely, San Antonio saw home prices decline by 4.3 percent, which was the lowest among the Big Four. Notably, Austin had previously experienced the most significant price surge of 4.2 percent, but median prices decreased by 0.5 percent in January.
The majority of sales fall into the $200,000-$300,000 and $300,000-$400,000 price range cohorts, accounting for 27 and 25 percent of total home sales, respectively.
The Texas Repeat Sales Home Price Index (Jan 2004=100) grew 0.3 percent MOM and remains 2.6 percent higher year over year. Austin’s annual appreciation remains well below the states average, falling to 3.2 percent.
Source – Texas Housing Insight | Texas Real Estate Research Center (tamu.edu) – Joshua Roberson (March 29, 2024)