Home for sale with red and white real estate sign during the fall season.  Fall season with leaves on ground.  Front porch and windows in background.  Residential neighborhood.  Moving house, relocation concept.

Fall Market Outlook for Residential Real Estate in North Texas

As we move into the final months of 2024, all eyes are on the North Texas real estate market. Buyers and sellers are paying close attention to key factors like mortgage rates, inventory levels, home prices, and broader economic conditions.

This fall market outlook is provided by Republic Title, an industry leader and title expert with over 30 years of experience in North Texas, who closely monitors market trends and provides valuable insights to stakeholders in the real estate industry.

Lowering Mortgage Rates Could Stimulate Demand

In September 2024, the Federal Reserve made a larger-than-expected rate cut, reducing the federal funds rate by 50 basis points. This was the first major rate cut since 2020, and it’s aimed at easing inflation and responding to economic uncertainty. While mortgage rates are not directly tied to the Fed’s decisions, they are often influenced by the broader economic environment the Fed’s actions shape.

Currently, the average 30-year mortgage rate hovers around 6.4% and experts are predicting a gradual decline in rates through the next year. This shift is expected to bring more buyers back into the market, especially as they anticipate further reductions.

Inventory Levels Are Slowly Increasing

Housing inventory is slowly on the rise in North Texas

One of the key changes in the North Texas real estate market is the steady increase in inventory. This gradual rise is providing buyers with more options and helping to alleviate some of the intense bidding wars that characterized the pandemic-era housing boom. However, despite this progress, inventory levels remain relatively low by historical standards, meaning the market still favors sellers to some extent. Typically, a balanced market is defined by around six months of inventory, where neither buyers nor sellers have a clear advantage. The current trend suggests we are moving in the right direction.

DFW Suburbs: A Growing Popularity Trend

(Photo: Mimi Perez for CandyDirt.com)
Historic Downtown Wylie (Photo: Mimi Perez for CandyDirt.com)

While Dallas and Fort Worth continue to attract a steady stream of buyers, the affordability of surrounding suburbs is a major draw for many North Texans. A recent study by GoBankingRates.com ranked Dallas suburbs Lewisville, Waxahachie, Midlothian, and Wylie among the “Most Affordable” areas, with homes under $500k.

These cities, along with others like Frisco and McKinney, offer excellent amenities, quality schools, and a growing infrastructure, making them attractive for buyers looking for a balance between affordability and convenience. The availability of homes under $500k in these suburbs is a significant factor, especially as prices in Dallas and Fort Worth continue to rise.

The appeal of DFW suburbs lies not only in their affordability but also in their continued expansion. These areas are growing rapidly and are set to provide great long-term value for buyers who are priced out of the Dallas and Fort Worth housing markets.

Economic Factors and the 2024 Presidential Election

Beyond mortgage rates and inventory, the broader economy is also playing a role in shaping the North Texas real estate market. Inflation has cooled slightly, but uncertainty around economic growth continues to influence consumer confidence. As we approach the 2024 Presidential election, economic policies and political outcomes could further affect real estate decisions.

Historically, election years can create a bit of a pause in the housing market, as buyers and sellers adopt a wait-and-see approach. However, the underlying fundamentals of the North Texas market remain strong, supported by population growth, business expansion, and relatively low unemployment rates in the region.

What This Means for Home Prices

As demand remains strong and inventory levels gradually rise, home prices in North Texas are projected to continue their upward trajectory. While they may not increase as dramatically as they did during the height of the pandemic, most experts predict a steady rise through the remainder of 2024.

Fannie Mae’s projection of a 6.1% increase year-over-year is the most optimistic, while the Mortgage Bankers Association and National Association of Realtors also expect solid growth, though at slightly more conservative rates of 4.1% and 3.8%, respectively.

The combination of lowering mortgage rates and modest inventory gains could create a window of opportunity for buyers who act swiftly, but those waiting too long may find themselves facing higher prices as demand outpaces supply.

The Importance of a Knowledgeable Real Estate Agent

In a market as dynamic as North Texas, having a real estate agent with local expertise is more crucial than ever. A seasoned agent understands how to navigate market fluctuations, secure the best mortgage rates, and negotiate deals in a competitive environment. Agents who keep a close eye on market trends can help buyers understand how potential changes in mortgage rates or inventory could impact their purchasing power. Similarly, for sellers, an agent’s expertise can help ensure that properties are priced correctly and marketed effectively.

In conclusion, the fall of 2024 presents a unique opportunity for buyers and sellers in North Texas. With mortgage rates expected to decline gradually, inventory levels improving, and the continued growth of our suburbs, the real estate landscape remains competitive but promising. As you navigate these market conditions, having a trusted partner to ensure a smooth transaction is critical. Republic Title, the preferred title partner in North Texas, offers proven experience, exceptional service, and a commitment to protecting your largest financial investments.

Source: Republic Title Tip: Fall Market Outlook for Residential Real Estate in North Texas – CandysDirt.com

Understanding-Title-Commitments-CD

Understanding Title Commitments

When it comes to real estate transactions, few documents are as important as the title commitment. This essential document, provided by the title company, serves as a roadmap for all parties involved, outlining the state of the property’s title and highlighting any potential issues that may need to be addressed before closing. At Republic Title, we understand that the title commitment can seem complex and daunting, but we’re here to simplify the process and ensure that your transaction proceeds smoothly.

In this article, we’ll break down the components of a title commitment, explain their significance, and highlight why choosing Republic Title as your trusted partner can make all the difference in your real estate journey.

What Is a Title Commitment?

A title commitment outlines the conditions under which a title insurance company will issue a title insurance policy. It discloses the current state of the title to the property, listing any liens, defects, or obligations that may affect the property’s ownership. The commitment is a crucial part of the due diligence process, providing transparency and protecting all parties involved in the transaction.

The title commitment is comprised of sections, known as Schedules A, B, C, and D. Each of these schedules serves a specific purpose, offering detailed information that is important to the successful completion of the transaction.

Schedule A: Actual Facts

Schedule A is often referred to as the “Who, What, Where, and How Much” section of the title commitment. It contains the key facts about the transaction, including:

  • The names of the proposed insured (buyer) and the current record owner (seller)
  • A legal description of the property
  • The sales price
  • The name of the lender, if applicable

This section is important because it ensures that all the basic details of the transaction are accurate and align with the terms of the contract. At Republic Title, we recommend that all parties carefully review Schedule A to confirm that the information is correct. If any discrepancies are found, it’s essential to address them promptly with your title company to avoid
delays.

title commitment

Schedule B: Buyer Notification

Schedule B lists the general and specific exceptions to the property that may limit a buyer’s use of the property or give others the right to use all or a portion of the property. The buyer takes the property subject to these exceptions and they are not covered by the title insurance policy.
This section may include:

  • Survey matters
  • Property taxes
  • Easements
  • Building setback lines
  • Mineral or Oil and Gas reservations or leases
  • Other restrictions or encumbrances

This section is critical because it informs the buyer of any potential issues or obligations that could affect their ownership of the property. Understanding these exceptions is key to making an informed decision.

Schedule C: Clear In Order To Close

Schedule C outlines any issues that must be resolved before the title can be transferred to the new owner. These issues, known as “clear to close” items, might include:

  • Existing mortgages that need to be paid off
  • Liens for home improvements
  • Unpaid taxes or other obligations that could include Abstracts of Judgement, State or Federal
    Tax Liens or Child Support Liens among other things.
  • Probate, Divorce or other legal proceedings

All items listed in Schedule C must be addressed and cleared before closing can proceed. Republic Title is dedicated to helping you resolve these issues efficiently, ensuring that your transaction stays on track and that you can close on your property without unnecessary delays.

Schedule D: Disclosure

Schedule D provides transparency regarding the amount of the title insurance premium as well as ownership of the title company and details all parties who will share in the insurance premium collected to issue the policy. This section typically includes:

  • Officers of the Underwriter and Title Agent

A title commitment is a vital document that plays a crucial role in the success of any real estate transaction. By understanding its components and working with a trusted title company like
Republic Title, you can ensure that your transaction proceeds smoothly and without unexpected surprises. From verifying the accuracy of Schedule A to clearing any issues on Schedule C,
Republic Title is here to guide you every step of the way. Whether you’re a first-time homebuyer, a seasoned investor, or a real estate professional, Republic Title is your go-to resource for proven experience and dedicated service. For more information, visit republictitle.com.

Source: Understanding Title Commitments with Republic Title – CandysDirt.com

HousingInsightJuly2024

Texas Housing Insight July 2024 Summary

July saw an increase in home sales and a sharp rise in building permits. The previous month’s decline was partly due to fewer business days, which led to a spillover of activity in July. New listings fell almost 10 percent, but active listings fell by less than 1 percent, possibly due to the counteracting increase in sales for the month. 

Home Sales Take Major Jump in July

Texas bounced back over June’s low sales with a 15.4 percent month-over-month (MOM) increase in seasonally adjusted home sales in July, resulting in 27,049 homes sold (Table 1). Houston experienced the largest increase among the Big Four at 21.7 percent (7,500), followed by Dallas (7,595) and San Antonio (2,807), which increased by 18.1 and 16.2 percent, respectively. Austin had the lowest sales change of the Big Four with a 13.9 percent increase, resulting in 2,378 homes sold in July.   

New listings fell by more than 4,000, a 9.8 percent drop from June. Houston, with 9,739 listings representing a 24.7 percent drop, was a major contributor to this decline, followed by Austin with 2,853 listings (18.8 percent drop). San Antonio (4,041) and Dallas (9,774) also experienced similar declines of 14 and 12 percent, respectively. Overall, the Big Four is seeing a downward shift in new listings that had been on the rise until April 2024, when they hit their high for the year so far.  

The state’s average days on market (DOM) remained unchanged at 59 days in July. San Antonio had the largest decrease—73 to 71 days, a 2 percent decline. Similarly, Austin dropped from 68 to 67 days. Dallas and Houston, on the other hand, have not shown any major changes.  

Texas’ number of active listings went down from 116,335 to 115,865 (0.4 percent). Active listings across the Big Four were mixed in July with Dallas, San Antonio, and Austin increasing by 4.7 percent (26,013), 2.4 percent (13,907), and 2 percent (11,426), respectively, while Houston fell 8.5 percent (27,503).   

Statewide pending listings in Texas have been on the decline since earlier this year with 4,292 fewer pending listings in July than in February, when they peaked at 29,274. San Antonio and Houston had the highest declines—8.4 percent (to a current 2,515) and 7 percent (6,686), respectively. Dallas had a smaller decline of 2.9 percent (6,837) while Austin (2,355) hasn’t had any major changes.

Interest Rates Dip Slightly

Treasury and mortgage rates both declined in July but as a slower rate than the month before. The average ten-year U.S. Treasury Bond yield fell 6 basis points to 4.25 percent. The Federal Home Loan Mortgage Corporation’s 30-year fixed-rate fell by 7 basis points to 6.85 percent.

Single-Family Permits Bounce Back, but Starts Fall

Texas’ monthly building permits bounced back in July, increasing 26.3 percent MOM after dropping 19 percent in June. All Big Four metros had growth except for San Antonio, which fell by 12.3 percent. Austin and Dallas grew the most at 28.3 percent and 71 percent, respectively. Both almost reached the April high point. Houston, however, failed to grow at the same rate as the others, rising only 6 percent.  

Single-family construction starts have been on the decline since March 2024. Seasonally adjusted statewide single-family starts decreased by 4.3 percent MOM to 12,542 units. The Big Four have been in decline with Houston leading at 12 percent, San Antonio at 6 percent, and Dallas at 1.8 percent. Austin has been relatively steady with only a 1 percent fall.  

The state’s total value of single-family starts climbed from $17.39 billion in July 2023 to $22.91 billion in July 2024. Houston accounted for 35.7 percent of the state’s total starts value followed by Dallas with 27.1 percent.  

Home Price Increase Slightly

Texas’ median home price rose 1.4 percent MOM in July from $332,866 to $337,382. Houston rose by 1.5 percent at $341,283 while San Antonio rose by 1 percent at $311,140. Austin rose by 0.3 percent. Dallas was the only one among the Big Four that had a slight decline of 0.3 percent.   

The Texas Repeat Sales Home Price Index (Jan 2005=100), which is a more accurate reflection of home price changes, fell 0.3 percent MOM in July but increased 1.4 percent year over year (YOY). Austin’s annual appreciation remains below the state’s average and fell by 3.2 percent YOY in July. 

Source:

Source: Texas Housing Insight | Texas Real Estate Research Center (tamu.edu)

BY JOSHUA ROBERSON, RHUTU KALLURand WESLEY MILLER (September 9, 2024)

ALTAEndorsementGuide

2024 Commercial Endorsement Guide

We’re excited to announce the release of the 2024 Commercial Endorsement Guide, your go-to resource for the top ALTA commercial endorsements. This guide is now available in both printed and digital formats, ensuring that you have the flexibility to access the information you need, whenever and wherever you need it.

What’s New in the 2024 Guide?

  • Interactive Digital Flipbook: The digital version of our guide is designed as an easy-to-navigate flipbook. You can quickly access a clickable list of top commercial endorsements and perform keyword searches to find exactly what you’re looking for. The flipbook is linked here for your convenience.
  • Alignment with 2021 Policy Forms: All endorsements in the guide are related to the 2021 Owners and Loan Policy forms.
  • New Endorsements: We’ve included new ALTA 10.2 and 10.3 endorsements.
  • Revised Endorsements: The guide also features updated endorsements, including the ALTA 3.3, ALTA 14 series, and ALTA 42.

Whether you prefer the tactile experience of a printed guide or the convenience of a digital one, the 2024 Commercial Endorsement Guide is designed to make your work easier and more efficient. Access it today and ensure you have the best tools at your disposal for your commercial transactions.

Click here to access the digital 2024 Endorsement Guide.

Printed guides are also available. Please contact Vicki Summerall or Andi Bawcum to request yours today.

Slide1

July 2024 DFW Real Estate Stats

In July 2024, the real estate market in the DFW Metroplex displayed varied trends across different counties.  Overall, the DFW Metroplex saw a mix of rising listing activity and extended market times, with some counties experiencing price growth while others faced slight declines in sales.

Collin County saw significant activity, with new listings increasing by 27% and active listings surging by 46.1%. The days on market (DOM) rose to 39 days, marking a 25% increase from the prior year. The average sales price was approximately $580K, slightly down by 1.4%, while the average price per square foot rose by 1.3% to $228. Closed sales increased marginally by 1.2%, reaching 1,452 units.

In Dallas County, new listings grew by 14.9%, and active listings by 42.2%. The DOM increased to 37 days, up over 27% from the previous year. The average sales price rose by 8.7% to $575K, with the price per square foot also seeing a rise of 2.1% to $241. However, closed sales declined by 3.3%, totaling 1,797 units.

Denton County followed a similar trend, with new listings up by 11.9% and active listings by 26.8%. The DOM was 39 days, up 8.3% from the previous year. The average sales price increased by 1.5% to $578K, and the price per square foot rose slightly by 0.5% to $223. Closed sales remained nearly flat, with a slight decrease of 0.1%, ending at 1,274 units.

Rockwall County experienced a modest increase in new listings by 6.2% and active listings by 31.7%. However, the DOM rose significantly to 60 days, an increase of over 33% from the prior year. The average sales price increased by 11% to $537K, while the price per square foot went up by 3.7% to $197. Closed sales dropped notably by 17.5%, totaling 179 units.

In Tarrant County, new listings increased by 11.9%, and active listings by 30.5%. The DOM was 40 days, a 25% increase from the previous year. The average sales price was $454K, with the price per square foot at $201. Closed sales saw a slight rise of 2.1%, reaching 2,054 units.

Our stats infographics include a year over year comparison and area highlights for single family homes broken down by county. We encourage you to share these infographics and video with your sphere.

For more stats information, pdfs and graphics of our stats including detailed information by county, visit the Resources section on our website at DFW Area Real Estate Statistics | Republic Title of Texas.

For the full report from the Texas A&M Real Estate Research Center and for NTREIS Local Market reports click here.

HousingInsightJune2024

Texas Housing Insight June 2024 Summary

Housing activity for both new and existing homes decreased considerably in June. Growth in active listings resulted in downward pressure on home prices. Seasonally adjusted home prices dipped 1.5 percent, which is uncharacteristic for June when housing activity normally peaks for the year.

Home Sales Take Major Downhill Slide in June

Texas witnessed a 14.2 percent month over month (MOM) decrease in seasonally adjusted home sales in June, resulting in 23,791 homes sold (Table 1). Dallas experienced the largest decrease among the Big Four at 16.8 percent (6,571) followed by Houston (6,474) and Austin (2,299), which each fell by 14.5 percent. The decline in San Antonio was relatively minimal, at 13 percent (2,587). As of June, year-to-date home sales are at the same levels as last year.

Recent data indicate a shift in new listings following a period of steady growth, notably led by Austin among the major metropolitan areas, which experienced a 13.6 percent decline to 3,513 listings. While all Big Four cities saw decreases, Austin’s decline was the most pronounced. Houston and San Antonio saw reductions of 3.8 percent (12,919 listings) and 2.4 percent (4,692 listings), respectively. Dallas exhibited the least variation, with a modest decrease of 1.2 percent (10,852 listings).

The state’s average days on market (DOM) increased from 57 to 59. Austin and Houston each increased by three days and are currently at 68 and 50 days, respectively. San Antonio and Dallas each increased by two days. San Antonio had the highest days on market among the Big Four with 74 days. Dallas had an average of 51 days. The number of Texas active listings went up from 113,714 to 116,797 (2.7 percent). The active listings across the Big Four were mixed in June with Houston increasing by 15.7 percent (30,179) while Dallas fell 9.7 percent (24,557). San Antonio and Austin had relatively smaller increases of 2.5 percent (13,576) and 0.3 percent (11,407), respectively.

Statewide pending listings in Texas have been on a decline since February with only a slight increase of 0.3 percent in June. San Antonio and Dallas both decreased by 10 percent and are currently at 2,459 and 6,493, respectively. Houston and Austin increased by 8 percent (7,592) and 4 percent (2,464), respectively. The slowdown in sales and pending listings in San Antonio and Dallas have contributed to their higher-than-normal active listing count.

Interest Rates Dip Slightly

Treasury and mortgage rates both declined in the month of June but was not enough to positively influence housing sales. The average ten-year U.S. Treasury Bond yield fell 17 basis points to 4.31 percent. The Federal Home Loan Mortgage Corporation’s 30-year fixed-rate fell by 14 basis points to 6.92 percent.

Single-Family Permits Follow Sales Decline

Texas state monthly building permits plummeted 18.9 percent MOM in June reaching 10,977. The Big Four faced a comprehensive decline to varying degrees. The decrease in Austin was the most significant, reaching 30.1 percent. Dallas also experienced a substantial drop, with a decrease of 20.1 percent. Houston and San Antonio had smaller declines of 7.1 and 7.7 percent, respectively.

Single-family construction starts also declined but to a much lesser degree according to data from Dodge Construction Network. Seasonally adjusted statewide single-family starts decreased by 0.3 percent MOM to 13,198 units. Austin had a slower month for permits with a decline of 3.2 percent. DFW actually increased 2.8 percent over May, reaching 3,566 starts. Houston and San Antonio had a slight increase of 0.4 and 0.1 percent, respectively.

The state’s total value of single-family starts climbed from $14.68 billion in June 2023 to $20.06 billion in June 2024. Houston accounted for 36.3 percent of the state’s total starts value followed by Dallas with 26.8 percent.

Home Price Declines

Texas’ median home price fell by 1.5 percent MOM in June with an overall decline in the Big Four areas (Table 2). Houston, San Antonio, and Austin each declined by less than one percent. Dallas experienced the largest decline, with a drop of 1.7 percent, surpassing the overall state decline. For a better understanding of repeat sales from the median approach, see Texas Home Price Index Explained – REC 101.

The Texas Repeat Sales Home Price Index (Jan 2005=100), which is a more accurate reflection of home price changes, fell 0.4 percent MOM in June but increased 1.4 percent year over year (YOY). Austin’s annual appreciation remains below the state’s average and fell by 1.5 percent YOY in June.


Source: Texas Housing Insight | Texas Real Estate Research Center (tamu.edu)

BY JOSHUA ROBERSON, RHUTU KALLURand WESLEY MILLER (August 6, 2024)

Sold house sign in Midwest suburban setting. Focus on sign.

The Home-Buying Process: An 11-Step Journey to Your New Home

Buying a home is an exciting journey, often marking a significant milestone in one’s life. However, it can also be a complex process, filled with important decisions and necessary steps. Partnering with an experienced and reliable title company, like Republic Title, can make this journey smoother and more enjoyable. With a mission to provide value to every customer they serve through Proven Experience, Dedicated Service, and Lasting Relationships, Republic Title ensures the transfer and protection of your title with the highest level of professionalism and integrity. Let’s walk through the steps of the home-buying process to help you confidently move forward in finding your dream home.

Step 1: Determine Your Budget and Get Pre-Approved

The first step in the home-buying process is determining how much you can afford. This involves evaluating your income, debts, and savings. Use a mortgage calculator to get an estimate of your monthly payments and consider getting pre-approved for a loan. Pre-approval gives you a clear picture of what you can afford and strengthens your offer when you find the right home.

Step 2: Research and Select a Real Estate Agent

knowledgeable real estate agent is valuable in navigating the home-buying process. They provide expertise on the local market, help you find homes that meet your criteria, and guide you through negotiations. Look for agents with good reviews, local experience, and a solid track record.

Step 3: Start House Hunting

Once you have your budget and real estate agent, it’s time to start looking for your new home. Make a list of must-haves and nice-to-haves to narrow down your search. Attend open houses, schedule private showings, and explore various neighborhoods to find a home that fits your needs and lifestyle.

Home Buying Process

Step 4: Make an Offer

When you find the right home, your real estate agent will help you make an offer. This involves determining a fair price based on comparable homes in the area, the condition of the property, and current market conditions. Be prepared for negotiations with the seller until you reach an agreement.

Step 5: Option Period

After your offer is accepted, you’ll enter the option period, a phase allowing you to conduct due diligence. While the option period is not mandatory, it is commonly negotiated and agreed to by the parties in residential real estate transactions. Typically lasting seven to 10 days, this period lets you further inspect the property and negotiate repairs or terms based on your findings. The option period allows you to back out of the contract without losing your earnest money if significant issues arise.

Step 6: Escrow and Title Work

Following the acceptance of your offer and the signing of the contract, you have three days to deposit the agreed-upon amount of earnest money with the title company. This deposit, held in escrow, demonstrates your commitment to the purchase. Republic Title will then conduct a thorough examination of public records to determine the property’s ownership, identify any liens, and uncover other matters that could affect the title, such as judgments, bankruptcies, divorce, or death. Any issues found will require further investigation by the title company before closing can occur, ensuring that you receive a clear title.

Home Buying Process

Step 7: Conduct a Home Inspection

home inspection is crucial to identify any potential issues with the property. Hire a professional inspector to evaluate the home’s condition, including the foundation, roof, electrical systems, and plumbing. If significant issues are found, you may negotiate repairs or adjust your offer.

Step 8: Get a Home Appraisal

Your lender will require a home appraisal to determine the property’s value. This ensures that the loan amount does not exceed the home’s worth. An appraiser will assess the property’s condition, location, and comparable home sales in the area.

Step 9: Loan Approval

After the home appraisal, your lender will review your loan application, accompanying documents, and credit history. An underwriter will analyze this information to ensure everything meets the lender’s requirements. Once approved, you will receive final loan approval, confirming your financing is secure.

Step 10: Purchase Homeowners Insurance

Homeowners insurance is essential for protecting your new investment. This insurance covers damages to the home and personal property due to events like fire, theft, and natural disasters. Ensure you have a policy in place before closing to protect your home from the day you take ownership.

Step 11: Close the Deal

The final step is the closing process. During this stage, you’ll review and sign various documents, including the loan agreement and deed. Republic Title’s team will facilitate the transfer of funds and ensure all legal requirements are met. After closing, you’ll receive the keys to your new home.

The home-buying process can be intricate, but with the right guidance and support, it becomes a rewarding experience. By choosing Republic Title, you’re not just protecting your investment; you’re partnering with a company dedicated to making your home-buying experience smooth, secure, and successful. For more home-buying resources, visit republictitle.com/buyer-resources.

Source: The Home-Buying Process: An 11-Step Journey to Your New Home – CandysDirt.com

Slide1

June 2024 DFW Real Estate Stats

In June 2024, the real estate landscape across various counties in the Dallas-Fort Worth area continued to show varied patterns.

In Collin County, there was a notable 9% increase in new listings, alongside a substantial 41.5% rise in active listings compared to the previous year. The average days on the market saw an 11% increase, while the average sales price slightly decreased to $593,841, and the average price per square foot dropped by 0.5%. Closed sales experienced an 8% decline from the prior year.

Dallas County observed a 5.6% growth in new listings, accompanied by a significant 38.7% increase in active listings year-over-year. The average days on market surged by 23.3%, while the average sales price decreased by 4.1% to $518,889. The average price per square foot, however, saw a slight uptick of 0.8%. Closed sales declined notably by 21.2% compared to the previous year.

In Denton County, new listings decreased by 6.2%, but active listings rose by nearly 25% from June 2023. The average days on market increased by 5.7%, while the average sales price showed a 4% uptick. The average price per square foot also increased by 4%, despite closed sales declining by 15% compared to the same period last year.

Overall, the real estate market in North Texas appears to be navigating through a phase of adjustment and recalibration in mid-2024. Monitoring these trends will be crucial to understanding how the market evolves in response to economic conditions and buyer sentiment in the coming months.

Our stats infographics include a year over year comparison and area highlights for single family homes broken down by county. We encourage you to share these infographics and video with your sphere.

For more stats information, pdfs and graphics of our stats including detailed information by county, visit the Resources section on our website at DFW Area Real Estate Statistics | Republic Title of Texas.

For the full report from the Texas A&M Real Estate Research Center, click here. For NTREIS County reports click here.

HousingInsightMay2024

Texas Housing Insight May 2024

All measurements are calculated using seasonally adjusted data, and percentage changes are calculated month-over-month, unless stated otherwise. Data are current as of June 22, 2024.
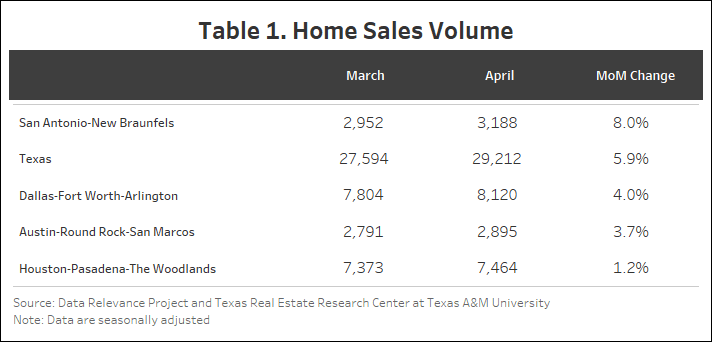
Housing activity for both new and existing homes decreased in May. Despite a rise in active listings, home prices remained the same at $340,000 for the second month in a row.

Slow Home Sales for May

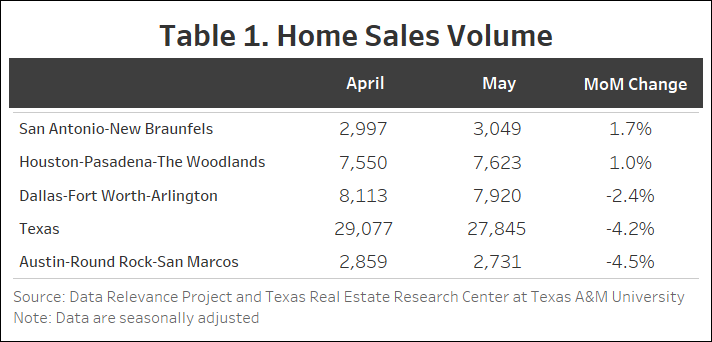
Texas witnessed a 4.2 percent decrease in total seasonally adjusted home sales month over month (MOM), resulting in 27,845 homes sold (Table 1). Austin and Dallas experienced decreases of 4.5 percent (2,731) and 2.4 percent (7,920), respectively. However, San Antonio and Houston experienced slight increases of 1.7 percent (3,049) and 1 percent (7,623). Overall, there has been a significant downward trend for sales compared with the past few years.

New listings have been steadily increasing, although there is a slight drop of 2.9 percent (45,878) in May. Among the Big Four, San Antonio experienced the only increase at 6.4 percent. Austin saw the largest decline at 13.3 percent while Dallas dropped 6.6 percent. Houston’s new listings were relatively unchanged. 

The state’s average days on the market (DOM) remained unchanged at 57. Austin and San Antonio each fell by two days while Dallas has remained at 50 days for two months. San Antonio continues to have the highest days on market among the Big Four with 71 days followed by Austin at 65 and Houston and Dallas have continued to average 50. 

The number of active listings went up from 111,053 to 116,404 (4.8 percent). The level of active listings increased across three of the Big four with Dallas (7.3 percent) and Austin (6.3 percent) leading the way with 26,758 and 11,604 listings, respectively.

Pending listings during May have been on a decline of 7.5 percent. All the Big Four except Houston experienced a substantial decline during this month. San Antonio pending listings fell the most dropping 10.6 percent followed by DFW and Austin dropping 8.4 and 7.8 percent, respectively. Houston was the only major city that experienced an increase in pending listings of less than 1 percent. The slowdown in sales and pending listings have contributed to the higher-than-normal active listing count.

Interest Rates Dip Slightly

Treasury and mortgage rates remain below their peak 2023 levels but have been increasing since the start of the year. The average ten-year U.S. Treasury Bondyield fell six basis points to 4.48 percent. The Federal Home Loan Mortgage Corporation’s 30-year fixed-rate fell by two basis points to 7.52 percent.

Housing Highlight

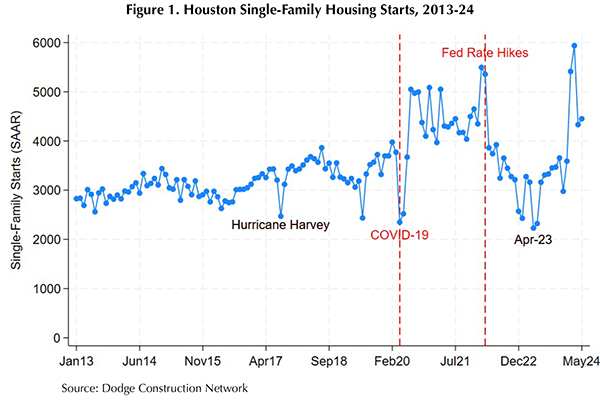
Outside of Hurricane Harvey (and a data anomaly in June 2019), Houston’s single-family housing starts were relatively stable month to month during the 2010s, exhibiting a slight downturn during the 2015 oil bust followed by a steady upward trend in the latter half of the decade. Figure 1 illustrates the trend breaks and increased volatility that characterized the COVID-19 pandemic and post-pandemic eras. Historically, low interest rates and a shift in preferences toward more living space (for both health concerns and work-from-home accommodations) fueled demand for single-family housing. Homebuilders, who also leveraged lower costs of financing, responded with a surge in single-family housing starts to levels not seen since the onset of the Great Recession.

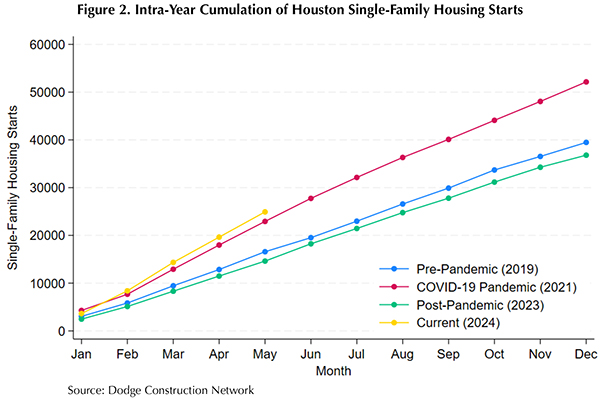
The Federal Reserve’s interest-rate hike in March 2022 marks a transition in the post-pandemic period, when housing starts descended and bottomed out at decade-level lows. In the second half of 2023, however, Houston housing starts trended near pre-pandemic levels, and activity surged to a record-high in March 2024. Despite correcting downward from the spring-time surge, the volume of starts remained above pre-pandemic levels. Figure 2 plots the intra-year progression of single-family start totals, highlighting the current trajectory in context of pre-pandemic, COVID-19 pandemic, and post-pandemic economic conditions. Houston is on a record-setting pace for single-family housing starts in 2024, but economic disruptions from Hurricane Beryl and projections of a hyper-active hurricane season present headwinds and short-run uncertainty.

Single-Family Starts and Permit Declining

Texas’ number of single-family construction permits decreased by 2 percent MOM, reaching 13,539 issuances. San Antonio had the biggest monthly increase adding 1,048 permits or 9.7 percent. Houston had a slower month for permits with a decline of 15 (4,098) percent, following a big increase in April. Dallas decreased by a negligible 0.4 percent (4,207). Austin experienced a modest increase of 1.7 percent (1,409). 

Construction starts declined according to data from Dodge Construction Network. Seasonally adjusted single-family starts decreased by 3.09 percent MOM to 13,290 units. After a massive drop in April of 27 percent, there was a slight upward swing in single-family starts for Houston of 2.8 percent (4,452). Dallas dropped by 17.8 percent (3,451) while San Antonio and Austin reported modest increases of 3.2 percent (892) and 1.6 percent (1,420), respectively.

The state’s total value of single-family starts climbed from $11.8 billion in May 2023 to $16.65 billion in May 2024. Houston accounted for 36.4 percent of the state’s total starts value followed by Dallas with 26.4 percent. 

Home Prices Unchanged

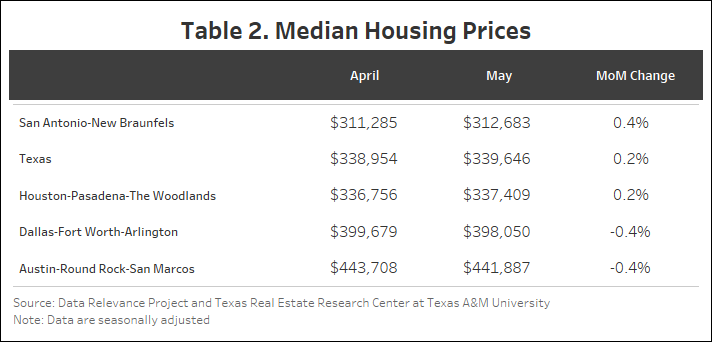
Texas’ median home price has remained stable at approximately $340,000 for four months (Table 2). The prices have remained stable this month with San Antonio and Houston increasing by 0.4 percent and 0.2 percent, respectively. Austin and Dallas both have declined by 0.4 percent. Despite there being an increase in new listings and active listings, housing prices have remained resilient.  The Texas Repeat Sales Home Price Index (Jan 2005=100) grew 0.4 percent MOM and 2.2 percent year over year (YOY). Austin’s annual appreciation remains below the state’s average, falling by 1.5 percent YOY.

Source: Texas Housing Insight | Texas Real Estate Research Center (tamu.edu)

BY JOSHUA ROBERSON, RHUTU KALLUR, and WESLEY MILLER (July 17, 2024)