Texas-Housing-Insight-February-2023

Texas Housing Insight February 2023 Summary

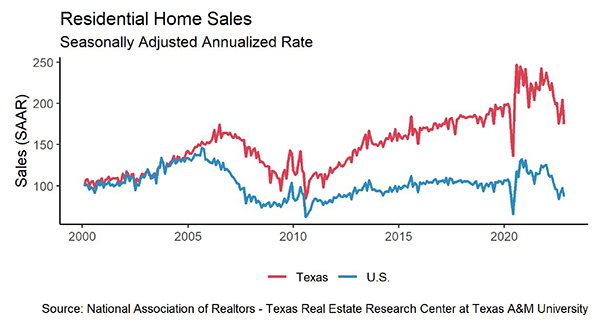
February’s housing market shows 2023 has returned to normal seasonal trends, something not experienced since 2019. Housing sales are back on trend with increases for the month, as are construction starts and permits. Rebounding to pre-pandemic levels means sales and construction activity are still decreased compared with the previous two years. This is likely due to inflated mortgage rates and high inflation. Days on market (DOM) increased across all major metros as inventory rose because of deflated demand. All of these factors point to a cooling housing market and a return to form.

Supply* Rises as Inventory Gains Ground

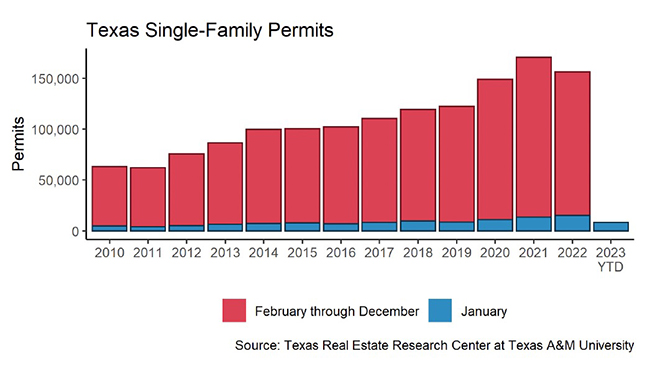
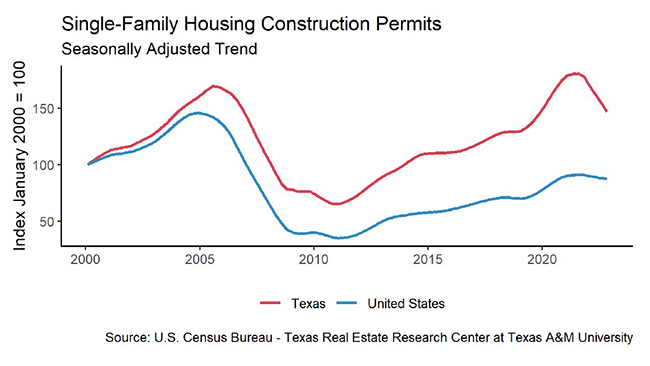
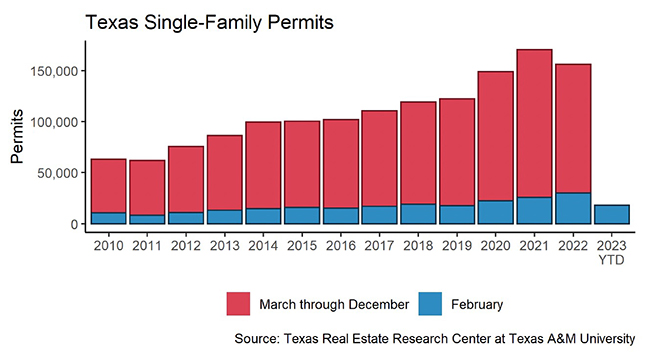
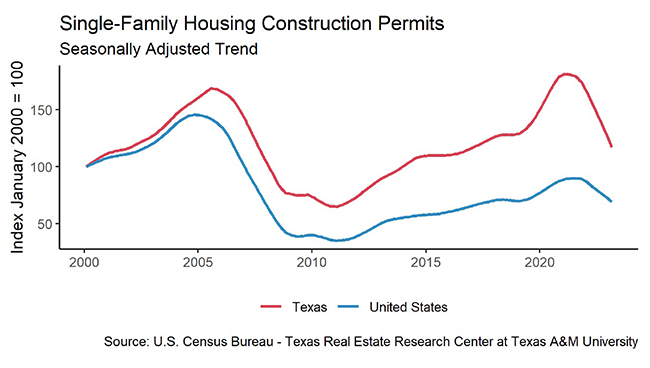
Single-family construction permits reversed their course for February, gaining significant ground with a 17 percent increase month over month (MOM). All four major metros contributed to the statewide rise, as they all had positive gains for February. Houston led the way with a 33 percent increase over last month (3,793 permits), while Austin lagged the rest with a 0.7 percent gain (1,160 permits).

Construction generally hits a seasonal low in December, and peaks in March or June. Single-family construction starts are following this trend with a seasonally adjusted MOM increase of almost 2 percent. December’s low point reached levels not seen since 2015, due in large part to the drastic increase in mortgage rates. March starts, around 9,200 according to Dodge Data & Analytics, pale in comparison to the previous two March levels, which were record-breaking peaks at the time.

The state’s total single-family starts value reached $4.3 billion in February, down from $7.5 billion in February 2022. Houston and Dallas-Fort Worth (DFW) are responsible for more than half of that. Houston continues to account for the largest portion of Texas’ construction values with 29 percent of the market share. DFW accounts for 25 percent.  Austin and San Antonio remained on par with previous years’ market percentage shares.

February’s active listings continued their upward trend since March 2022 after having slowed in the past two months, when the metric fell to 91,000 units after seasonal adjustment. Although, these levels are still lower than pre-pandemic listing levels. Additionally, despite the small dip last month, months of inventory (MOI) returned to an upward trend as inventory levels reached three months. Austin’s MOI fell to just below three months. Dallas followed a similar trend, with MOI dropping to 2.2 months. Meanwhile, Houston and San Antonio bolstered the state with increases, raising the overall months of inventory.

Demand Increases as Sales and Prices Jump

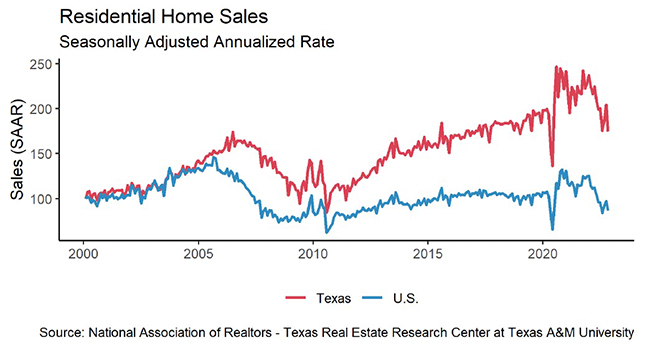
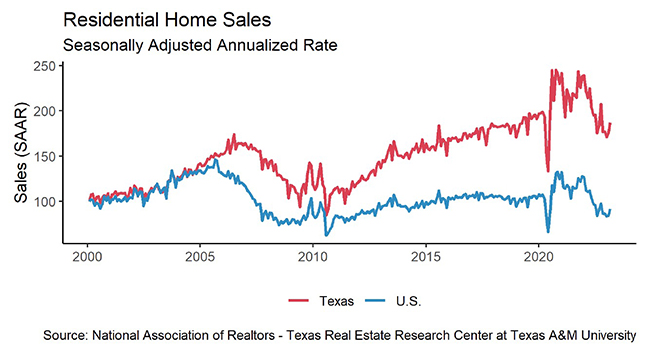
Housing demand started the new year with an upward trend, as sales volume expanded for two consecutive months. Total home sales had a strong boost of 7.8 percent MOM, doubling last month’s 3.7 percent growth. Sales gained more than 2,000 transactions in a month, marching upward to a seasonally adjusted rate of 29,728 closings. Austin and Houston, the two metros that had their great rebound in January, stayed flat this month (Table 1). Meanwhile, Dallas and San Antonio spiked up. Dallas’ 17.1 percent growth brought more than 1,200 additional homes under contract in February.

Sales across all price cohorts continued to follow their normal seasonal cycle with sales increasing through all price cohorts. Homes in the $300K-$400K range remain at the epicenter of the market, making up 28 percent of Texas sales. This constitutes a 2 percent increase in market share for this price cohort over February 2022. DFW increased its market share by a similar 2 percent this month in the same cohort, as the other metros stayed on course with YOY market shares. Despite sales activity picking up, Texas’ average DOM steadily advanced four days in 2023 to 56 days. Compared with the five-year average of 59 days before 2020, the housing market is fast approaching historic norms. Austin posted a ten-year record of 71 days this month, the longest market time since 2013. This is a major swing from the intense market conditions from just a year ago.

Austin homes’ time on market uniformly lengthened across all price cohorts, while other metros had mixed trends. Among the homes valued above $400K, Austin’s DOM ranged from 57 to 69 days, at least ten days longer than the corresponding cohort in the DFW market. Houston homes in the $750K and above price cohort were in a hot market, staying on market only one day longer than homes below $200K.

Prices Flatten as Rates Remain High 

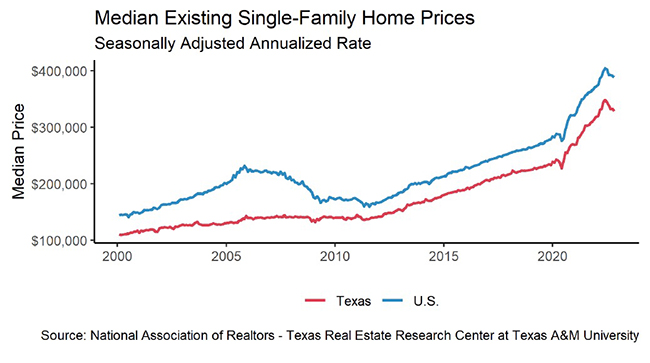
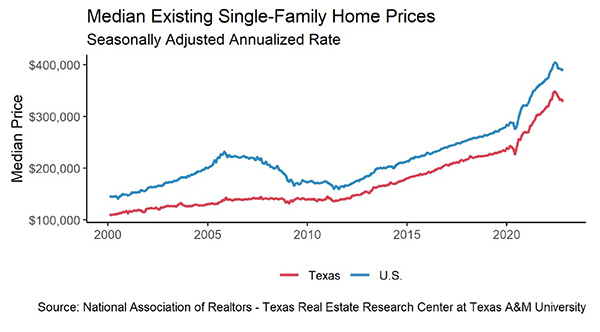
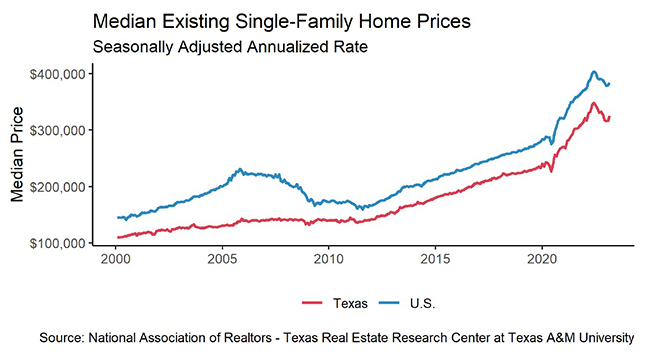
Texas’ median home price mostly stayed flat from the previous month, and only 0.6 percent higher than a year ago (Table 2). However, home prices did fall in Austin with 4.6 percent MOM and 12.2 percent YOY decreases. Dallas and San Antonio still saw low-single-digit price growth from a year ago.

The ten-year U.S. Treasury bond yield reversed the dwindling trend and marched upward 22 basis points to 3.8 percent. The Federal Home Loan Mortgage Corporation’s 30-year fixed-rate saw the fourth consecutive moderation since November, falling to 6.3 percent.

High mortgage rates have discouraged many homebuyers, driving demand down over the past year. The Texas Repeat Sales Home Price Index accounts for compositional price effects and provides a better measure of changes in single-family home values. Texas’ index gained 3.1 percent MOM. Austin stood out with an 8 percent YOY decrease. The other four metros had minor single-digit YOY increases, indicating possible price normalization.

_________________

* All measurements are calculated using seasonally adjusted data, and percentage changes are calculated month over month, unless stated otherwise.
Source – Joshua Roberson, Weiling Yan, and John Shaunfield (April 19, 2023)

https://www.recenter.tamu.edu/articles/technical-report/Texas-Housing-Insight

Texas-Housing-Insight-January-2023

Texas Housing Insight January 2023 Summary

January home sales increased month over month (MOM), but it was the slowest start since January 2017, a far cry from January levels from both 2021 and 2022. Other housing metrics, such as median price and inventory, may be showing early signs of stabilizing with only minor changes in recent months compared with the major swings experienced during the pandemic.

Supply1

Single-family construction permits had been sliding down in demand since March 2022. January 2023’s permit level fell 6.9 percent MOM to 8,897 permits. The other two months during the past three years that monthly permits dipped below 9,000 were during the initial pandemic shock in April and May 2020. Construction permits fell in all major metros except Austin. While housing demand in Houston (2,842 permits) was mostly flat, Dallas (2,249 permits) dropped more than 15 percent MOM. Austin’s monthly construction demand (1,082 permits) rebounded 10 percent, issuing twice as many permits as San Antonio (481 permits).

Texas single-family construction starts have likewise plummeted since March 2022 but started 2023 with a positive month in January with 9,090 units. Although construction starts rebounded in every major metro, the January metric was the lowest level reported in Texas since 2016, suggesting a meek outlook for the housing industry.

The state’s total single-family starts value diminished from $3.8 billion in January 2022 to $2.2 billion in 2023. Houston and Dallas continue to account for more than half of the states total, coming in at 27.5 percent and 26.1 percent, respectively. Further pressing the point home that housing activity is down from the previous year, Austin and San Antonio had their construction values nearly cut in half in the first month of 2023.

The rebound in active listings had been aggressive since March 2022. However, the acceleration slowed in the past two months as the metric fell flat at a seasonally adjusted rate of 91,000 units. Compared with the first half of 2022 when inventory was 50 percent short of pre-pandemic levels, housing inventory was only 4.5 percent short in January. Active listings in Austin have more than tripled from a year ago, reaching 8,500 units. Amid the recent flattening, months of inventory (MOI) dipped for the first time in the past eight months. The MOI for the four major metros ranged from 2.5 months to 3.4 months. While Dallas, Austin, and San Antonio all either hovered back or beyond pre-pandemic levels, Houston’s housing supplies still needed more homes to restock.

Demand

Total home sales inched up 3.4 percent MOM to a seasonally adjusted rate of 27,475 sales. This uptick marked the largest MOM jump since the second half of 2022. Sales in Austin and Houston rebounded greatly, with the former metro surpassing San Antonio’s sales volume and the latter surpassing Dallas’ (Table 1). While the housing market opened robustly in 2023, Texas’ sales still diminished by over 20 percent compared with last year’s January metric.

Sales grew across all price cohorts. While homes below $300K still make up 40 percent of the market, this sector’s sales volume rebounded least at 0.5 percent MOM. The remaining price cohorts ascended moderately at a low-single-digit growth, but homes above $750K grew at an impressive rate of 21.6 percent MOM, accounting for almost 9 percent of the market. 

With sales activity picking up, the Texas’ average days on market (DOM) continued to climb but at a slower pace of 54 days. Compared with the five-year average of 59 days before 2020, this is still converging to historic norms; and it is tilting toward a weaker market that favors buyers. Quadrupling since March 2022, Austin posted a first dip in DOM—balancing at 61 days.

Across all price cohorts except one, DOM rose to a range of 50 to 58 days, a three-day average increase across all the cohorts. The $400K-$500K housing sector’s DOM declined by 5.8 days over the previous month. Meanwhile, homes priced over $750K had a 55 DOM, one day higher than the $300K-$400K cohort.

Compared with a surge to 69 percent in 3Q2020 during the pandemic frenzy, Texas’ homeownership rate had been cooling, hovering around 63.6 percent in 2022. At the metropolitan level, the Dallas-Fort Worth (DFW) area was lowest at 56 percent, while Houston was highest at 67 percent. Austin and San Antonio were at 65 and 60 percent, respectively.

Prices

Texas’ median home prices started off the new year with a strengthened housing market. The 2.1 percent MOM rebound was the largest monthly gain since April of last year. All metros posted positive price growth except for San Antonio (Table 2). Median price per square foot (PSF) corroborated with the trend, as San Antonio’s price PSF dropped 1.6 percent MOM to $168.8.

The ten-year U.S. Treasury bond yield continued its four-month decline, reaching 3.5 percent2 in January 2023, while the two-year counterpart decreased to 4.2 percent. The spread between the ten- and two-year bond yields continued to widen for the seventh month straight. The negative spread indicated persistent market uncertainties, and the ten-year bond yield was still far below 2007’s peak of 5.1 percent. The Federal Home Loan Mortgage Corporation’s 30-year fixed-rate moderated slightly this month to 6.3 percent, down 0.1 percent from December.

Rapidly rising mortgage rates have continued to pester the housing market over the past year. The Texas Repeat Sales Home Price Index accounts for compositional price effects and provides a better measure of changes in single-family home values. The January metric was essentially the same as the month before. However, January’s index value of 220 was still 3.9 percent higher than the year before. The same trend also affected the major metros as growth rates shrank from double to single digits, except in Austin, which had a net loss in home values.

_________________

1 All measurements are calculated using seasonally adjusted data, and percentage changes are calculated month over month, unless stated otherwise.
2 Bond and mortgage interest rates are nonseasonally adjusted. 

Source – Joshua Roberson, Weiling Yan, and John Shaunfield (March 20, 2023)

https://www.recenter.tamu.edu/articles/technical-report/Texas-Housing-Insight

Seller-Leaseback-Issues

Seller Leaseback Issues

A Sellers Temporary Leaseback allows the seller to continue living in the home after closing for a limited time. The Seller leaseback begins when the sale is closed and funded and can last for up to 90 days. During this lease term the Seller is the tenant and the Buyer is now the landlord.
 
Join Republic Title’s Sarah Mann and Shaun Neidigh as they discuss:
– What is a Sellers Leaseback?
– What are the other terms that are negotiated?
– Additional considerations when negotiating a leaseback
 
For more informative videos from the Republic Title Legal Team, check out our YouTube channel: youtube.com/c/RepublicTitle/videos
 
Texas-Housing-Insight-December2022

Texas Housing Insight December 2022 Summary

Housing was one of the primary contributors to inflation in 2022. The pandemic-induced housing frenzy officially ended when the Federal Reserve began raising interest rates in June in an attempt to curb inflation. Since then, mortgage rates and the possibility of a recession sidelined many potential buyers. Demand in Texas plummeted as annual housing sales fell more than 10 percent. Supplies started returning to pre-pandemic levels. Amid 2022’s drastic changes, many housing indicators improved as homebuilders and buyers quickly adapted.

Supply1

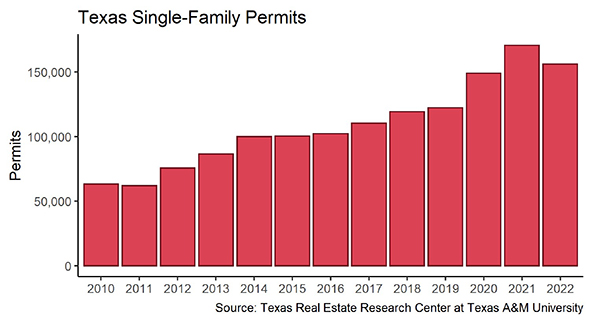
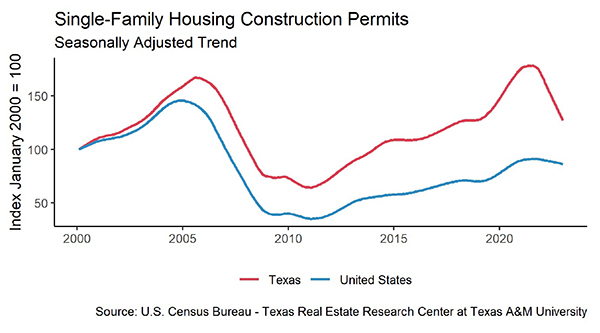
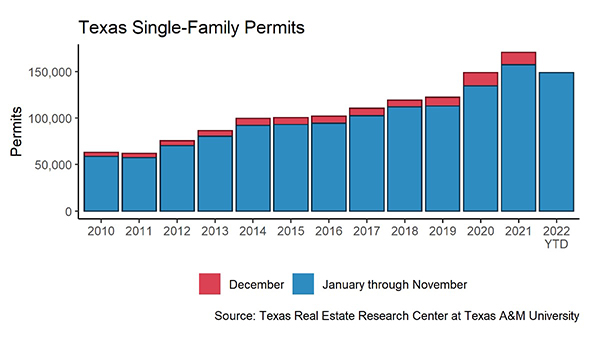
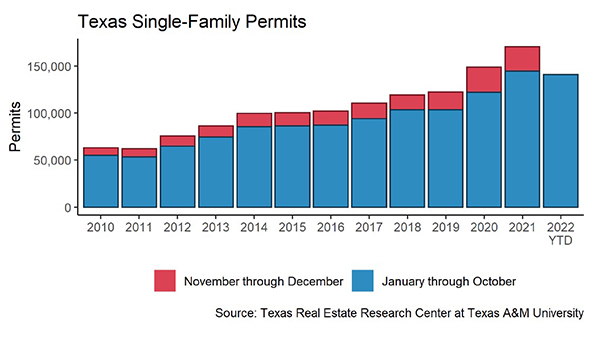
Homebuilders initiated fewer building projects than they did before the pandemic. Year-end single-family construction permits had a net loss of 8.4 percent year-over-year (YOY), shrinking from 170,557 permits to 156,189 permits in 2022. Monthly permits were flat in December, with fewer than 10,000 permits issued. Construction permits fell in all major metros. While housing demand in Dallas (2,786 permits) was mostly flat, Houston (2,886 permits)—the metro with the most construction permits in the nation—dipped 10 percent month-over-month (MOM). The gap between Austin’s (982 permits) and San Antonio’s (592 permits) housing expansion narrowed, as Austin’s monthly construction demand fell below 1,000 monthly permits for the first time since 2016.

Construction generally slows during the winter, and Texas’ single-family construction starts plummeted 33.5 percent from December 2021 to 10,203 units, corroborating a slowdown in the housing industry when accounting for the winter slump. According to Zonda, quarterly construction starts continued the fall from 3Q2022 in Texas’ four major metros except for Dallas-Fort Worth (DFW). While DFW’s construction starts rebounded 26.4 percent quarter-over-quarter (QOQ) and surpassed pre-pandemic levels, the remaining three metros fell short of 4Q2019 levels.

The state’s total single-family starts value diminished from $44.5 billion in 2021 to $38.4 billion. Houston and Dallas together contributed more than half of the state’s total at 29.6 percent and 26.6 percent, respectively. Austin’s market share was double that of San Antonio at 12.8 percent.

Active listings were flat at a seasonally adjusted rate of 91,600 units. Compared with the five-year average of 94,800 units before the pandemic, housing inventory was only 4.5 percent away from returning to the pre-pandemic volume. A year prior, inventory fell 50 percent short of pre-pandemic levels. Active listings in Austin fell 7 percent from November’s peak to 8,400 units, the first monthly dip since March 2022. This modest decline suggests Austin’s housing market may have returned to the traditional ebbs and flows seen before covid. Amid the recent slowdown, statewide months of inventory (MOI) ticked up to three months. The MOI for the four major metros ranged from 2.6 months to 3.4 months. While Dallas, Austin, and San Antonio inventories returned to pre-pandemic levels, Houston’s inventory was still below. 

Demand

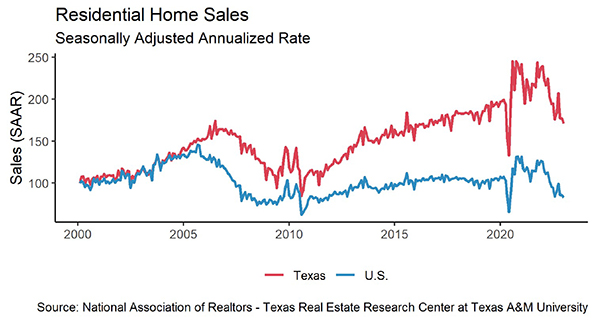
Nearly 30 percent of total home sales vanished from December 2021 to December 2022.  In the past 12 months, sales volume sank from 37,200 to 26,300 closed listings. On a yearly basis, Houston lost the most in terms of both percentage and total volume, losing close to 35 percent and 3,500 units. On a monthly basis, Austin and Dallas lost the most in terms of YOY percent decline at 4.4 percent (Table 1).

Rising mortgage rates affect home sales disproportionately across price cohorts. For example, when the housing frenzy started to cool in the first half of the year, the affordable home market (homes below $300K) was hit first, beginning a streak of quarterly declines. Next, as the Fed’s interest rates became more aggressive in the second half of the year, the higher-end home market (homes above $750K) was hit worst, shrinking in a downward trend twice as fast as the affordable home market’s declining rate. Thus, affordable housing was hit first by rising mortgage rates with pricier homes following suit later in the year. 

With sales activity slowing, homes are sitting on the market longer. Texas’ average days on market (DOM) rose to 52. Compared with the five-year average of 59 days before 2020, the latest DOM metric suggests the housing market is quickly approaching historic norms. Annually, Austin’s DOM rose most aggressively, jumping from 19 days to 67 days. Constrained by diminishing sales, Houston had the most moderate DOM rebound, rising from 32 to 51 days.

Before the pandemic, the state’s DOM ranged from 55 days to 83 days. Now, DOM ranged from 48 days to 59 days. The relatively truncated DOM interval implies the housing market still has room to improve. Another metric that signals the housing market can be more relaxed is DOM for pricier homes. Typically, the most expensive homes sit on the market the longest. However, DOM for homes priced over $750K was 50 days—shorter than homes in the $400K-$500K price cohort.

Prices

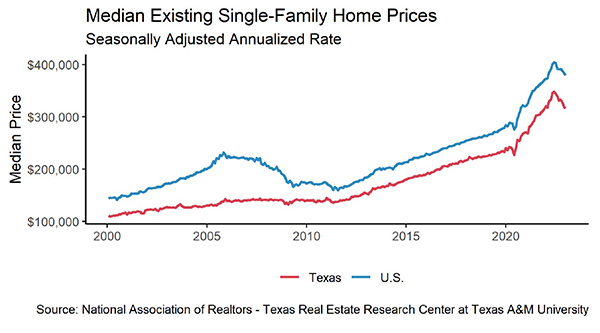
Texas’ median home price peaked in May at $349,900 and has since been falling. Despite the price correction in the second half of the year, the state’s median price still rose 3.7 percent compared with a year ago. Homes in the Austin metro were most volatile, as the median price fell more than $78,000 from its peak, settling at a seasonally adjusted rate at $463,900 (Table 2). Austin was also the only metro area that reported a net loss YOY, while Dallas, Houston, and San Antonio reported YOY growth between 4.4 and 6.1 percent.

Median home price for new construction was over 15 percent higher than existing homes.

The ten-year U.S. Treasury bond yield dropped 27 basis points to 3.6 percent2 in December, while the two-year counterpart was at 4.3 percent. The spread between the ten- and two-year bond yields continued to widen. The negative spread indicated persistent market uncertainties, and ten-year bond yield was still far below 2007’s peak of 5.1 percent. The Federal Home Loan Mortgage Corporation’s 30-year fixed-rate moderated slightly this month to 6.4 percent, dropping from an all-time high of 6.9 percent in October.

Rapidly rising mortgage rates hit home prices hard over the past 12 months. The Texas Repeat Sales Home Price Index accounts for compositional price effects and provides a better measure of changes in single-family home values. Compared with December 2021’s 20.1 percent YOY increase, Texas’ index accelerated 5.5 percent YOY in December 2022, indicating price normalization. The same trend also affected the major metros as growth rates shrank from double- to single-digits, except in Austin, which had a net loss in home values.

According to the Texas Housing Affordability Index (THAI), purchase affordability decreased to 1.1 in 4Q2022, indicating median family income was 10 percent more than the required income to buy the median-priced home. This metric was down 35 basis points from 1.45 in 4Q2021, and it suggested that despite slowing home price appreciation, households faced more financial burden to buy a home due to the higher mortgage rate. For more information on how higher interest rates affect homebuying, read “How Higher Interest Rates Affect Homebuying.” 

_________________

1 All measurements are calculated using seasonally adjusted data, and percentage changes are calculated month over month, unless stated otherwise.
2 Bond and mortgage interest rates are nonseasonally adjusted. 

Source – Joshua Roberson and Weiling Yan (February 14, 2023)

https://www.recenter.tamu.edu/articles/technical-report/Texas-Housing-Insight

December 2022 Stats

December 2022 DFW Area Real Estate Stats

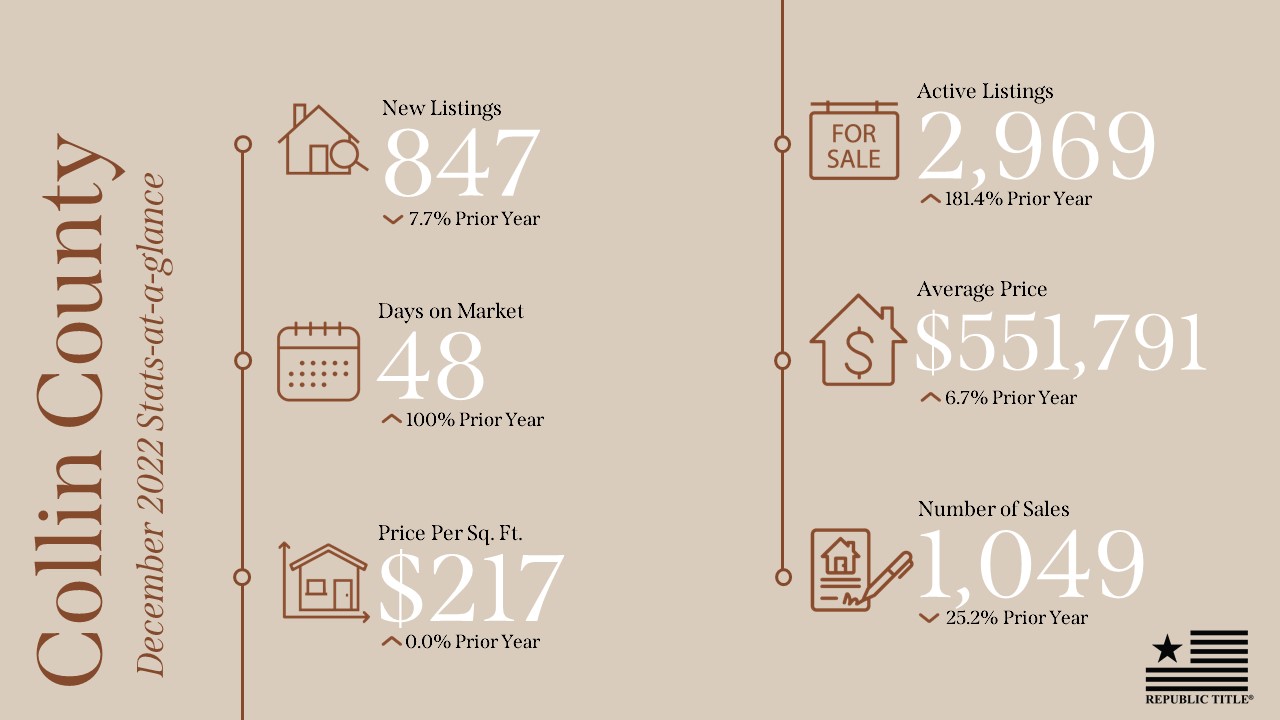
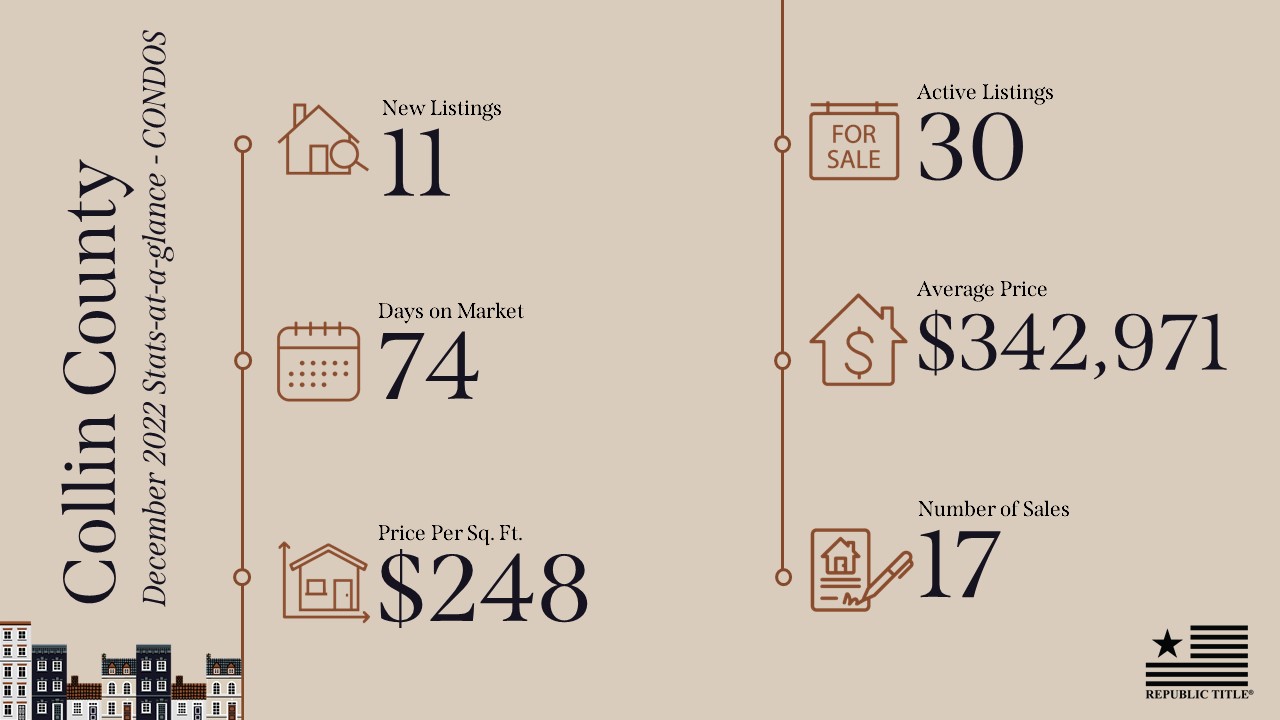
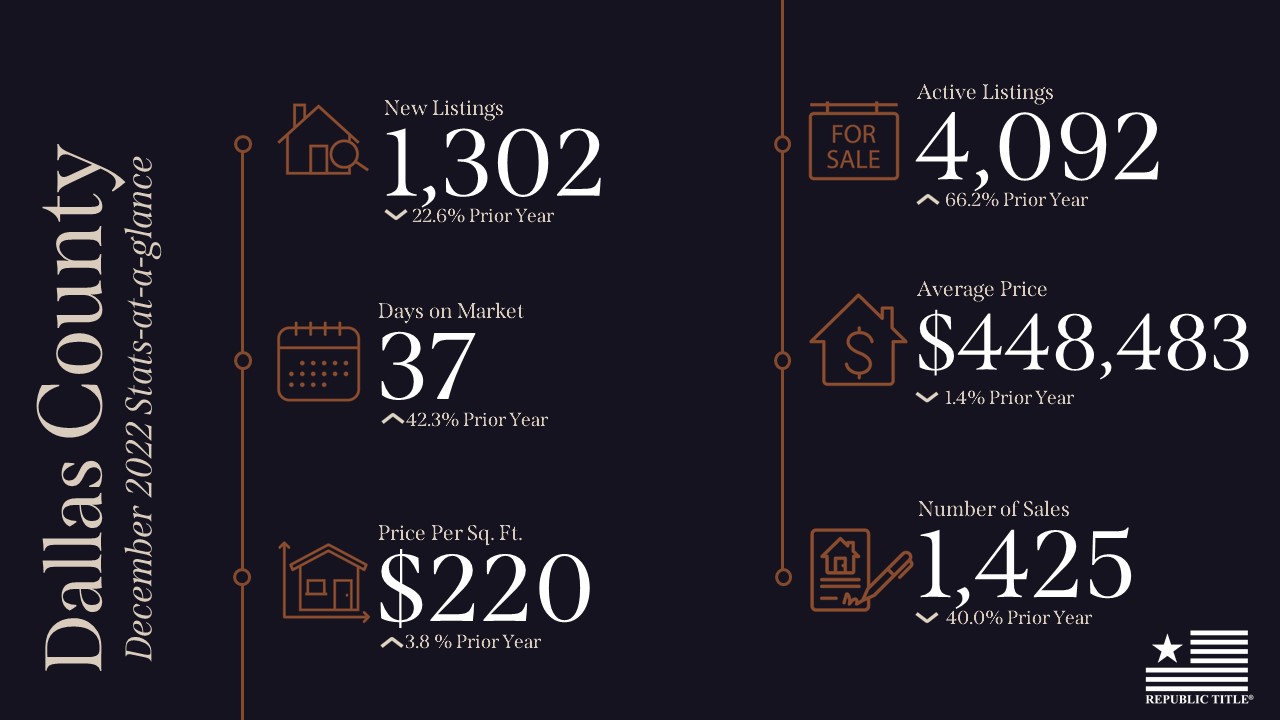
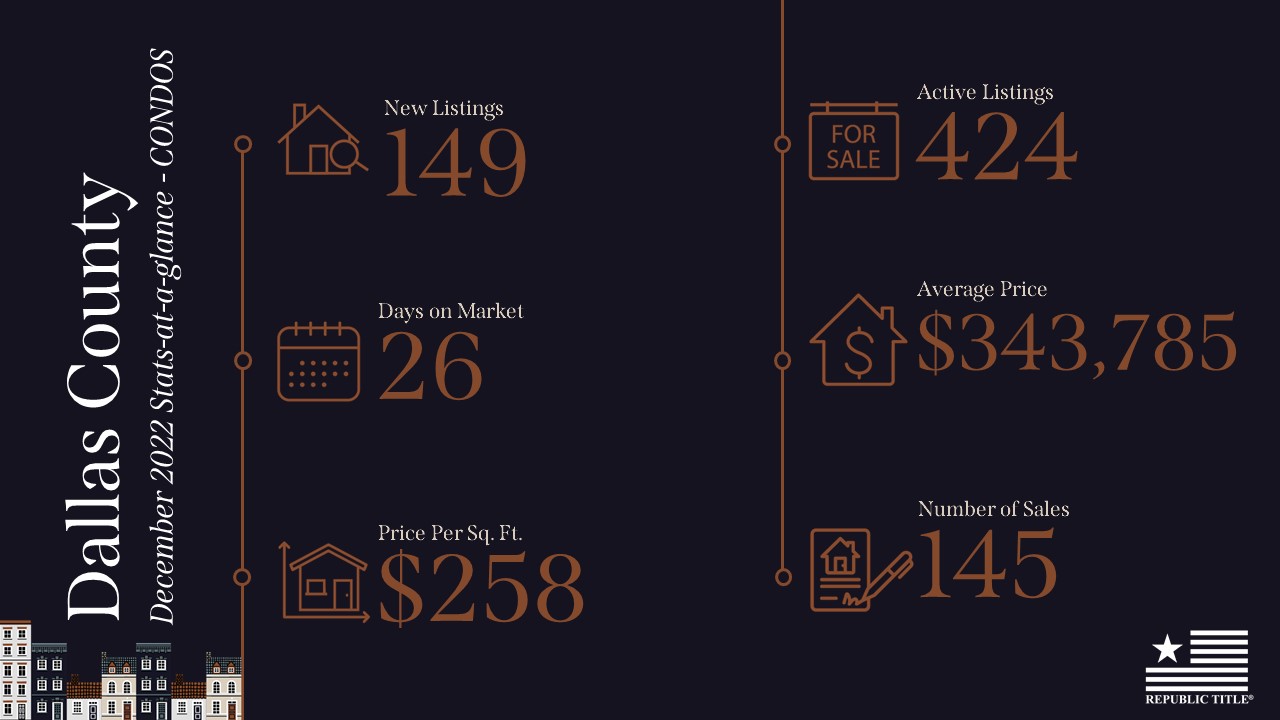
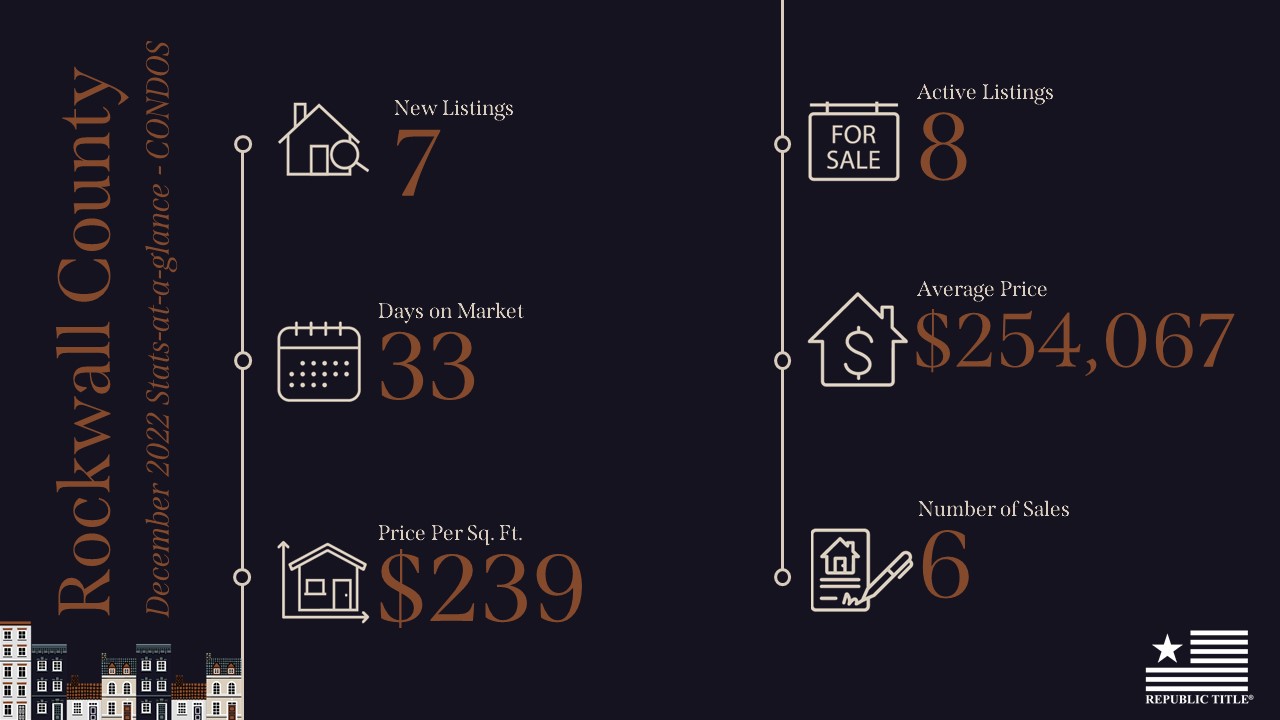
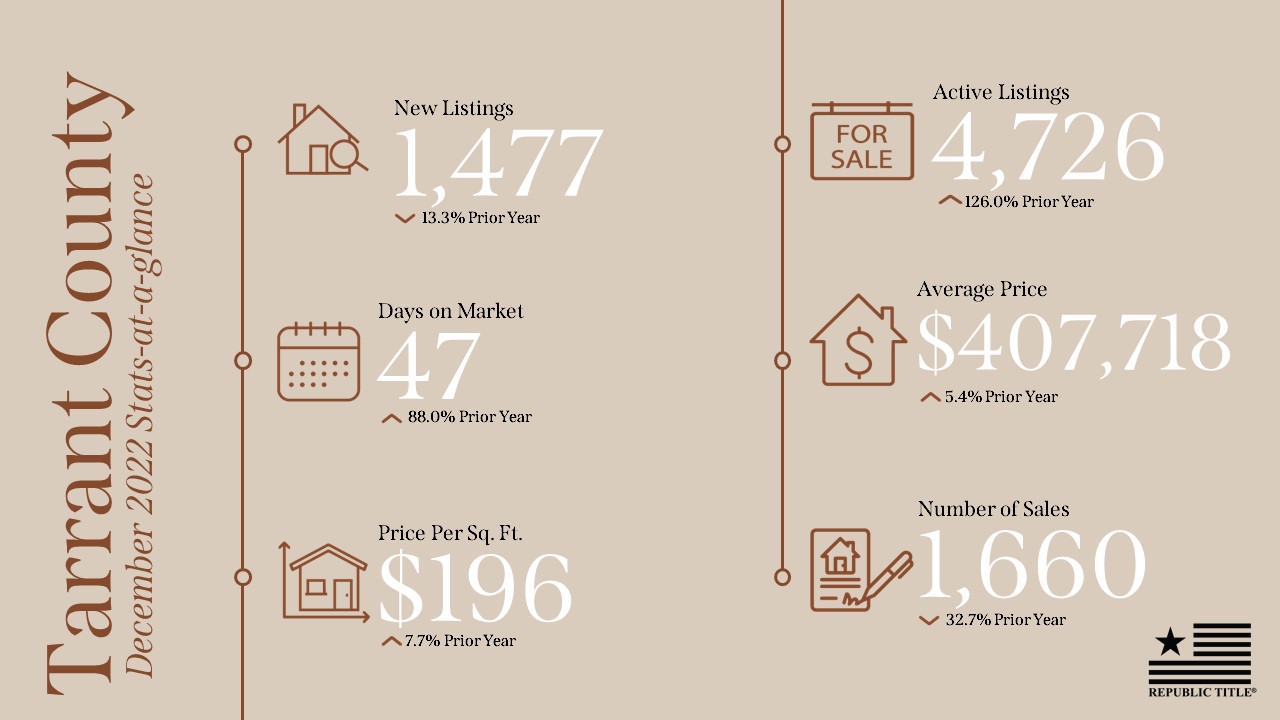
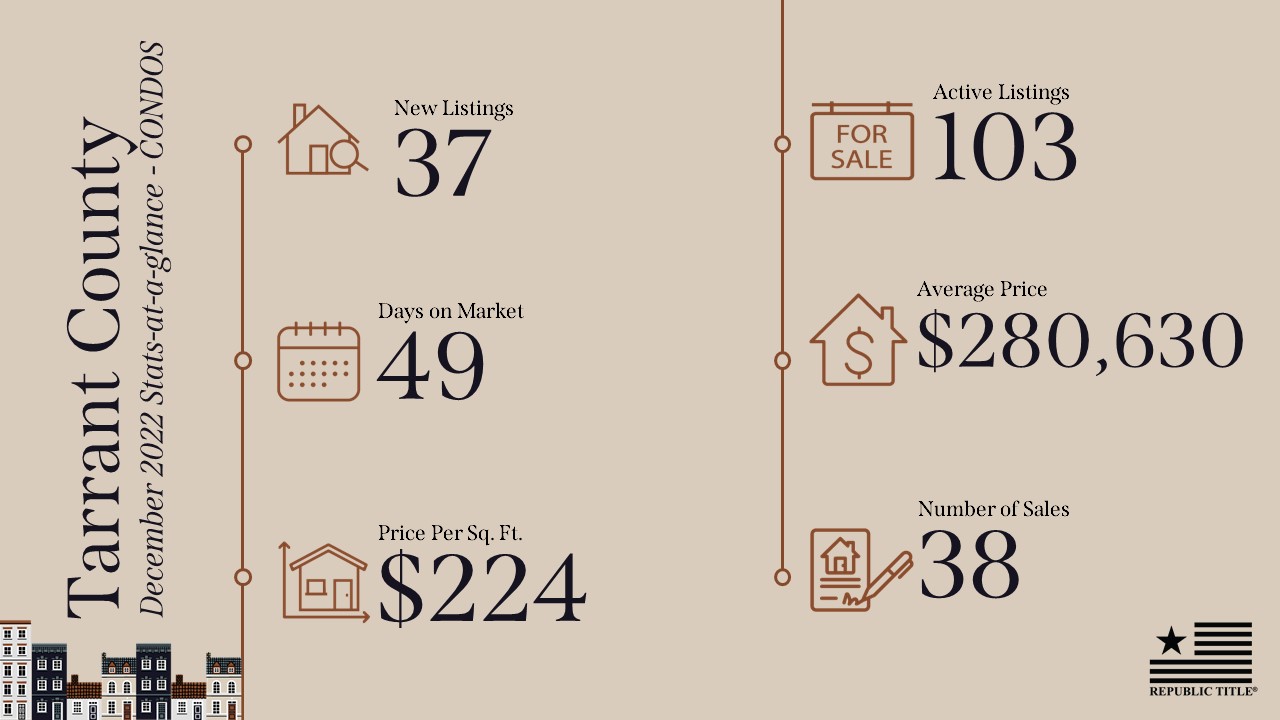
December 2022 Stats are IN!  Collin county shows an increase in all categories except number of sales compared to December of ’22.  Dallas County’s new listings for December were down 22% compared to last year, but active listings were up considerably from where they were a year ago. The average sales price was even down slightly at 1.4% as were the actual number of sales which is in line with the overall market.

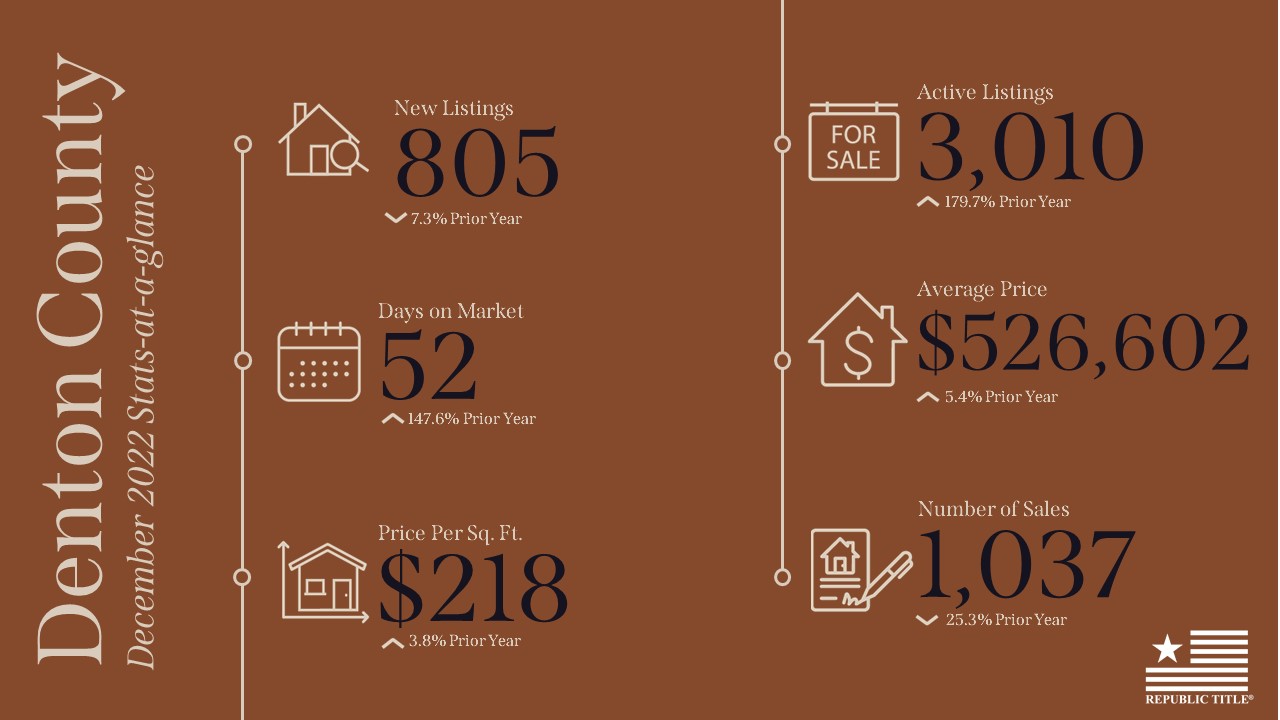
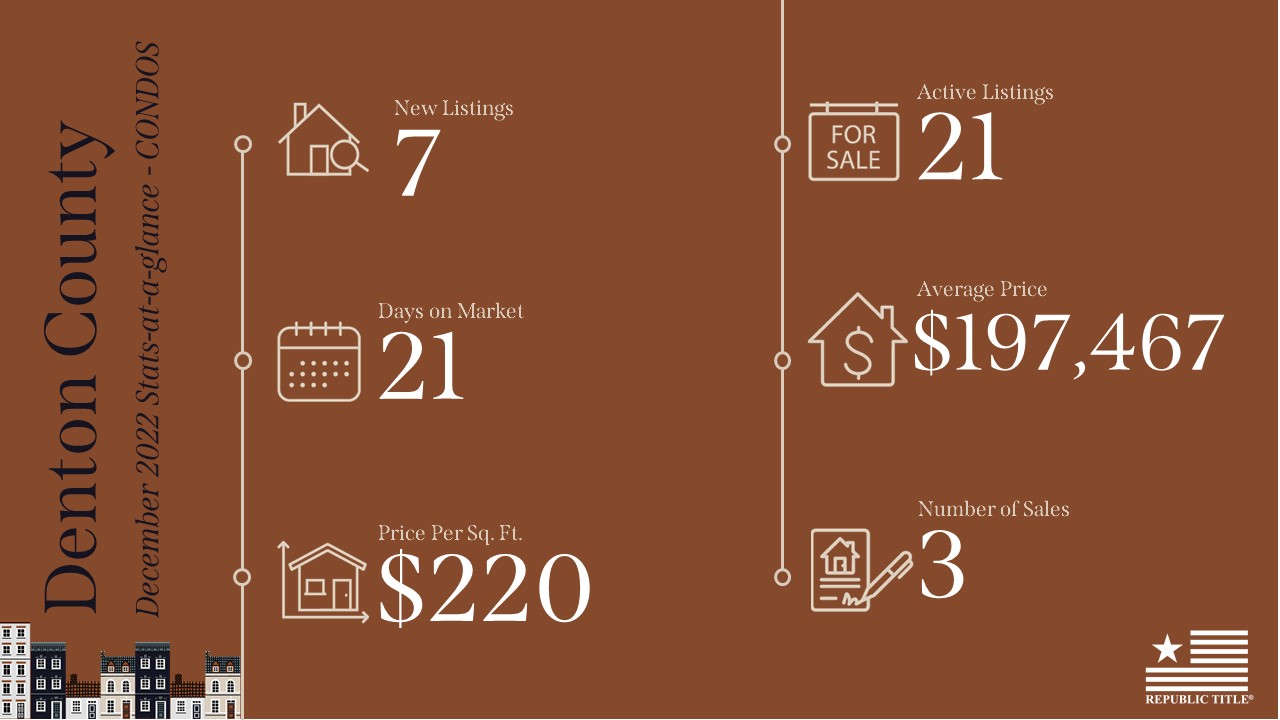
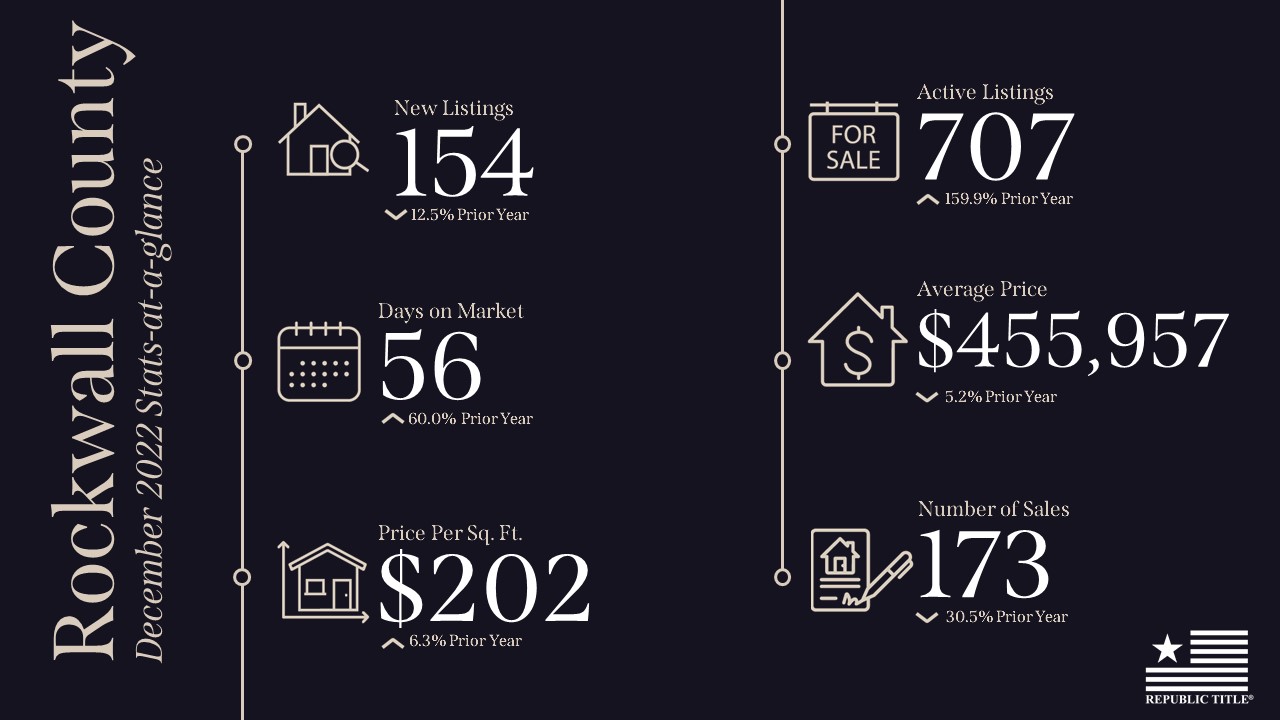
In Denton County, the story is the same with new listing down and active listings up along with the average sales price and price per square foot. In Rockwall the numbers reflect generally the same situation.  As we begin 2023 however, the number of listings coming on the market looks strong and it appears that we are still in very good shape in the Metroplex! Happy Selling!

Our stats infographics include a year over year comparison and area highlights for single family homes broken down by county. We encourage you to share these infographics and video with your sphere.

For more stats information, pdfs and graphics of our stats including detailed information by county, visit the Resources section on our website at DFW Area Real Estate Statistics | Republic Title of Texas.

For the full report from the Texas A&M Real Estate Research Center, click here. For NTREIS County reports click here.

Housing-Insight-November-2022

Texas Housing Insight November 2022 Summary

The housing market continued to slow down as people consider mortgage rates and recession fears when making financial decisions. On the supply side, housing permits and housing starts are both in decline. Prices are correcting, and the market is accumulating inventory. However, as suggested by the sales volume, buyers are calmer now than during the pandemic frenzy, as many key indicators such as days on market (DOM) and months of inventory (MOI) are uniformly converging back to pre-pandemic levels. With the expectation of a higher mortgage interest rates annual average in 2023, existing-home sales will likely fall short of 2022’s levels.

Supply1

Homebuilders are initiating fewer building projects. The state’s year-to-date cumulative single-family construction permits in November 2022 had a net loss of 5.2 percent, shrinking from 157,043 to 148,954 units. The monthly drop paused in November, and construction permit issuance remained below 10,000 units. Construction permits rebounded in all major metros except Austin. Dallas (2,886 permits) gained more than 300 permits, while issuance in Houston (3,223 permits) stayed steady. Despite the slight decrease in Austin, the tech metro (1,341 permits) expanded residential space for single-family homes twice as fast as in San Antonio (663 permits). Construction generally slows during the winter, yet even after the seasonal adjustment, Texas’ single-family construction starts plummeted 28.5 percent from 2021 to 10,700 units, corroborating a slowdown in the housing industry.

The number of homes for sale typically declines after the summer peak. However, active listings have been quickly accumulating to a seasonally adjusted level of 91,600 units. Compared with the five-year average of 94,800 units before the pandemic, this November’s housing inventory level is only 4.5 percent away from rebounding back to the pre-pandemic volume, rather than 50 percent a year ago. Amid the rebound, Texas’ MOI ticked up to 2.9 months. Austin’s inventory level jumped to a ten-year high with 9,000 homes ready for sale, while Dallas’s housing supply was tight with 20,000 homes for sale, 3,700 fewer than in November 2019.

Demand

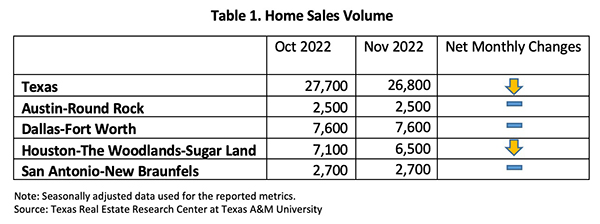
Total home sales inched down 3.3 percent month over month (MOM), settling at a seasonally adjusted rate of 26,800 closed sales (Table 1). Sales in Houston took a big hit, while sales in the other major metros stayed at October levels. Texas’ sales volume has shrunk by one tenth compared with a year earlier. As winter approaches, sales are expected to trend downward for the next two months.

Rising mortgage rates affect sales of differently prices homes disproportionately. Up to November, total sales for homes priced below $300K plummeted close to 30 percent in 2022, while total sales grew 15 percent for homes priced between $400K and $500K. The sales disparity between these two groups could suggest that rising rates sidelined more homebuyers in the lower-middle class than upper-middle class.

Amid slowing sales, homes are sitting on the market longer. Texas’ average DOM rose to 46 days. Compared with the five-year average of 59 days before 2020, the relatively brief period suggests the housing market is still relatively tight compared with historic norms. At the metropolitan level, Austin’s DOM rose most aggressively, doubling from 27 days in June to 57 days in November. Dallas’ DOM grew most moderately, rising from 25 to 42 days.

Before the pandemic, the state’s DOM ranged from 55 days to 83 days. Now, DOM ranged from 45 days to 52 days. The relatively truncated DOM interval implies the housing market still has room to improve. Another metric that signals the housing market can be more relaxed is DOM for pricier homes. Typically, the most expensive homes sit on the market the longest. However, DOM for homes priced over $750K was 45 days—shorter than homes in the $500K price cohort.

Prices

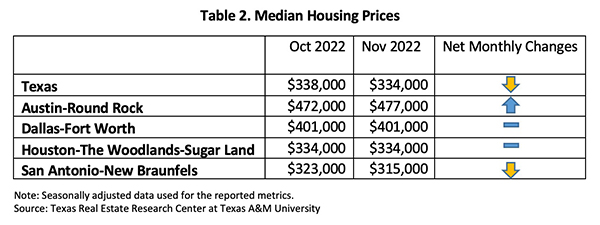
Texas’ median home price continued to fall, and the seasonally adjusted median price edged down 1 percent MOM. The four major metros posted mixed monthly changes (Table 2). Regardless of the depreciation in the past six months, the state’s median price remained 6.1 percent higher than year-ago levels. Dallas had the highest growth of 9.6 percent, while Austin’s growth rate deflated to 0.1 percent.

Since the Federal Reserve imposed the first 75-basis-point interest rate hike in June in an attempt to curb inflation, the ten-year U.S. Treasury bond yield jumped 129 basis points to 3.89 percent2, while the two-year counterpart surged by 150 basis points. The spread between the ten- and two-year bond yields widened while staying in negative territory, indicating persistent market uncertainties.

The Federal Home Loan Mortgage Corporation’s 30-year fixed-rate moderated slightly this month to 6.81 percent, but it still surpassed historical rates during 2007 and 2009. According to a Wall Street Journal analysis, some buyers have had to dodge the conventional way of borrowing from traditional lenders and instead borrow directly from family members or leverage either business or personal assets. 

The Texas Repeat Sales Home Price Index accounts for compositional price effects and provides a better measure of changes in single-family home values. Compared with November 2021’s 19.5 percent year-over-year (YOY) increase, Texas’ index accelerated 9.2 percent YOY in November 2022, indicating price moderation. The same trend also affected the major metros as growth rates shrank from double-digits to single-digits, except in San Antonio, which was 12.8 percent. Moderating home prices corroborated with the Fed’s inflation fight.

Household Pulse Survey

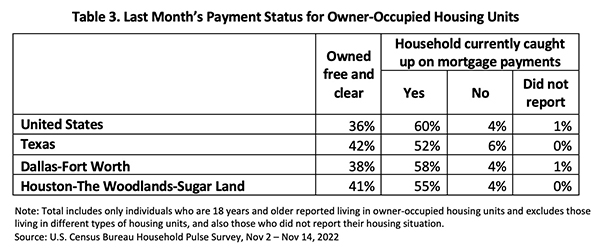
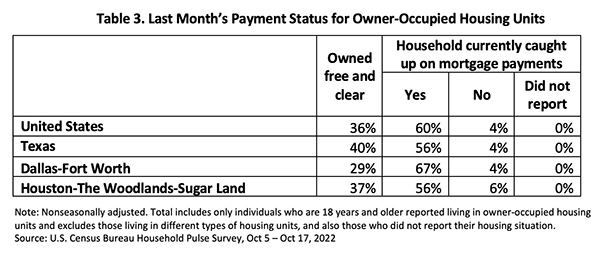
According to the U.S. Census Bureau’s Household Pulse Survey, after last year’s historical low rates, the share of homeowners who were free from mortgage payments ticked up 3 percent to 36 percent in the U.S. and up 5 percent to 42 percent in Texas (Table 3). The share of homeowners who were caught up on payments increased as well.

_________________

1 All measurements are calculated using seasonally adjusted data, and percentage changes are calculated month over month, unless stated otherwise.

2 Bond and mortgage interest rates are nonseasonally adjusted. Loan-to-value ratios, debt-to-income ratios, and the credit score component are also nonseasonally adjusted.

Source – Joshua Roberson and Weiling Yan (January 10, 2023)

https://www.recenter.tamu.edu/articles/technical-report/Texas-Housing-Insight
Blog

What You Need to Know About The 2023 TREC Contract Changes

In November 2022, the Texas Real Estate Commission adopted form revisions recommended by the Texas Real Estate Broker-Lawyer Committee that will become mandatory on February 1, 2023. Read on for the key takeaways as well as several different resources to help you navigate the upcoming changes.

  1. On November 7, 2022 the Texas Real Estate Commission adopted form revisions recommended by the Texas Real Estate Broker-Lawyer Committee. When are the forms effective? TREC says “The Notice to Prospective Buyer form is a voluntary use form and may be used once posted on the agency’s website. All remaining contract forms, once posted on the agency website, will be available for voluntary use until February 1, 2023, when their use becomes mandatory.” 
  2. The following forms have been updated/changed:
    Purchase Contracts –
    • One to Four Family Residential Contract (Resale)
    • New Home Contract (Incomplete Construction)
    • New Home Contract (Completed Construction)
    • Farm and Ranch Contract
    • Residential Condominium Contract (Resale)
    Addendum & Amendments –
    • Seller Financing Addendum
    • Addendum for Property Subject to Mandatory Membership in a Property Owners Association (HOA Addendum)
    • Amendment (Contract Amendment)
    • Third Party Financing Addendum
    • Addendum for Reservation of Oil, Gas and Other Minerals (Oil & Gas/Mineral Rights Addendum
    • Addendum Regarding Residential Leases (Lease Back Addendum)
    • Addendum Regarding Fixture Leases
    • Loan Assumption Addendum
    • Notice to Prospective Buyer
  3. The forms listed above are available on the TREC website and zipForms now and will replace the old versions of the forms. https://www.trec.texas.gov/article/revised-forms-available-voluntary-use-mandatory-use-begins-february-1-2023

HIGHLIGHTS OF THE CHANGES

WHICH FORM & SECTION?
Paragraph 3 of the One to Four Family Residential Contract (Resale)
WHAT’S CHANGED?
The Contract was changed to define the Cash portion of the Sales Price as follows: The term “Cash portion of the Sales Price” does not include proceeds from borrowing of any kind or selling other real property except as disclosed in this contract.
The Buyer should disclose if they are obtaining any financing or selling a property to obtain the cash portion of the Sales Price. Additionally, the Third Party Financing Addendum is updated to add “Other Financing” to accommodate alternative or hard money lenders.

WHICH FORM & SECTION?
Paragraph 7F of the One to Four Family Residential Contract (Resale)
WHAT’S CHANGED?
This paragraph is revised to require that the Seller: (i) provide the Buyer with copies of documentation related to repairs that shows both the scope of work and payment for the work completed; and (ii) transfer, at Seller’s expense, any transferable warranties related to those repairs at closing.
Also note, paragraph 9B(3) is amended to add that at closing, the Seller and Buyer shall execute and deliver any documents required for the transfer of any warranties, which could include additional warranties not covered under paragraph 7F.

WHICH FORM & SECTION?
Paragraph C of the Addendum for Property Subject to Mandatory Membership in a Property Owners Association (HOA Addendum)
WHAT’S CHANGED?
Paragraph C is amended to clarify that regular periodic maintenance fees, assessments or dues (including prepaid items) are prorated under Paragraph 13 of the contract and are not subject to Paragraph C of the Addendum.

Want to learn more? Join one of our three upcoming Contract Forms Update classes which will cover the 2023 changes.

January 11th with Steve Holley, Senior Vice President/Residential Counsel

January 20th with Matthew Visinsky, Senior Vice President/Senior Residential Counsel

January 26th with Charles Kramer, Independent Legal Counsel, Hunter & Kramer PC

Register now at www.republictitle.com/residential-education

Supplemental information to accompany Contract Forms Update classes can be found here: Contract Forms Update

Click here for printable version

Slide1

November 2022 DFW Area Real Estate Stats

November 2022 Stats are IN!

Active listings are up across the board with an increase of over 100% in Collin, Dallas, Denton, Rockwall and Tarrant counties compared to last year. It will come as no surprise that the average days on market has also increased in these counties over last year’s market. The number of sales in November has declined around 30% in each of the counties we report on compared to November 2021.

Although the real estate market is changing, North Texas continue to be one of the leading markets across the nation as we head into 2023. The National Association of REALTORS recently ranked the Dallas – Fort Worth – Arlington market as the #3 real estate market to watch next year.

Our stats infographics include a year over year comparison and area highlights for single family homes broken down by county. We encourage you to share these infographics and video with your sphere.

For more stats information, pdfs and graphics of our stats including detailed information by county, visit the Resources section on our website at DFW Area Real Estate Statistics | Republic Title of Texas.

For the full report from the Texas A&M Real Estate Research Center, click here. For NTREIS County reports click here.

Housing-Insight-October-2022

Texas Housing Insight October 2022 Summary

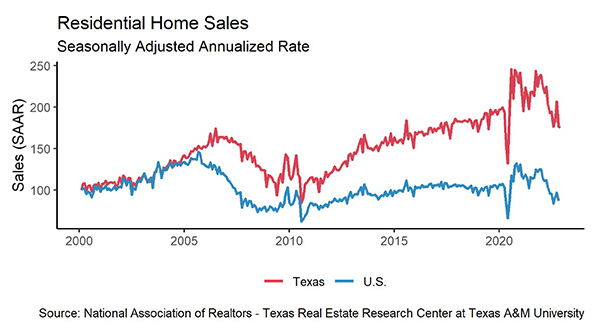
Since the Federal Reserve announced the first 75-basis-point increase in June of this year, the housing market has retreated with both demand and supply slowing down. Home sales were down 7.4 percent over the previous month, and housing starts for apartments doubled in a year as investors adapted their strategies from selling single-family homes to renting out apartments. As the Fed continues its aggressive inflation policies, mortgage rates will not drop until inflation is curbed. Home prices have been depreciating, and Austin—the metro that inflated the most during 2021—saw the largest depreciation amid the market’s abrupt slowdown.

Supply1

Texas’ single-family construction permits dropped below 10,000 units for the first time in two years. Despite slowing housing activities, Texas remained most active at authorizing construction projects, surpassing No. 2 Florida by one additional permit for every nine permits. Construction permits fell in all major metros except Houston. Dallas (2,545 permits) contracted by more than 700 permits in the past month, falling to a three-year low, while demand in Houston (3,226) stayed steady. As usual, Austin (1,380) was building homes twice as fast as San Antonio (629). Contrary to the weakened single-family sector, permits for Texas’ multifamily sector grew robustly. The number of issuances both for 2-4 family homes and apartments doubled from the year before.

The lumber producer price index (PPI) fell four times in the past six months, and the input cost had slid 17.6 percent since the year started. Since June’s interest rate rise, the South’s total housing starts plummeted quickly. However, this measure of new-home construction jumped to its highest level since bottoming out in June to 808,000 units in October, as housing starts inched up 6.7 percent month over month (MOM). Growth was driven largely by multi-unit construction permits while single-family units continued to stall.

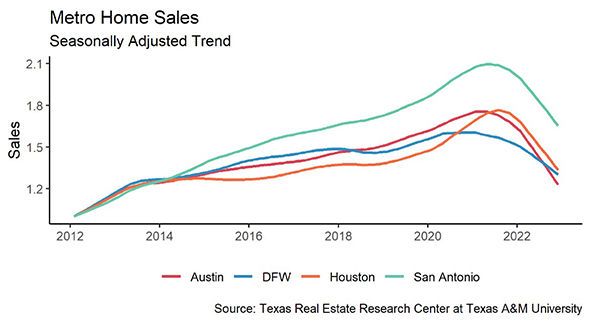
While new homebuilding projects are slowing, the state’s current supplies have been accumulating. Active listings grew 6.6 percent MOM to a seasonally adjusted rate of 89,800 units. Compared with March’s inventory of 41,800 units, the metric has doubled, and the state has nearly recovered to the pre-pandemic level. Accordingly, Texas’ months of inventory (MOI) ticked up to 2.7 MOI. San Antonio led the pack with three MOI, followed closely by Austin. Dallas remained the tightest with 2.3 MOI. This trend suggests a cooler housing market, considering the conspicuously low inventories in the past two years.

Demand

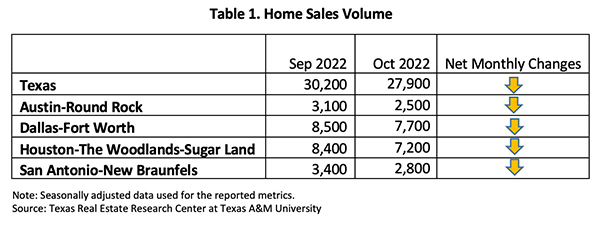
Total home sales diminished 7.4 percent MOM, settling at a seasonally adjusted rate of 27,900 closed listings (Table 1). Texas’ four Metropolitan Statistical Areas (MSA) all mirrored the statewide trend, as sales in each metro shrank by double digits YOY. The rapid decline in housing sales has revealed how important low mortgage rates are to the latest housing frenzy. According to Texas Realtors’ Data Relevance Project, October sales were down 21 percent from a year earlier. At the current rate, year-end 2022 sales will likely fall short of 2021.

Amid this plunge in demand, the remaining buyers prefer new homes to existing homes. When sales were differentiated by the existing-home market and the new-construction market, the state’s cumulative sales volume plummeted 8.8 percent YTD in the former sector, while the same metric jumped 9.2 percent in the latter sector. The sales disparity was even more pronounced in Austin.

Closed listings for homes priced below $300K fell below 10,000 transactions for the first time in a decade, falling close to 50 percent compared with February 2020. This is partially due to the fallen overall demand but more because of the rapid appreciation brought by the housing frenzy. Due to the rapidly rising price, the market share for home sales in this price cohort fell from 84 percent to 39 percent in the past ten years.

Homes are sitting on the market longer as a result of slowing sales. Texas’ average days on market (DOM) balanced at 42 days. DOM ranged from 37 days in Dallas to 47 days in San Antonio. Despite the prolonged waiting time, compared with the five-year average of 59 days before 2020, the relatively short period suggests the housing market is still relatively tight compared with historic norms.

Additionally, in February 2020 DOM ranged from 55 days to 83 days respectively for homes in the median price cohort and in the higher-end tail. In September 2022, the DOM interval was 43 to 44 days. The truncated DOM interval both in terms of value and difference of the two price cohorts implies the housing market still has ample room to fully return to the normal level.

Prices

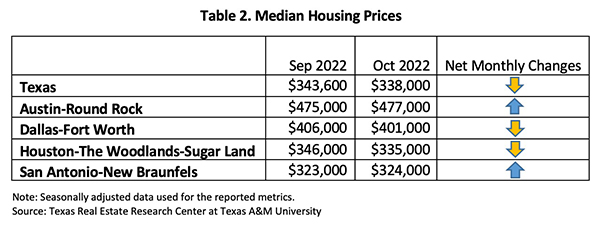
After a mild moderation in September, Texas’ median home price continued to decline. The state’s seasonally adjusted median price edged down to $338,000, decreasing 1.6 percent MOM. The four major metros posted mixed monthly changes (Table 2). Regardless of the recent depreciation, prices in these MSAs remained higher than their year-ago levels, with the lowest growth in Austin at 4.8 percent and highest in Dallas at 11.1 percent.

As the Federal Reserve imposed forceful monetary policies to curb inflation, the ten-year U.S. Treasury bond yield jumped to 3.98 percent2, while the two-year counterpart surged by a similar amount. The spread difference between the ten-year and two-year bond yields widened slightly while staying in negative territory, indicating persistent market uncertainties. The Federal Home Loan Mortgage Corporation’s 30-year fixed-rate elevated further to a 20-year high at 6.9 percent. This rate surpassed all historical rates during 2007 and 2009.

Rapidly rising mortgage rates diminished purchasing power and sidelined many prospective buyers. According to the Mortgage Bankers Association, mortgage applications for new-home purchases plummeted more than one fourth from year-ago levels, and the national median payment rose 3.7 percent to $2,012 in October. According to a Wall Street Journal analysis, some buyers have had to dodge the conventional way of borrowing from traditional lenders and instead borrow directly from family members or leverage either business or personal assets.

The Texas Repeat Sales Home Price Index, which accounts for compositional price effects, corroborated the trend of mixed responses in major metros, with Fort Worth falling 1 percent MOM and San Antonio rising 0.3 percent MOM. On the year-to-year levels, the annual appreciation ranged from 3.7 percent to 10.8 percent, with Austin growing the least and Dallas leading the pack.

Household Pulse Survey

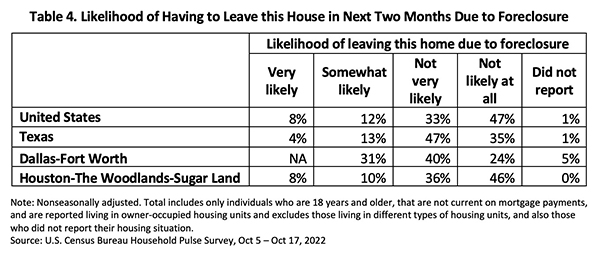
The U.S. Census Bureau’s Household Pulse Survey indicates that despite rapidly rising mortgage rates, the share of Texas homeowners behind on their mortgage payments stayed at 4 percent as in September (Table 3), on par with the national level. This implies that while the outlook on the overall housing market dimmed, homeowners’ financial health remained healthy. Texas owners especially bolstered their housing status, as the owned free/clear homes rose 4 percentage points above the national average. Fewer Texas homeowners reported the possibility of foreclosure on average as the proportion of delinquent individuals at risk of foreclosure dropped to 4 percent (Table 4). These numbers suggested many prospective homebuyers, who were initially not confident about their financial stability, may have opted out of buying a house during this period.

_________________

1 All measurements are calculated using seasonally adjusted data, and percentage changes are calculated month over month, unless stated otherwise.

2 Bond and mortgage interest rates are nonseasonally adjusted. Loan-to-value ratios, debt-to-income ratios, and the credit score component are also nonseasonally adjusted.

Source – Joshua Roberson, Weiling Yan, and John Shaunfield (December 7, 2022)

https://www.recenter.tamu.edu/articles/technical-report/Texas-Housing-Insight
Slide1

October 2022 DFW Area Real Estate Stats

October 2022 Stats are IN!

In Collin and Denton counties, all arrows are pointing up in the areas of new listings and active listings with active listing seeing an increase of over 100% in both counties compared to last year. It will come as no surprise that the average days on market has also increased in these counties over last year’s market. What we are all seeing in the news is reflected in the number of sales in October which has declined between 25 and 30%.
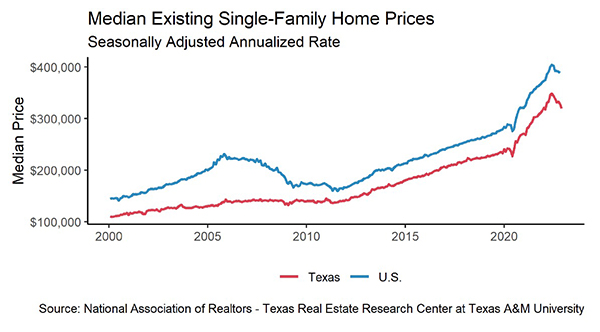
In Dallas and Tarrant counties, we are seeing similar trends, however, new listings are down by about 10% in both counties. Active listings are down 39% in Dallas County and up 82% in Tarrant County. Average sales prices are up 16.7% in Dallas and 14.2% in Tarrant. Again, the number of sales is down by approximately 30% in both of these counties.

Our stats infographics include a year over year comparison and area highlights for single family homes broken down by county. We encourage you to share these infographics and video with your sphere.

For more stats information, pdfs and graphics of our stats including detailed information by county, visit the Resources section on our website at DFW Area Real Estate Statistics | Republic Title of Texas.

For the full report from the Texas A&M Real Estate Research Center, click here. For NTREIS County reports click here.