
Since the Federal Reserve announced the first 75-basis-point increase in June of this year, the housing market has retreated with both demand and supply slowing down. Home sales were down 7.4 percent over the previous month, and housing starts for apartments doubled in a year as investors adapted their strategies from selling single-family homes to renting out apartments. As the Fed continues its aggressive inflation policies, mortgage rates will not drop until inflation is curbed. Home prices have been depreciating, and Austin—the metro that inflated the most during 2021—saw the largest depreciation amid the market’s abrupt slowdown.
Supply1
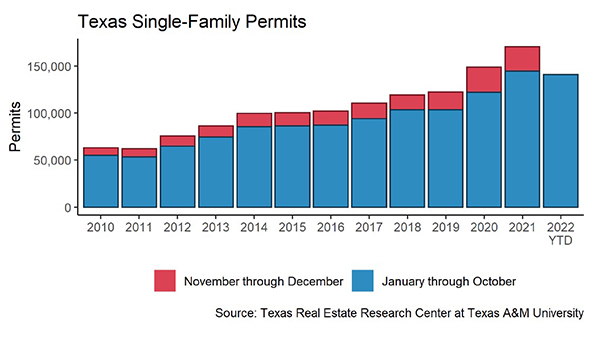
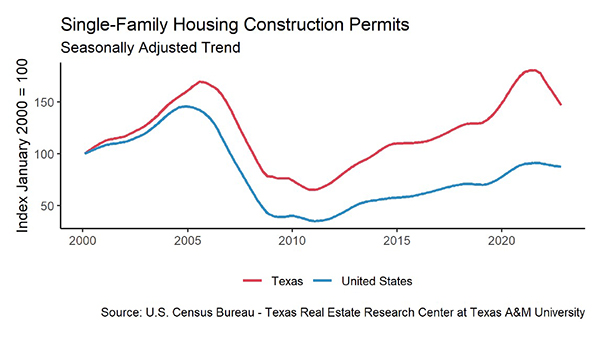
Texas’ single-family construction permits dropped below 10,000 units for the first time in two years. Despite slowing housing activities, Texas remained most active at authorizing construction projects, surpassing No. 2 Florida by one additional permit for every nine permits. Construction permits fell in all major metros except Houston. Dallas (2,545 permits) contracted by more than 700 permits in the past month, falling to a three-year low, while demand in Houston (3,226) stayed steady. As usual, Austin (1,380) was building homes twice as fast as San Antonio (629). Contrary to the weakened single-family sector, permits for Texas’ multifamily sector grew robustly. The number of issuances both for 2-4 family homes and apartments doubled from the year before.
The lumber producer price index (PPI) fell four times in the past six months, and the input cost had slid 17.6 percent since the year started. Since June’s interest rate rise, the South’s total housing starts plummeted quickly. However, this measure of new-home construction jumped to its highest level since bottoming out in June to 808,000 units in October, as housing starts inched up 6.7 percent month over month (MOM). Growth was driven largely by multi-unit construction permits while single-family units continued to stall.
While new homebuilding projects are slowing, the state’s current supplies have been accumulating. Active listings grew 6.6 percent MOM to a seasonally adjusted rate of 89,800 units. Compared with March’s inventory of 41,800 units, the metric has doubled, and the state has nearly recovered to the pre-pandemic level. Accordingly, Texas’ months of inventory (MOI) ticked up to 2.7 MOI. San Antonio led the pack with three MOI, followed closely by Austin. Dallas remained the tightest with 2.3 MOI. This trend suggests a cooler housing market, considering the conspicuously low inventories in the past two years.
Demand
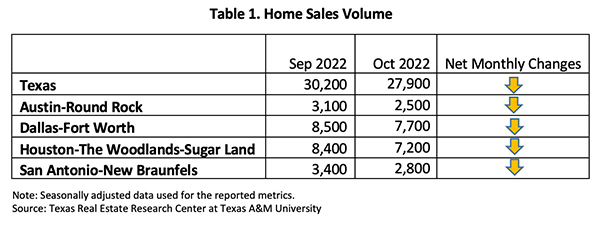
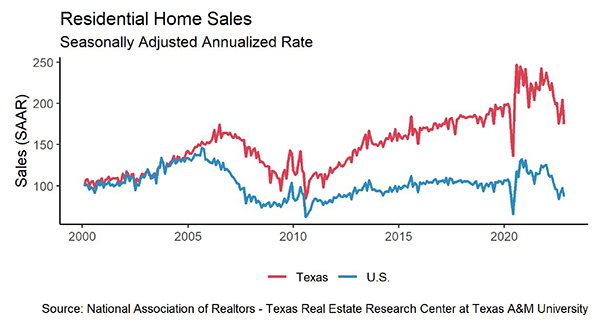
Total home sales diminished 7.4 percent MOM, settling at a seasonally adjusted rate of 27,900 closed listings (Table 1). Texas’ four Metropolitan Statistical Areas (MSA) all mirrored the statewide trend, as sales in each metro shrank by double digits YOY. The rapid decline in housing sales has revealed how important low mortgage rates are to the latest housing frenzy. According to Texas Realtors’ Data Relevance Project, October sales were down 21 percent from a year earlier. At the current rate, year-end 2022 sales will likely fall short of 2021.
Amid this plunge in demand, the remaining buyers prefer new homes to existing homes. When sales were differentiated by the existing-home market and the new-construction market, the state’s cumulative sales volume plummeted 8.8 percent YTD in the former sector, while the same metric jumped 9.2 percent in the latter sector. The sales disparity was even more pronounced in Austin.
Closed listings for homes priced below $300K fell below 10,000 transactions for the first time in a decade, falling close to 50 percent compared with February 2020. This is partially due to the fallen overall demand but more because of the rapid appreciation brought by the housing frenzy. Due to the rapidly rising price, the market share for home sales in this price cohort fell from 84 percent to 39 percent in the past ten years.
Homes are sitting on the market longer as a result of slowing sales. Texas’ average days on market (DOM) balanced at 42 days. DOM ranged from 37 days in Dallas to 47 days in San Antonio. Despite the prolonged waiting time, compared with the five-year average of 59 days before 2020, the relatively short period suggests the housing market is still relatively tight compared with historic norms.
Additionally, in February 2020 DOM ranged from 55 days to 83 days respectively for homes in the median price cohort and in the higher-end tail. In September 2022, the DOM interval was 43 to 44 days. The truncated DOM interval both in terms of value and difference of the two price cohorts implies the housing market still has ample room to fully return to the normal level.
Prices
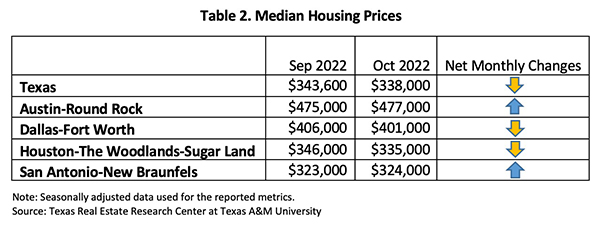
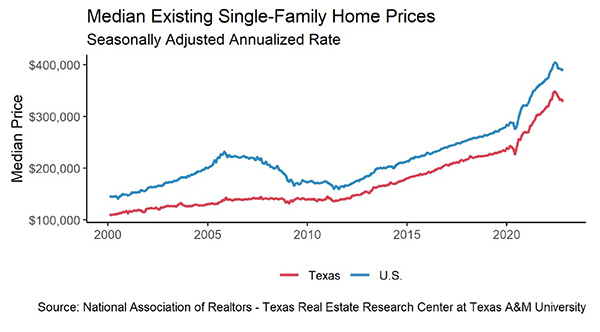
After a mild moderation in September, Texas’ median home price continued to decline. The state’s seasonally adjusted median price edged down to $338,000, decreasing 1.6 percent MOM. The four major metros posted mixed monthly changes (Table 2). Regardless of the recent depreciation, prices in these MSAs remained higher than their year-ago levels, with the lowest growth in Austin at 4.8 percent and highest in Dallas at 11.1 percent.
As the Federal Reserve imposed forceful monetary policies to curb inflation, the ten-year U.S. Treasury bond yield jumped to 3.98 percent2, while the two-year counterpart surged by a similar amount. The spread difference between the ten-year and two-year bond yields widened slightly while staying in negative territory, indicating persistent market uncertainties. The Federal Home Loan Mortgage Corporation’s 30-year fixed-rate elevated further to a 20-year high at 6.9 percent. This rate surpassed all historical rates during 2007 and 2009.
Rapidly rising mortgage rates diminished purchasing power and sidelined many prospective buyers. According to the Mortgage Bankers Association, mortgage applications for new-home purchases plummeted more than one fourth from year-ago levels, and the national median payment rose 3.7 percent to $2,012 in October. According to a Wall Street Journal analysis, some buyers have had to dodge the conventional way of borrowing from traditional lenders and instead borrow directly from family members or leverage either business or personal assets.
The Texas Repeat Sales Home Price Index, which accounts for compositional price effects, corroborated the trend of mixed responses in major metros, with Fort Worth falling 1 percent MOM and San Antonio rising 0.3 percent MOM. On the year-to-year levels, the annual appreciation ranged from 3.7 percent to 10.8 percent, with Austin growing the least and Dallas leading the pack.
Household Pulse Survey
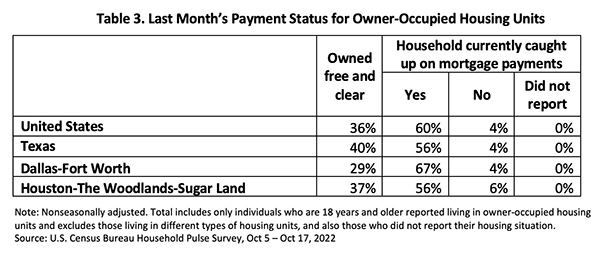
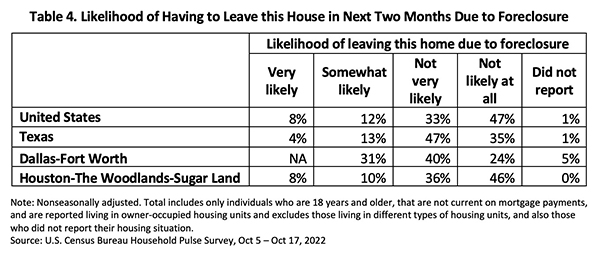
The U.S. Census Bureau’s Household Pulse Survey indicates that despite rapidly rising mortgage rates, the share of Texas homeowners behind on their mortgage payments stayed at 4 percent as in September (Table 3), on par with the national level. This implies that while the outlook on the overall housing market dimmed, homeowners’ financial health remained healthy. Texas owners especially bolstered their housing status, as the owned free/clear homes rose 4 percentage points above the national average. Fewer Texas homeowners reported the possibility of foreclosure on average as the proportion of delinquent individuals at risk of foreclosure dropped to 4 percent (Table 4). These numbers suggested many prospective homebuyers, who were initially not confident about their financial stability, may have opted out of buying a house during this period.
_________________
1 All measurements are calculated using seasonally adjusted data, and percentage changes are calculated month over month, unless stated otherwise.
2 Bond and mortgage interest rates are nonseasonally adjusted. Loan-to-value ratios, debt-to-income ratios, and the credit score component are also nonseasonally adjusted.
Source – Joshua Roberson, Weiling Yan, and John Shaunfield (December 7, 2022)
https://www.recenter.tamu.edu/articles/technical-report/Texas-Housing-Insight