In July 2024, the real estate market in the DFW Metroplex displayed varied trends across different counties. Overall, the DFW Metroplex saw a mix of rising listing activity and extended market times, with some counties experiencing price growth while others faced slight declines in sales.
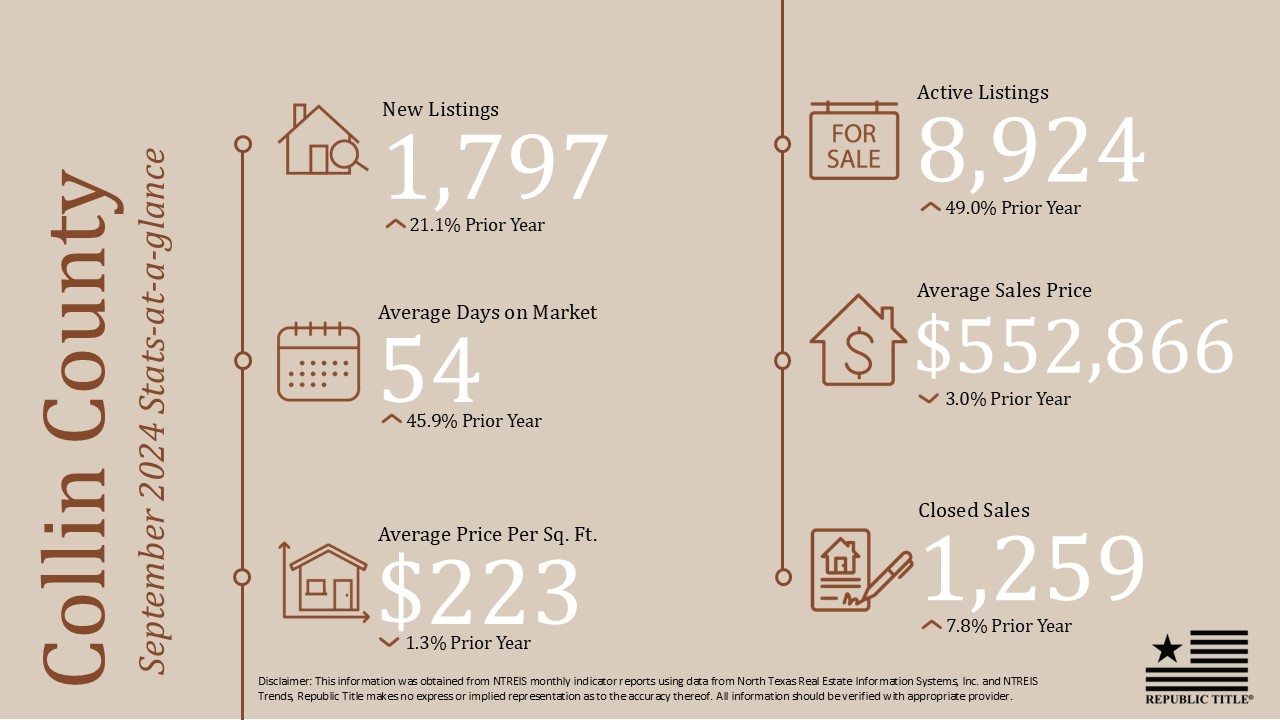
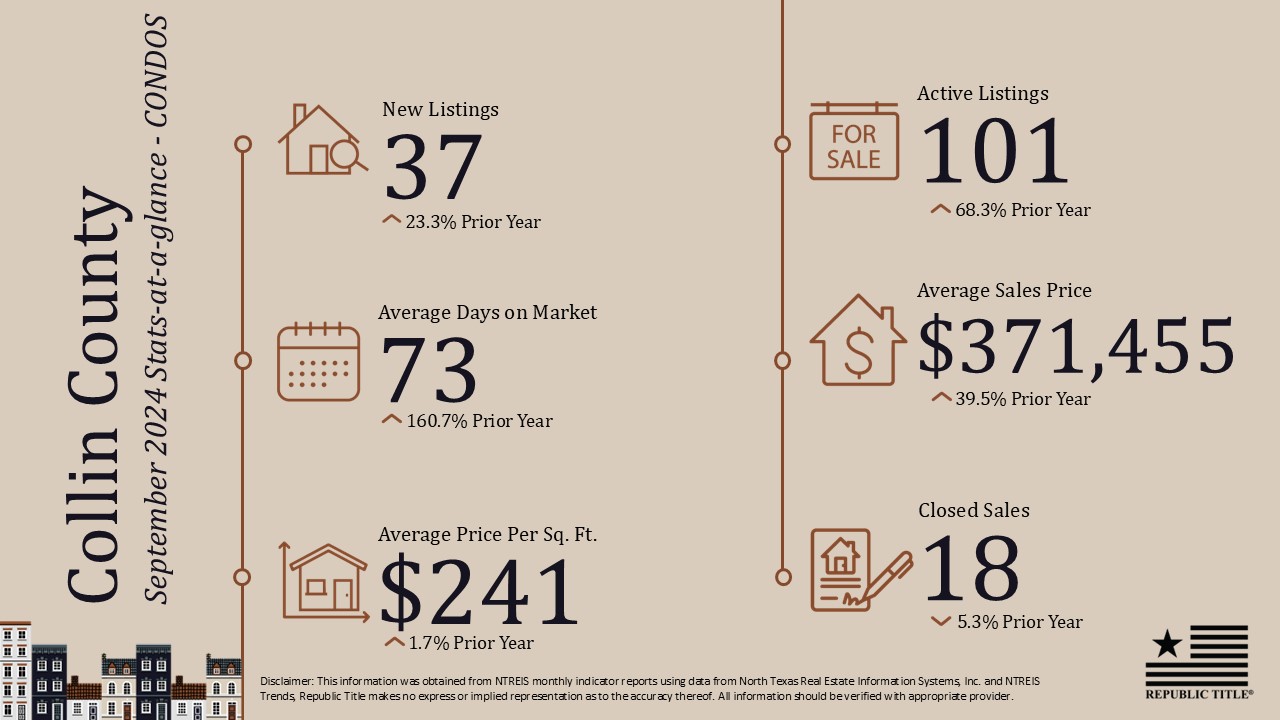
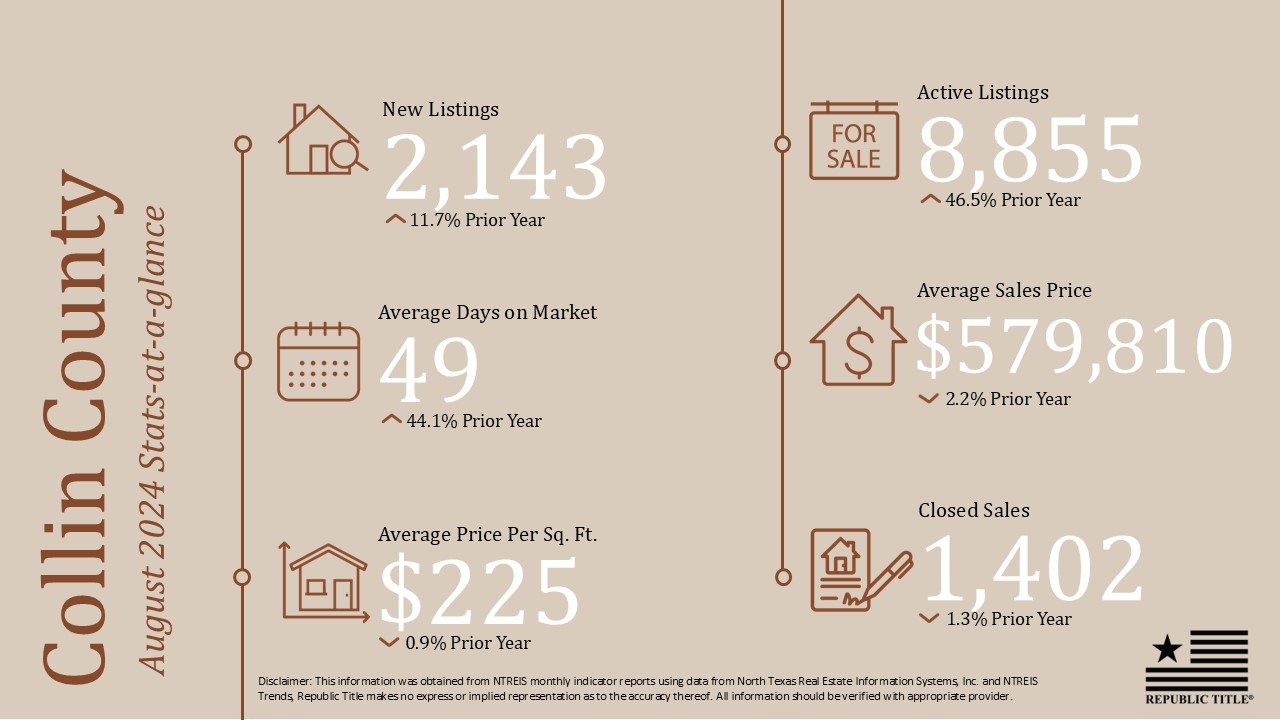
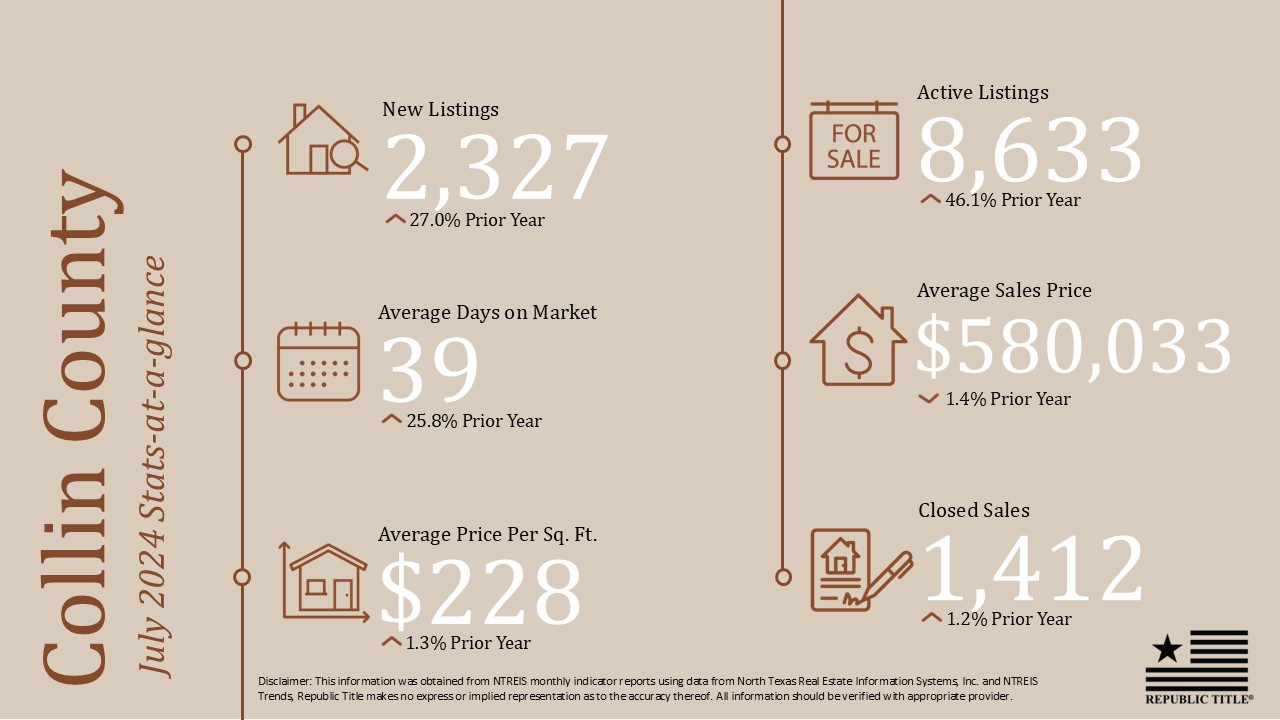
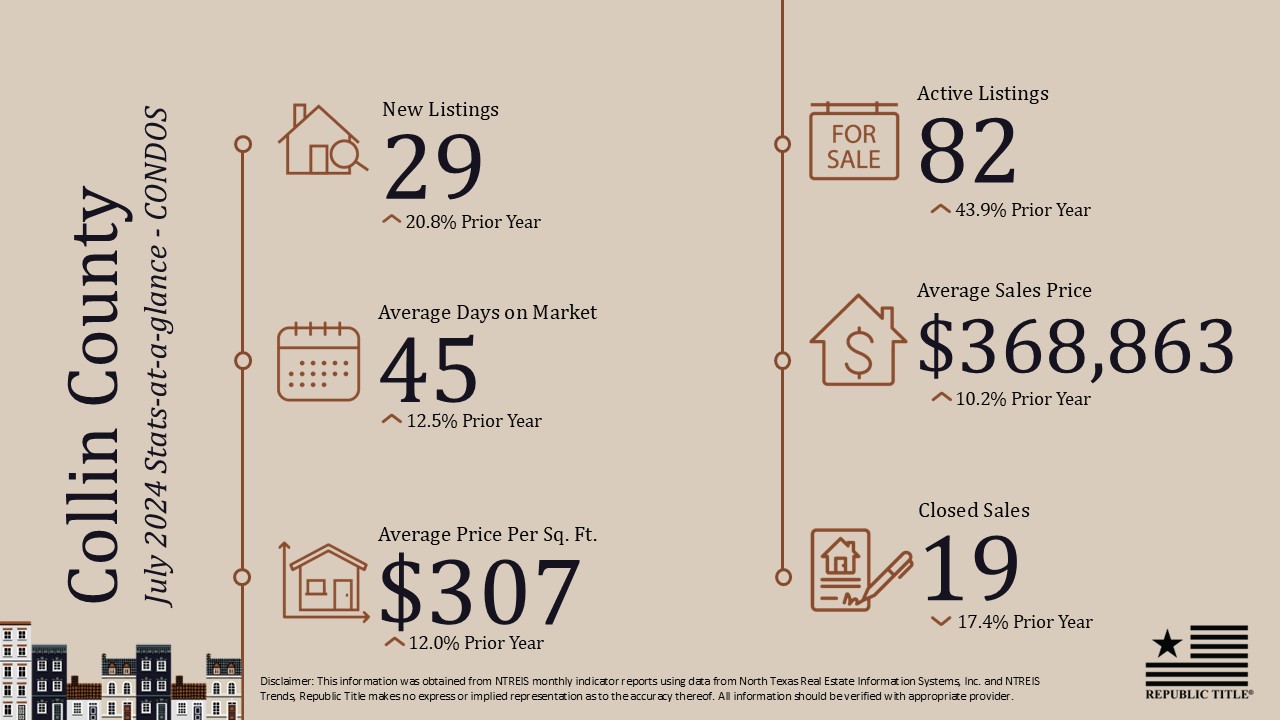
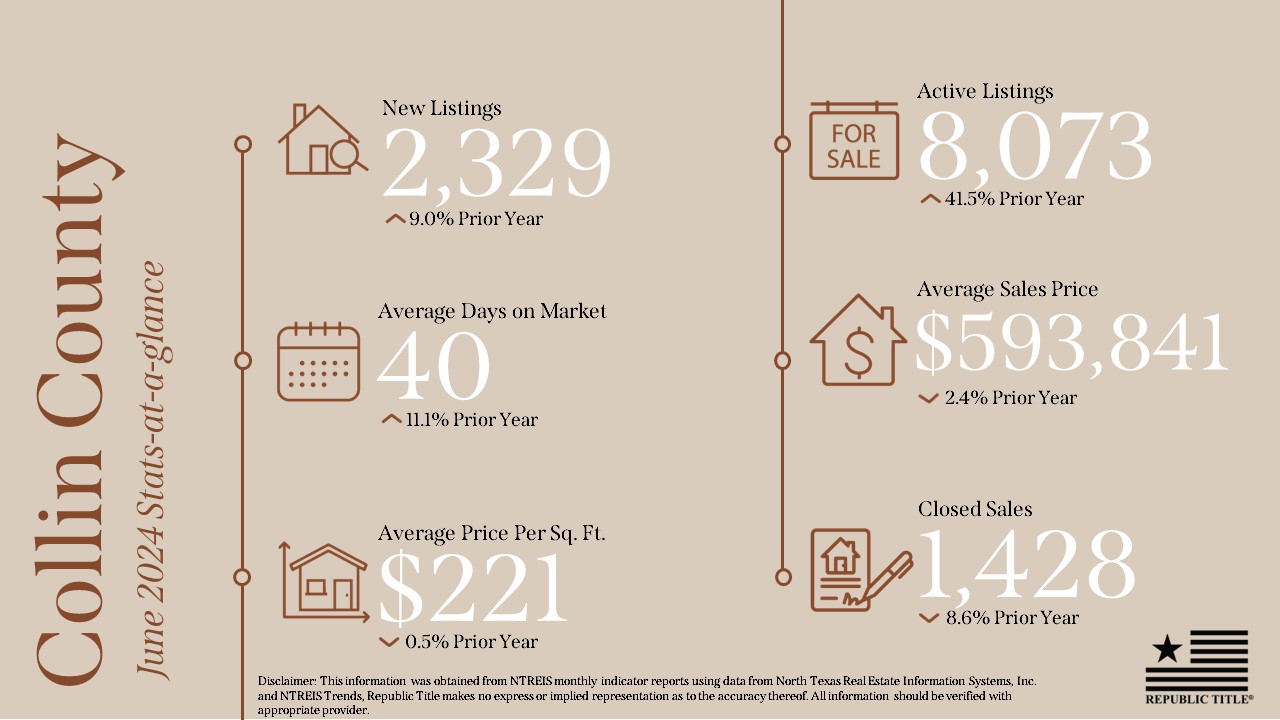
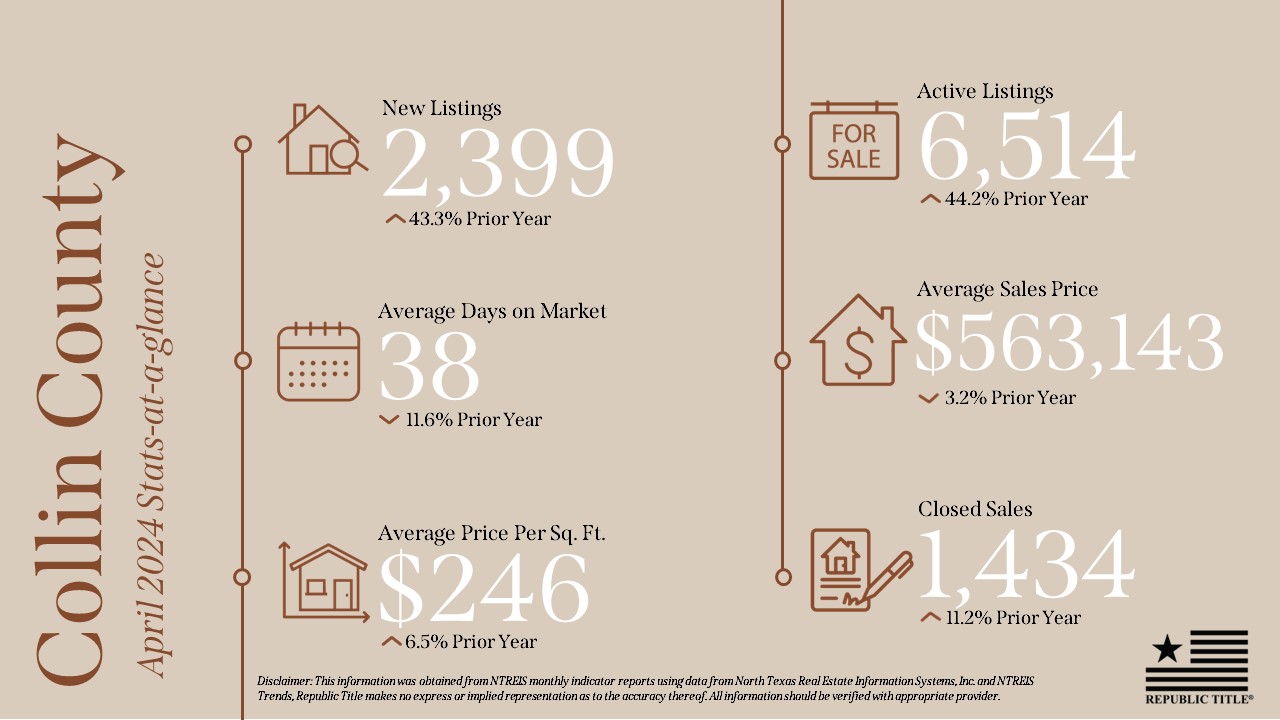
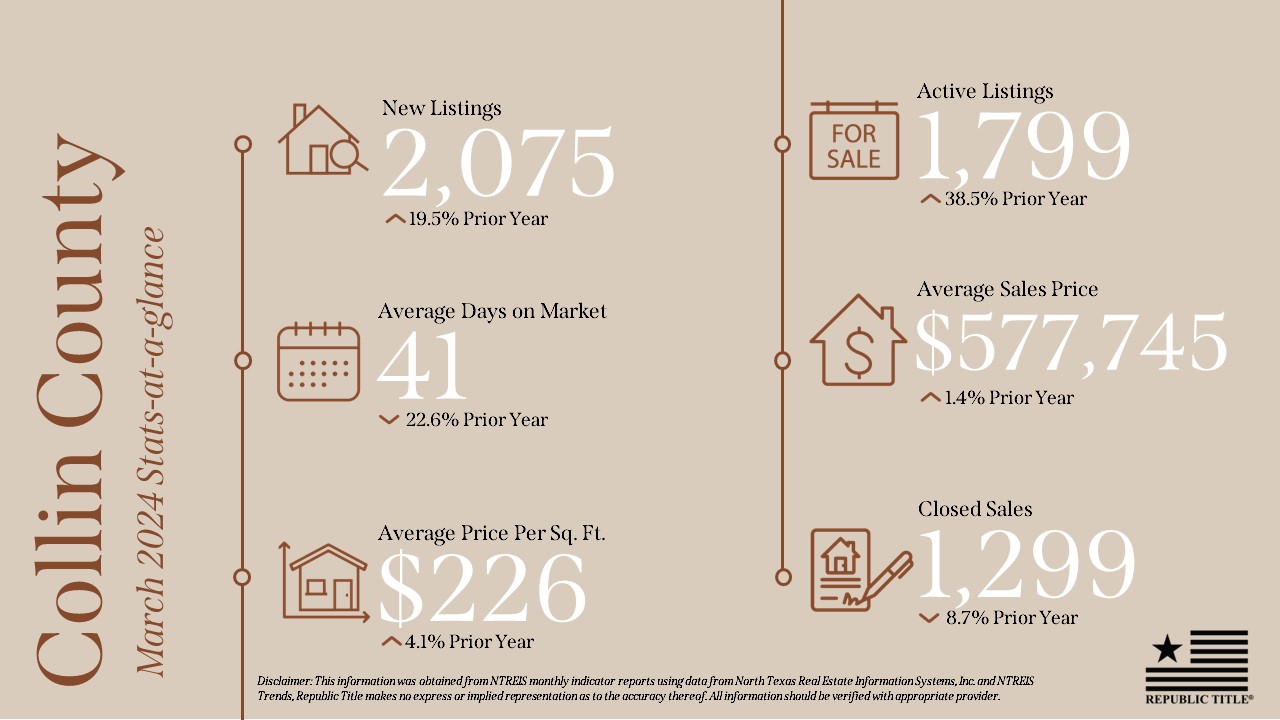
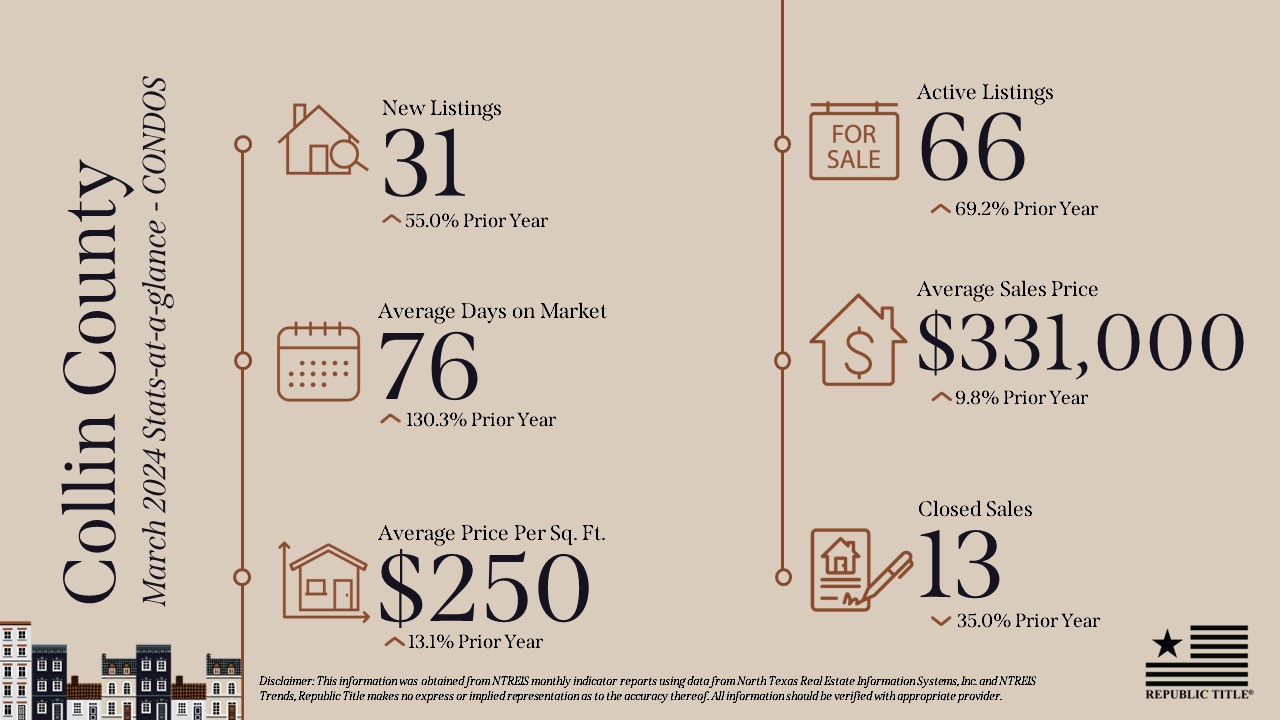
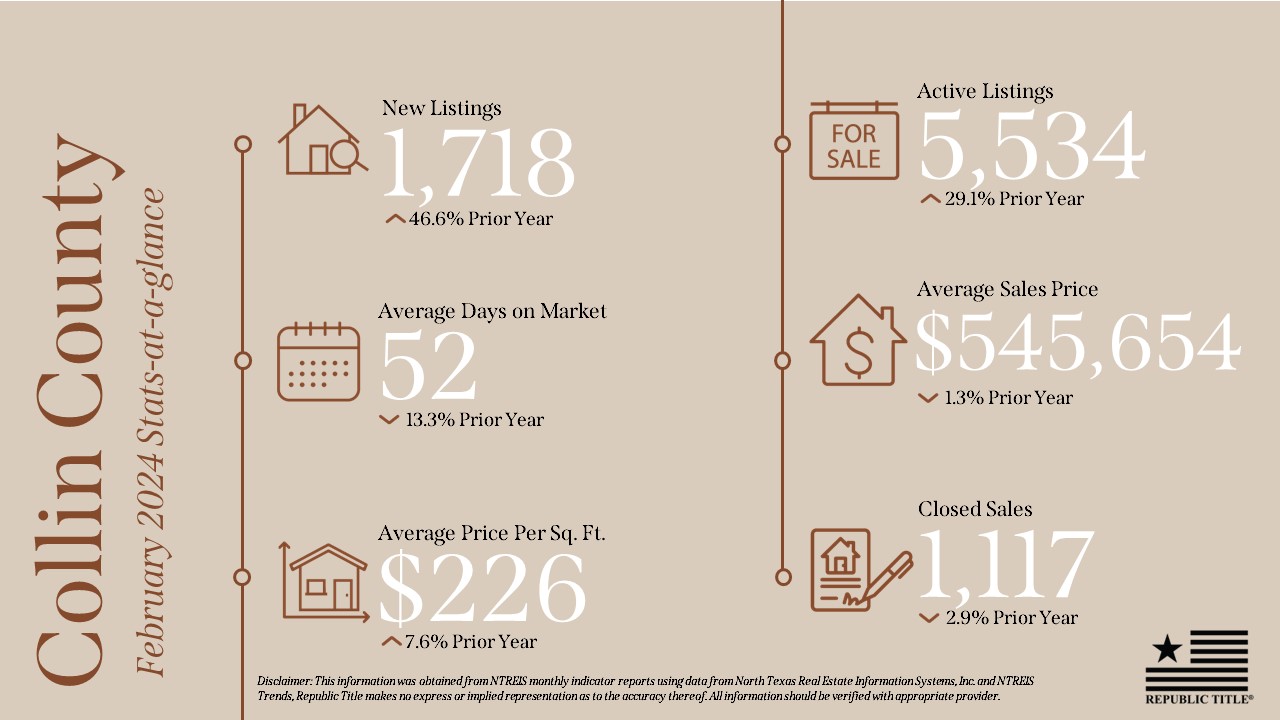
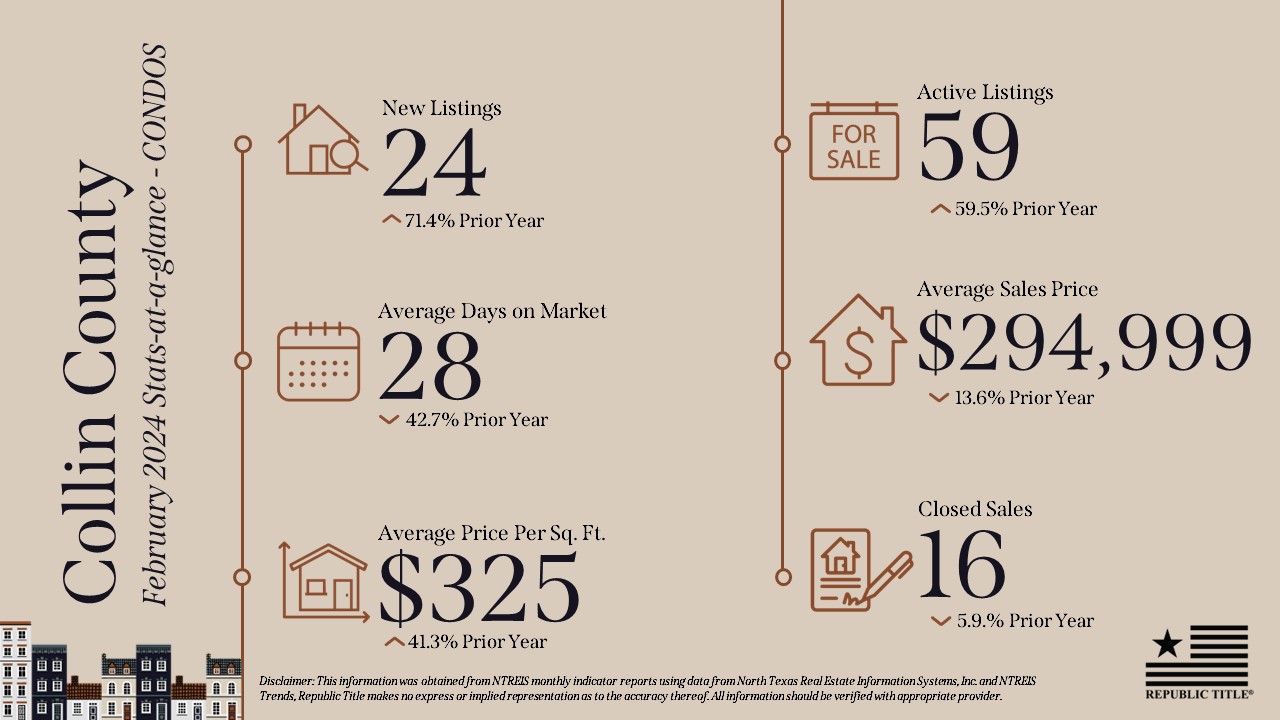
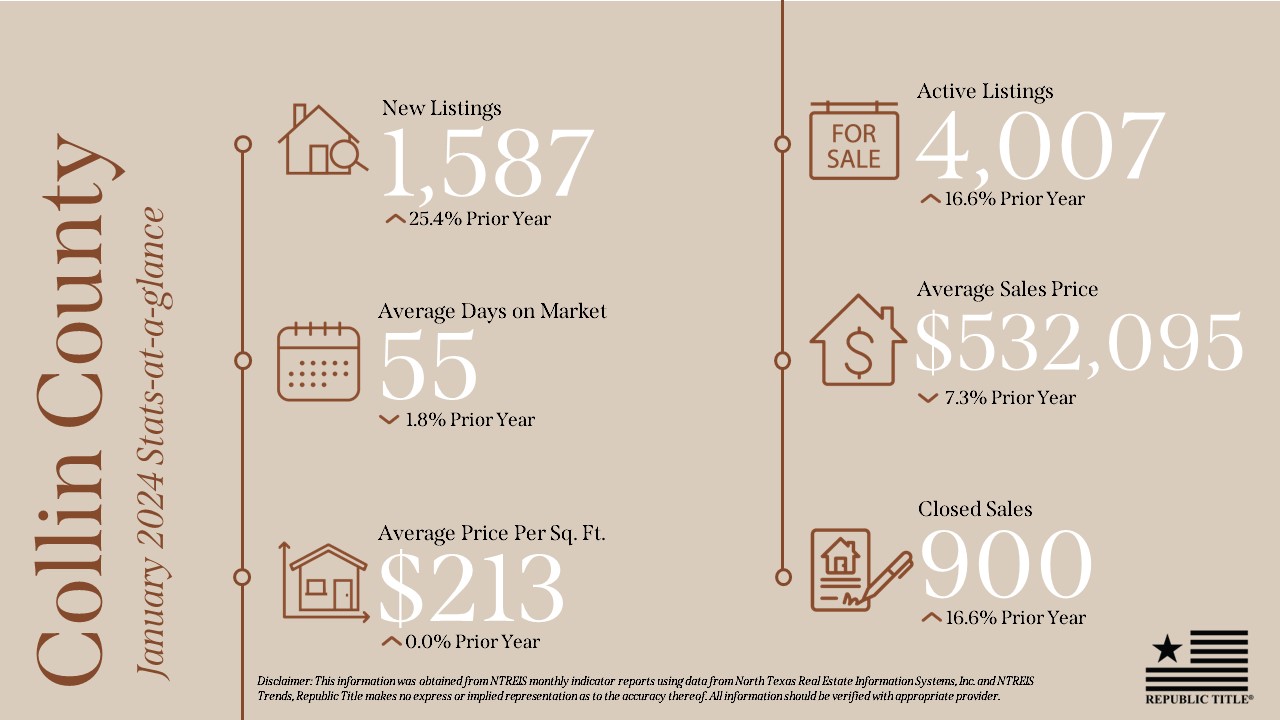
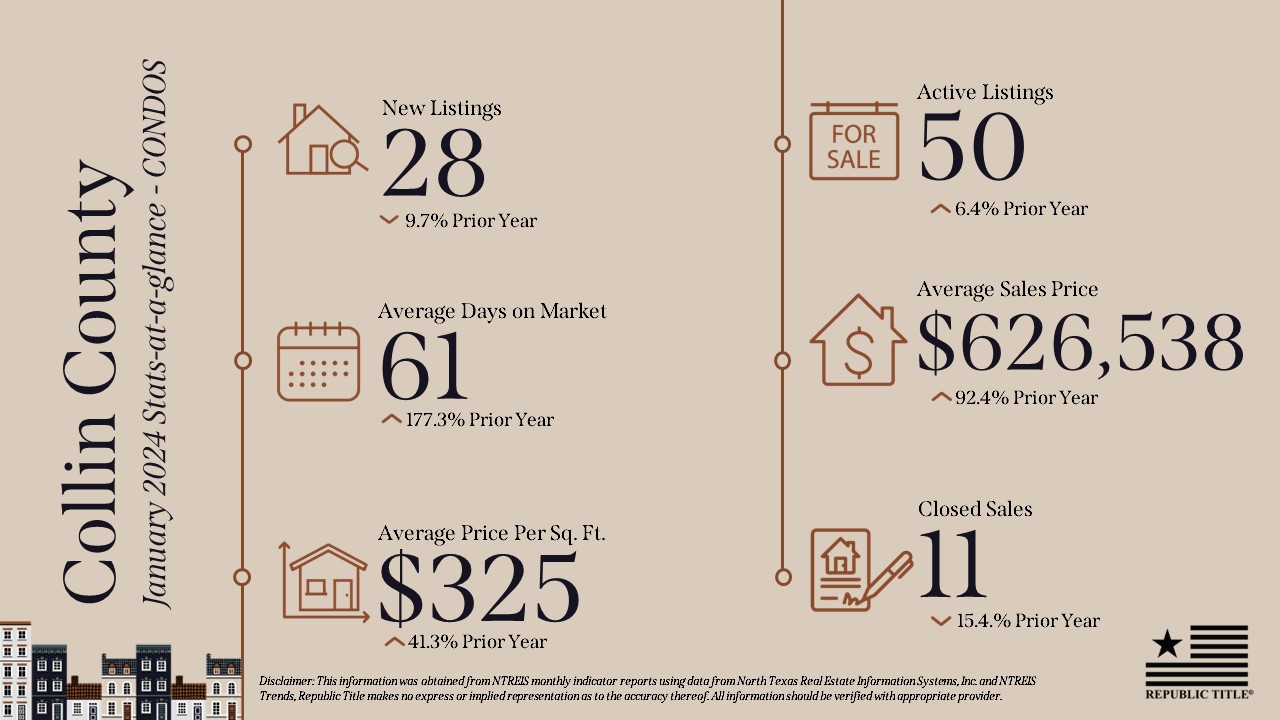
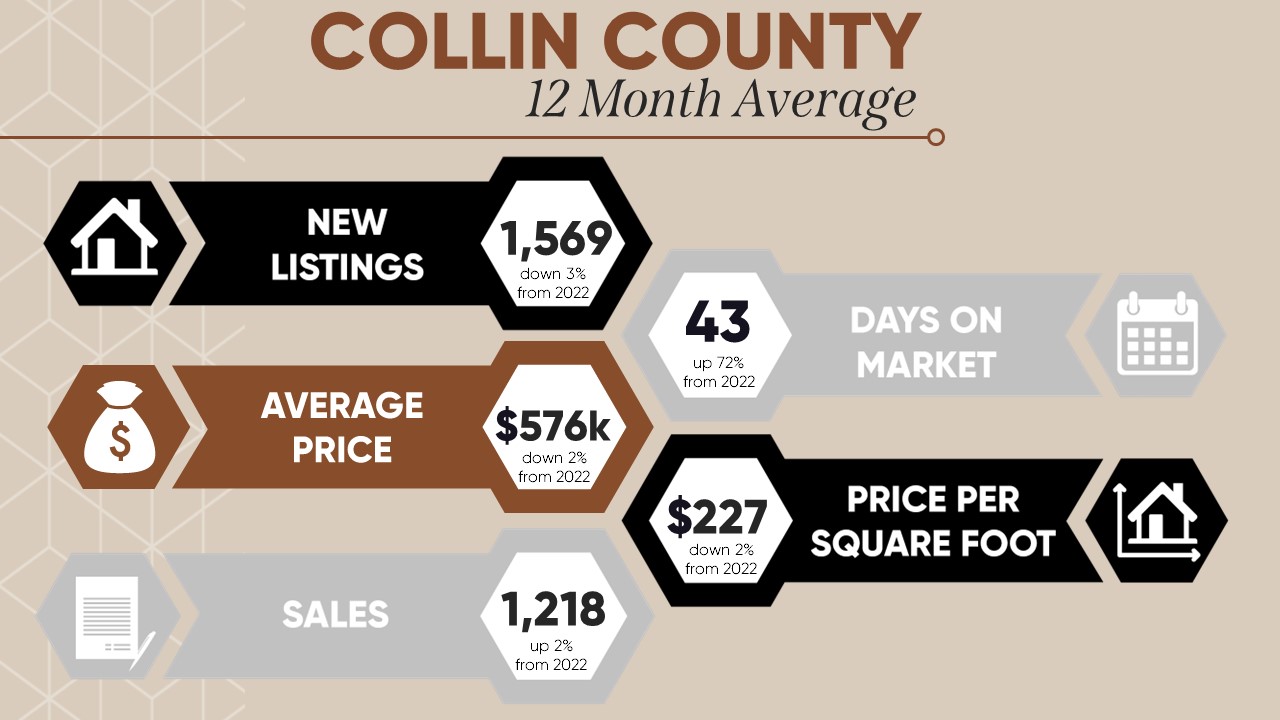
Collin County saw significant activity, with new listings increasing by 27% and active listings surging by 46.1%. The days on market (DOM) rose to 39 days, marking a 25% increase from the prior year. The average sales price was approximately $580K, slightly down by 1.4%, while the average price per square foot rose by 1.3% to $228. Closed sales increased marginally by 1.2%, reaching 1,452 units.
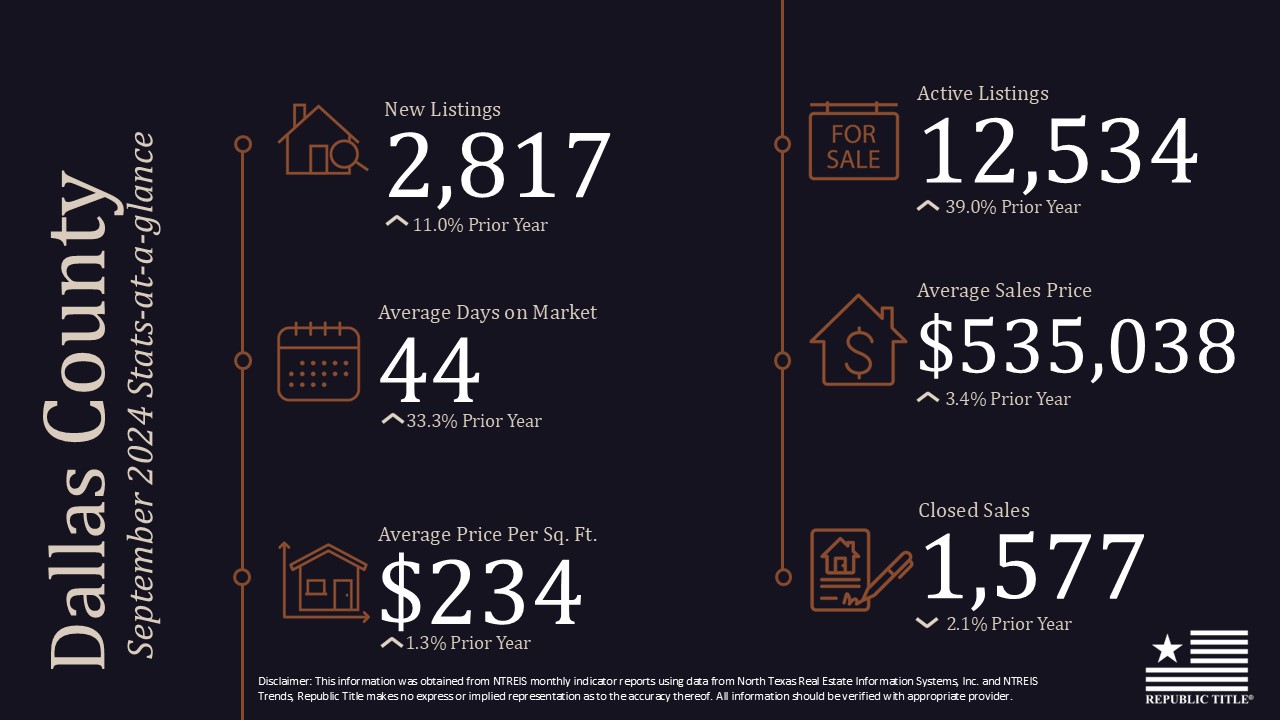
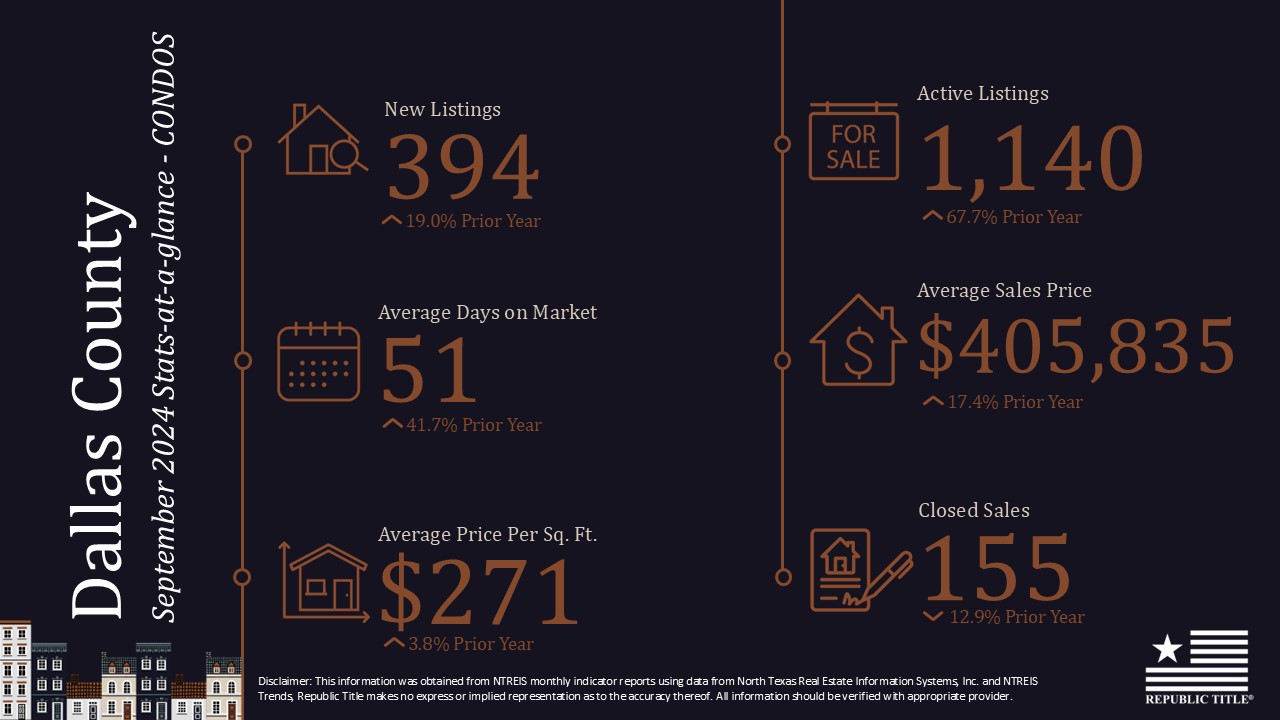
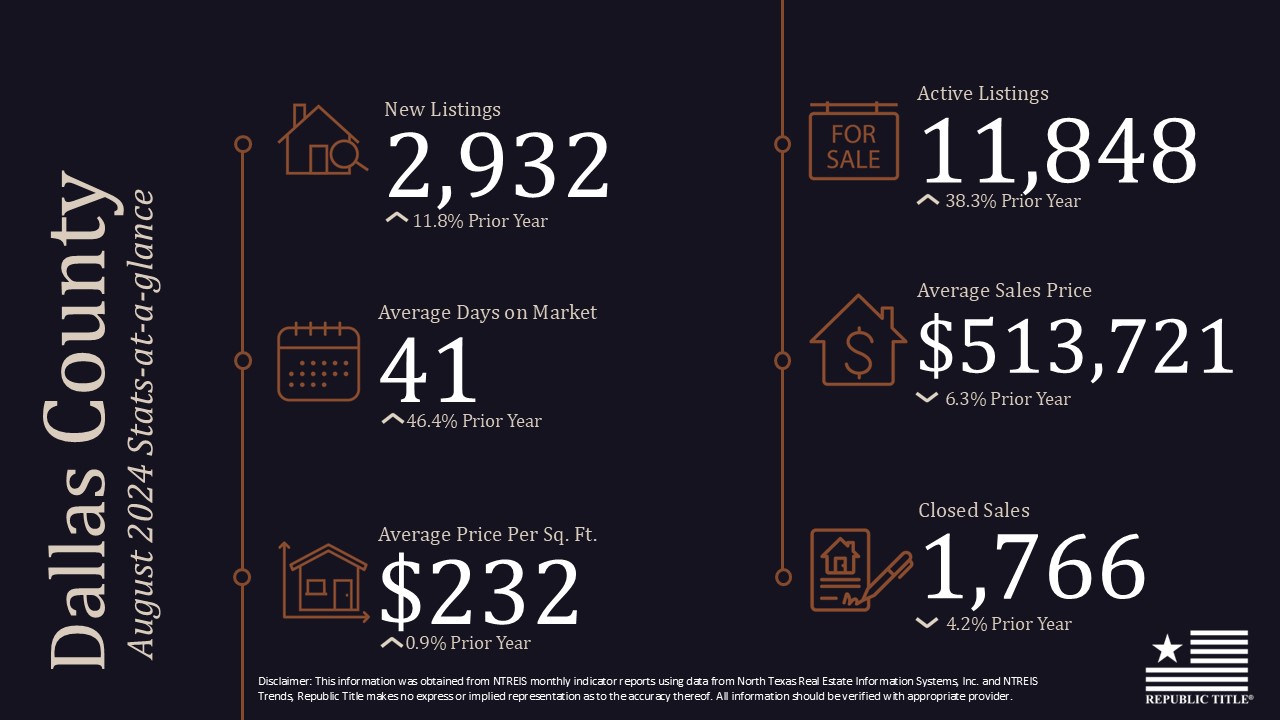
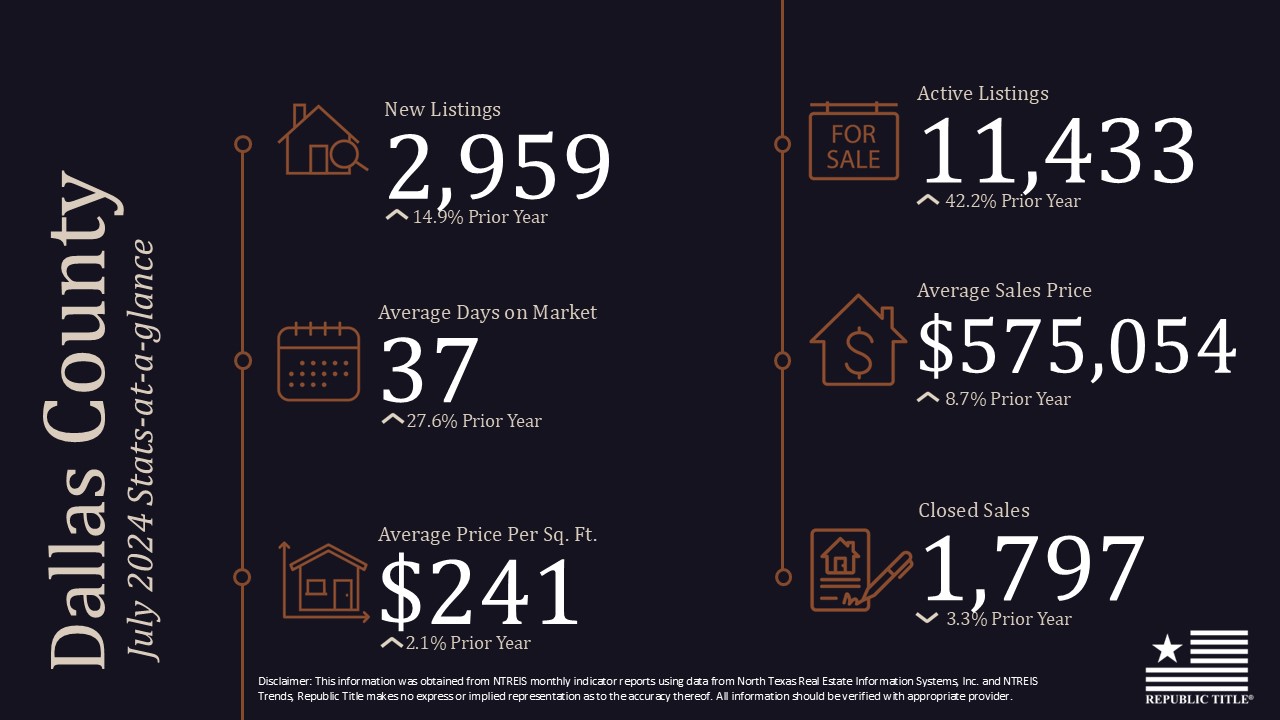
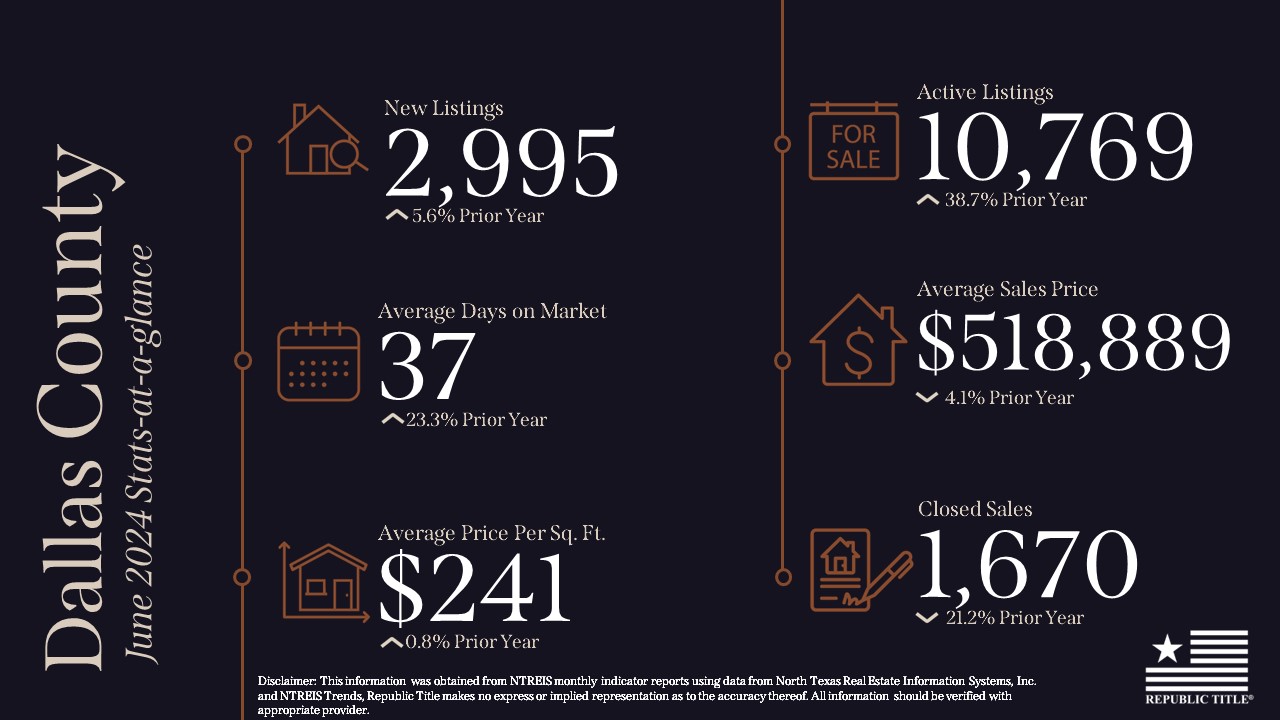
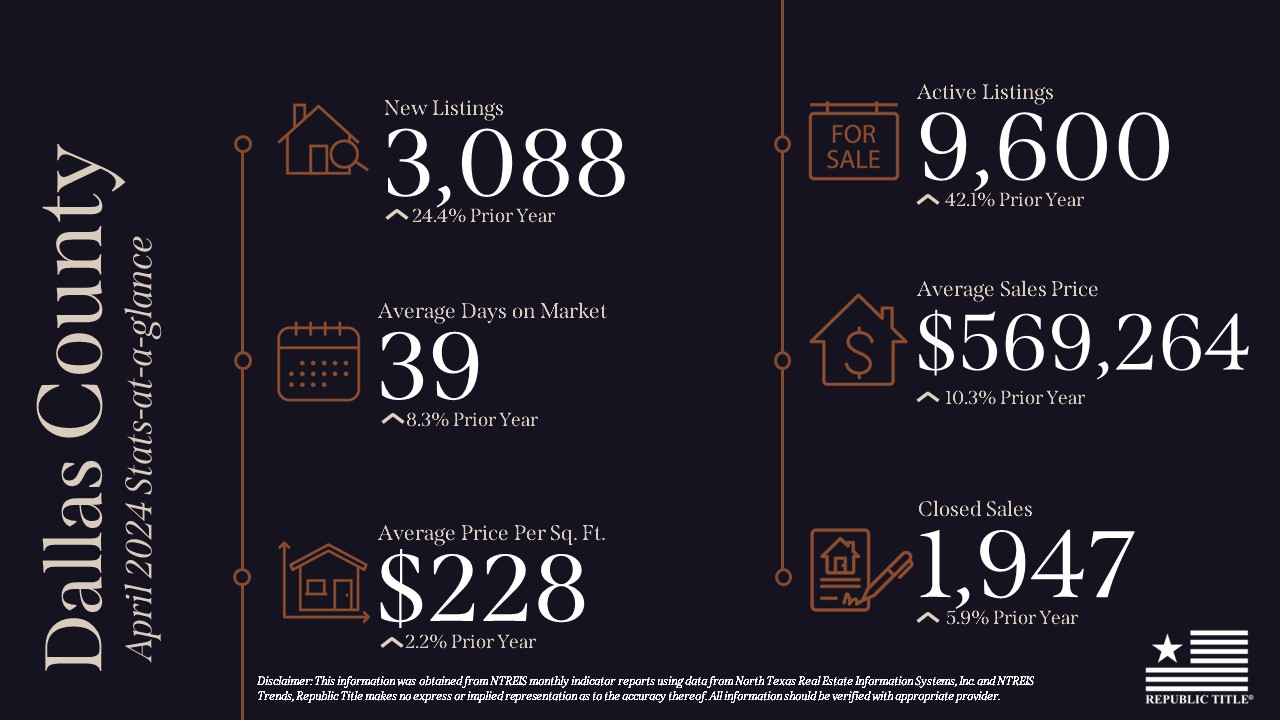
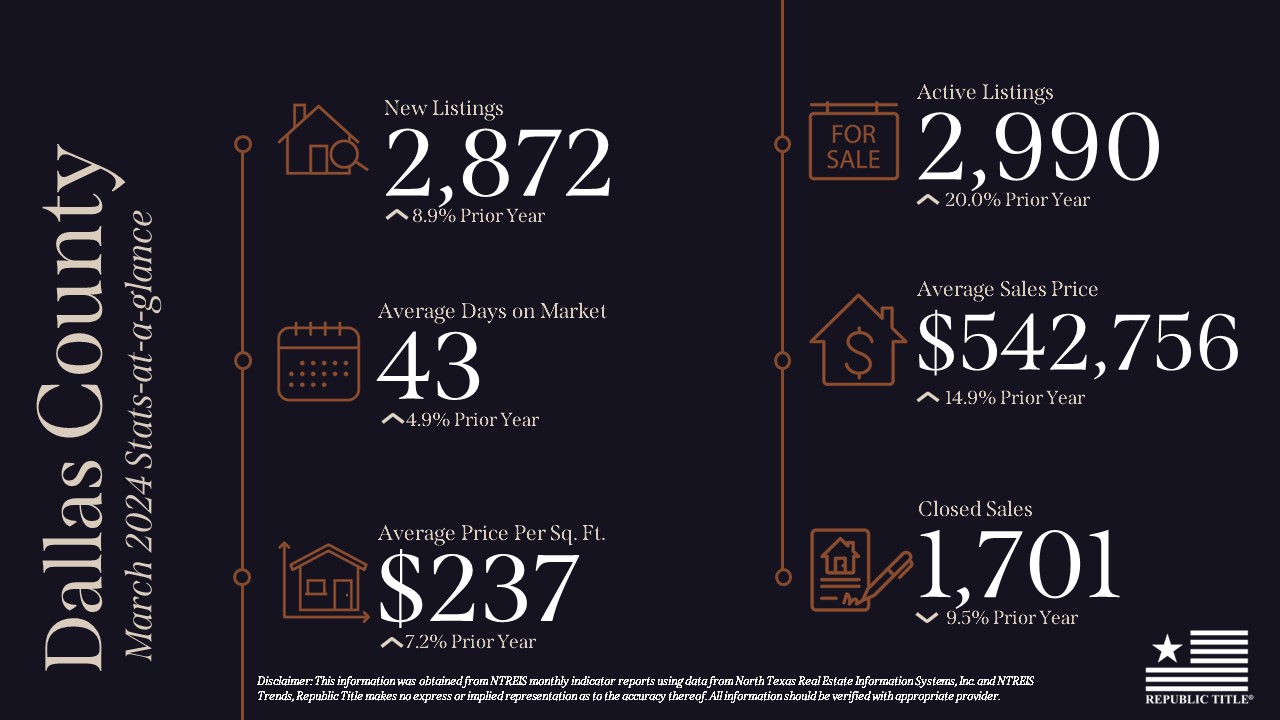
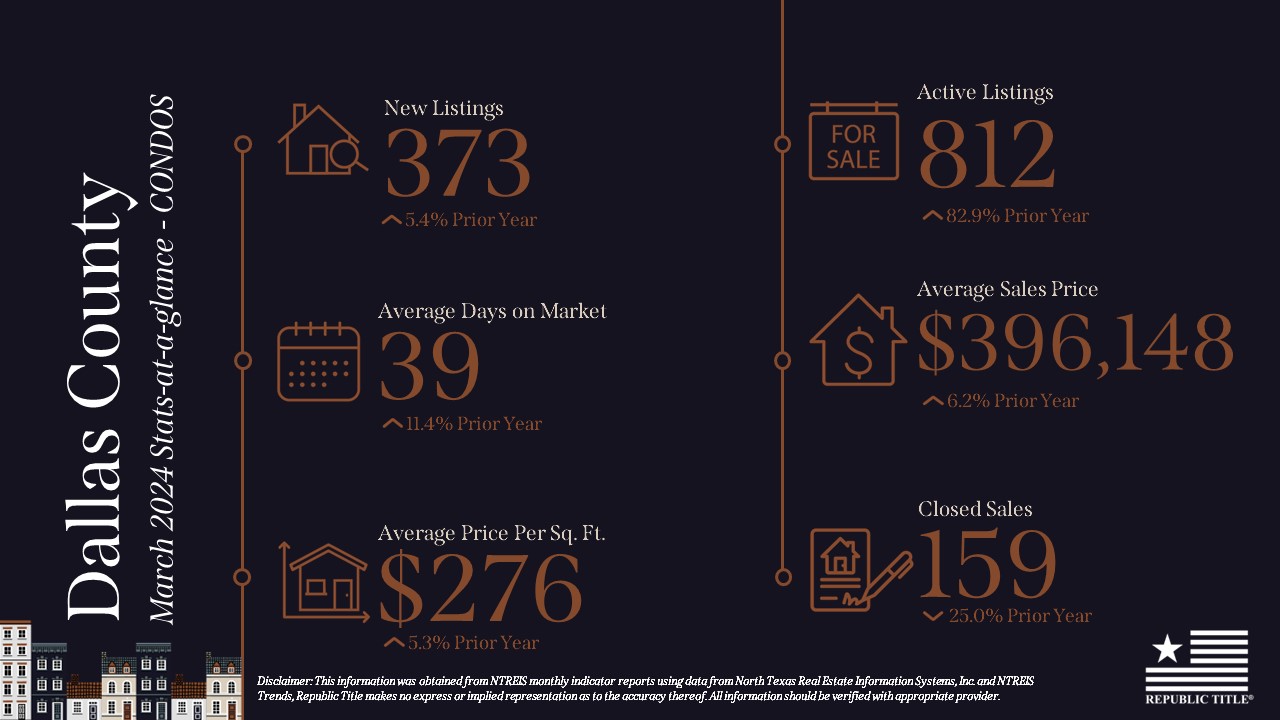
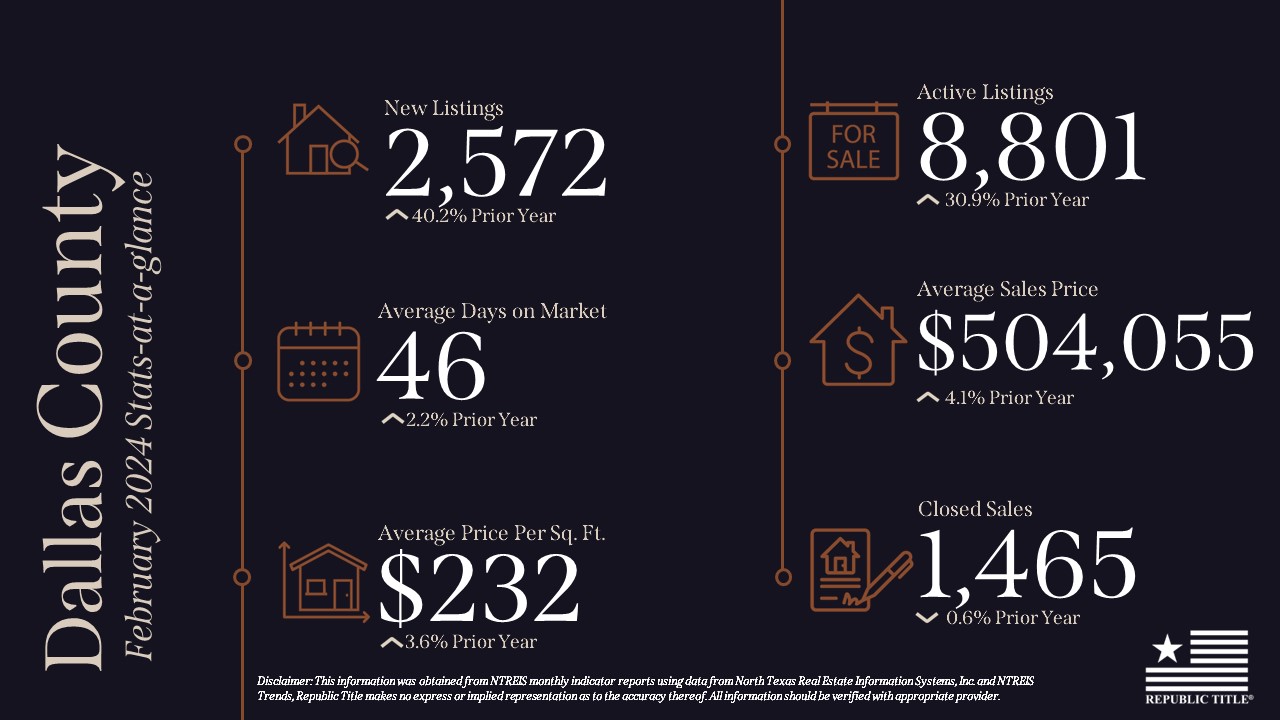
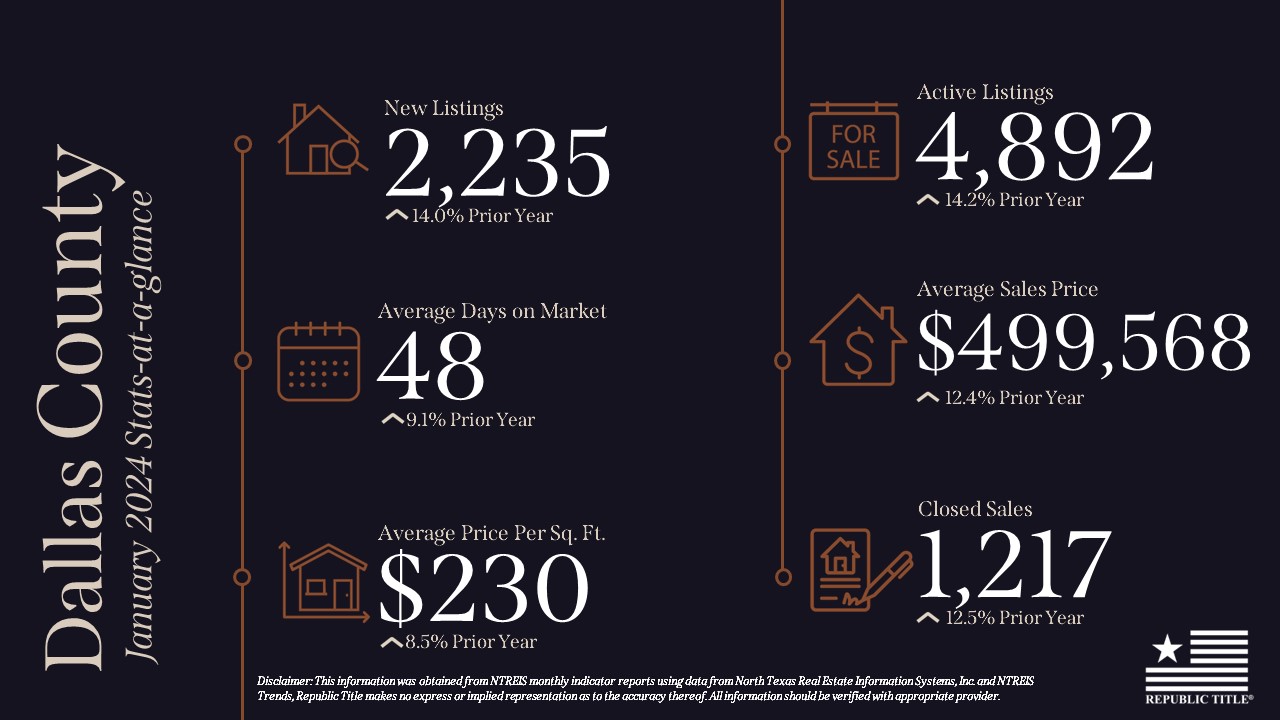
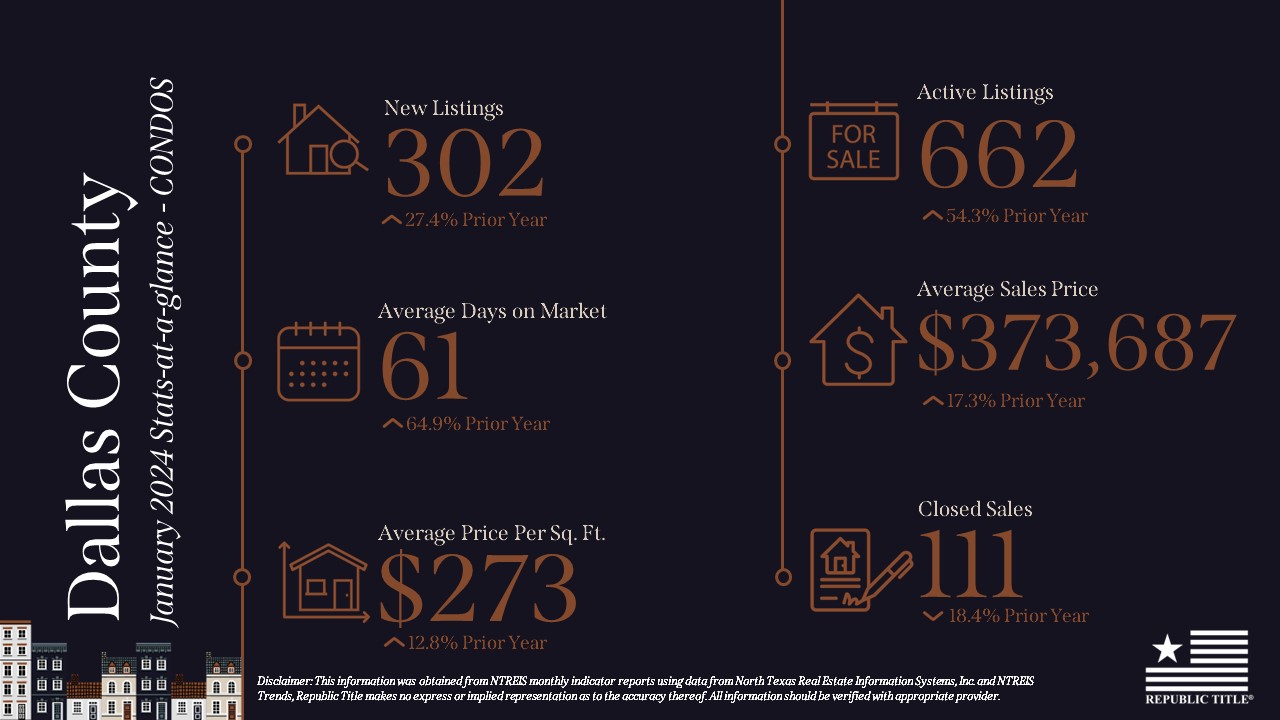
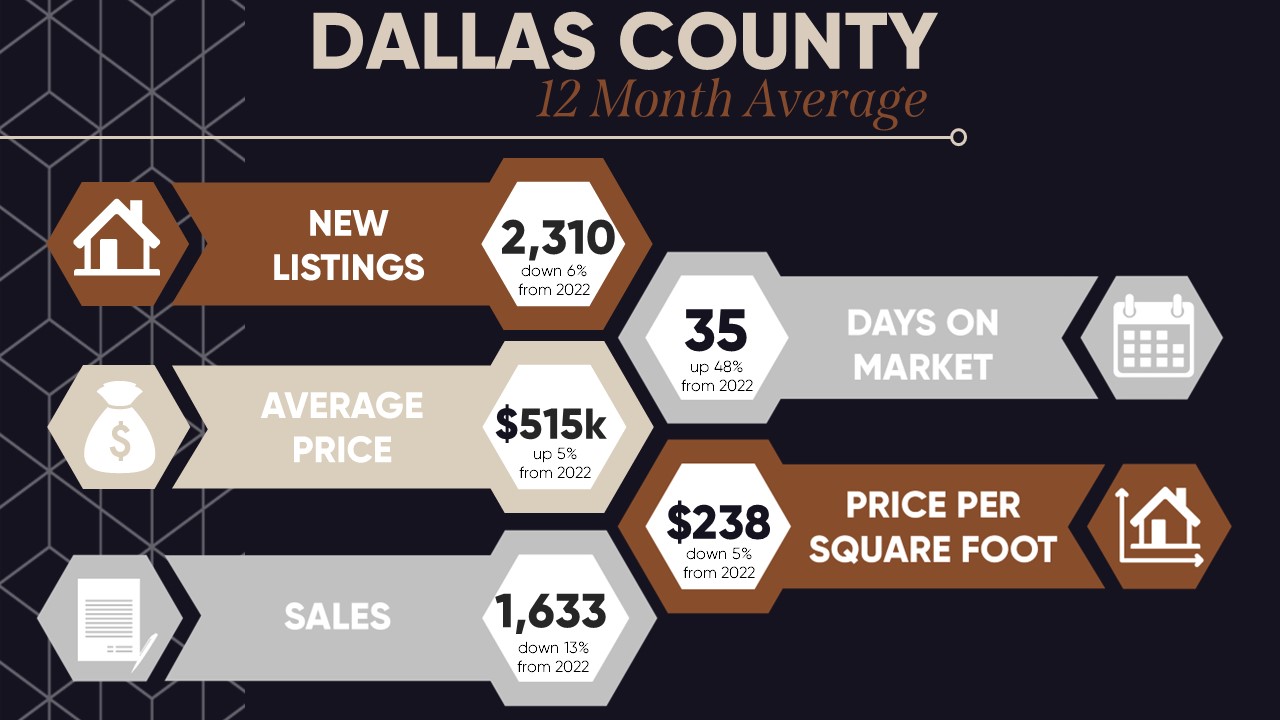
In Dallas County, new listings grew by 14.9%, and active listings by 42.2%. The DOM increased to 37 days, up over 27% from the previous year. The average sales price rose by 8.7% to $575K, with the price per square foot also seeing a rise of 2.1% to $241. However, closed sales declined by 3.3%, totaling 1,797 units.
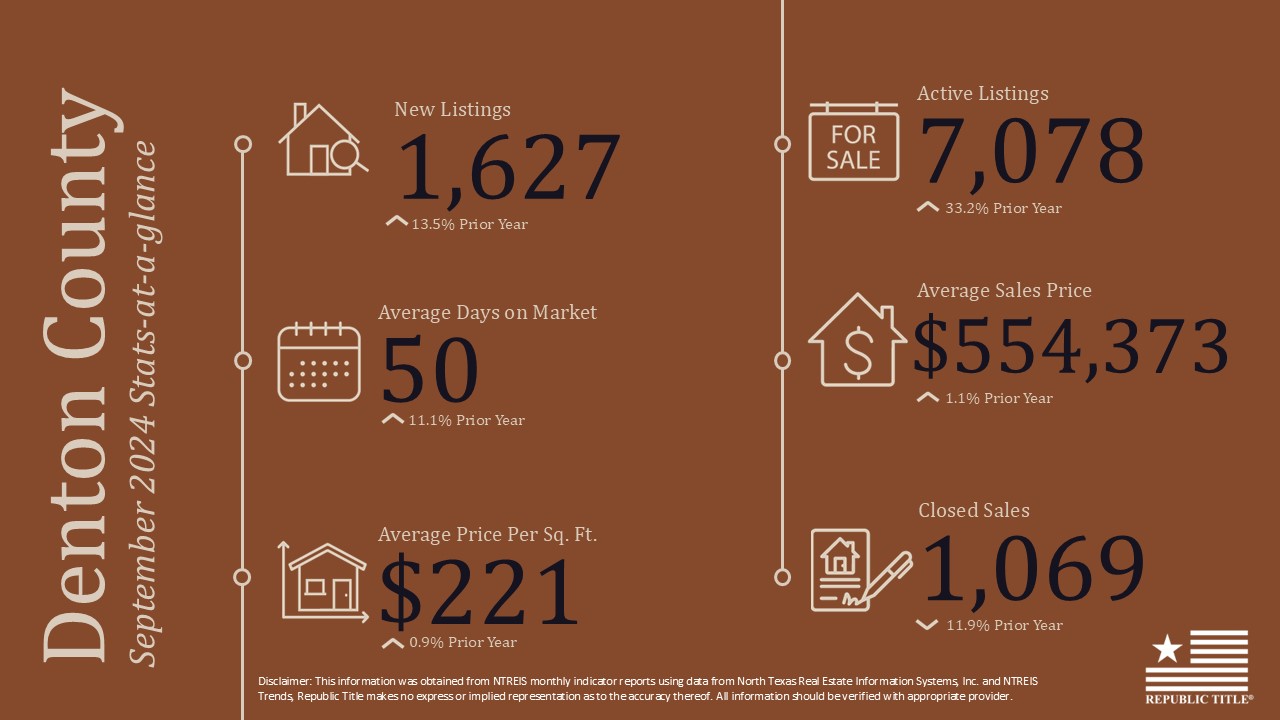
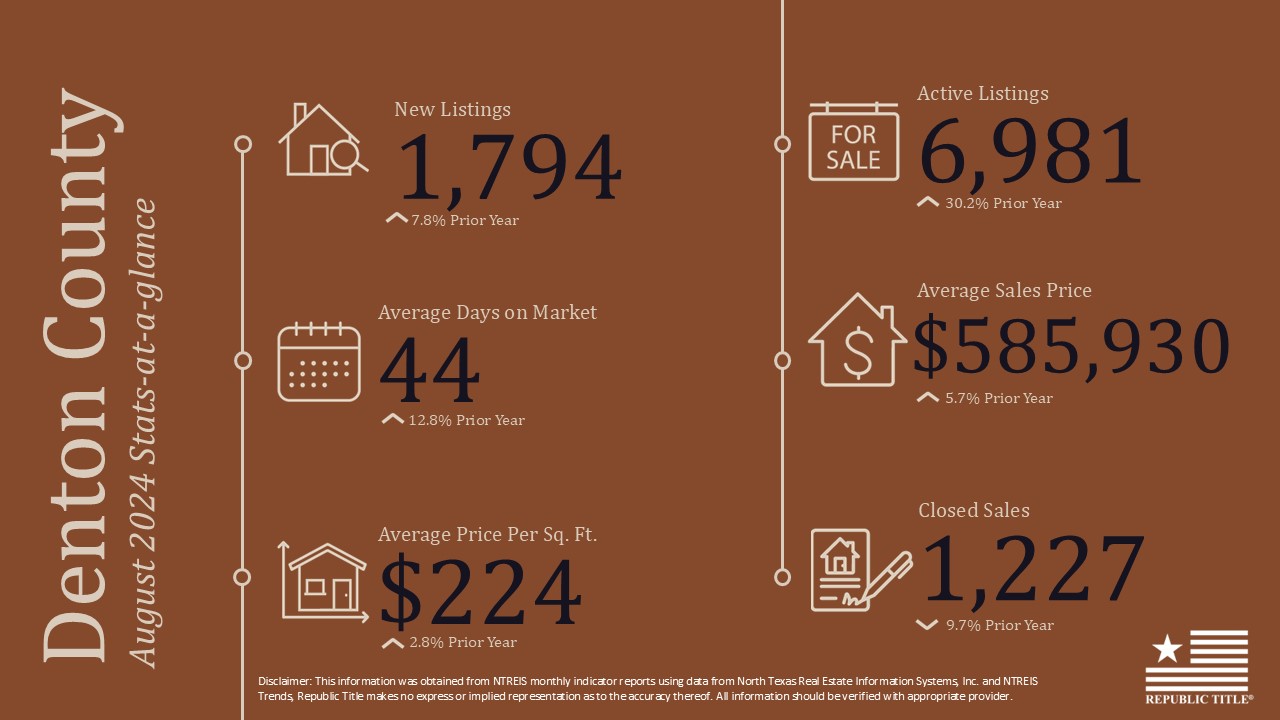
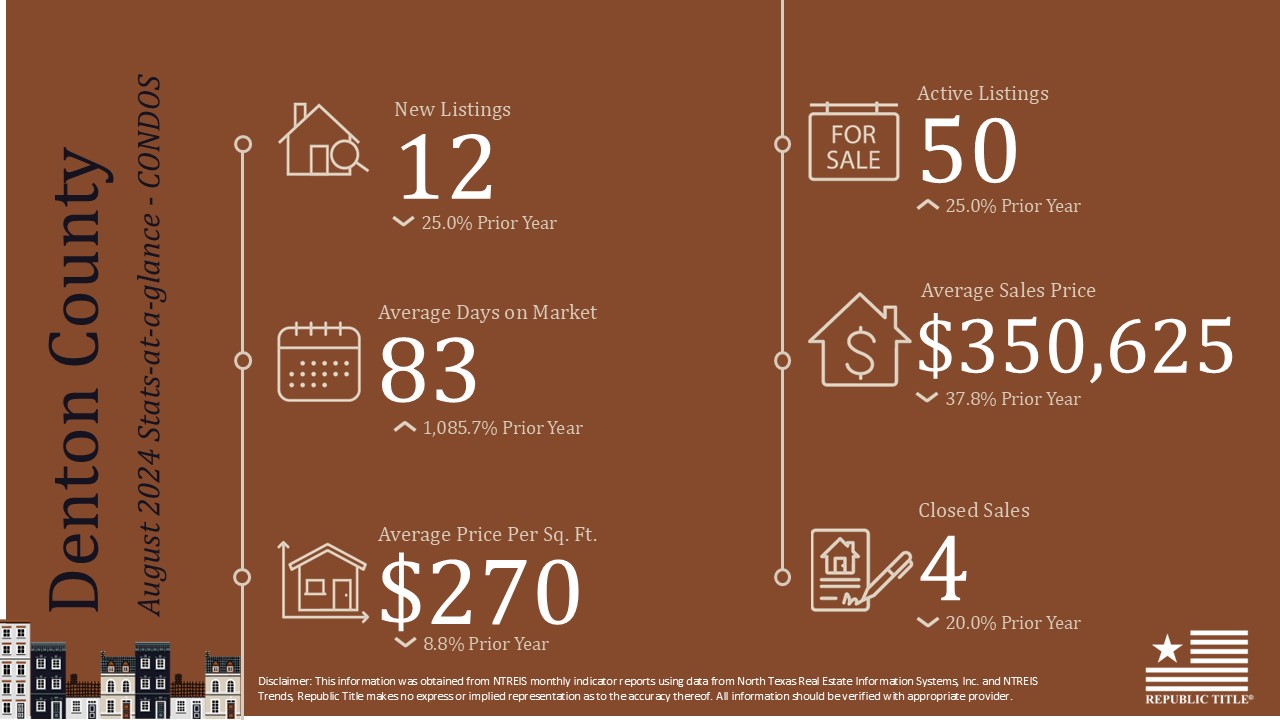
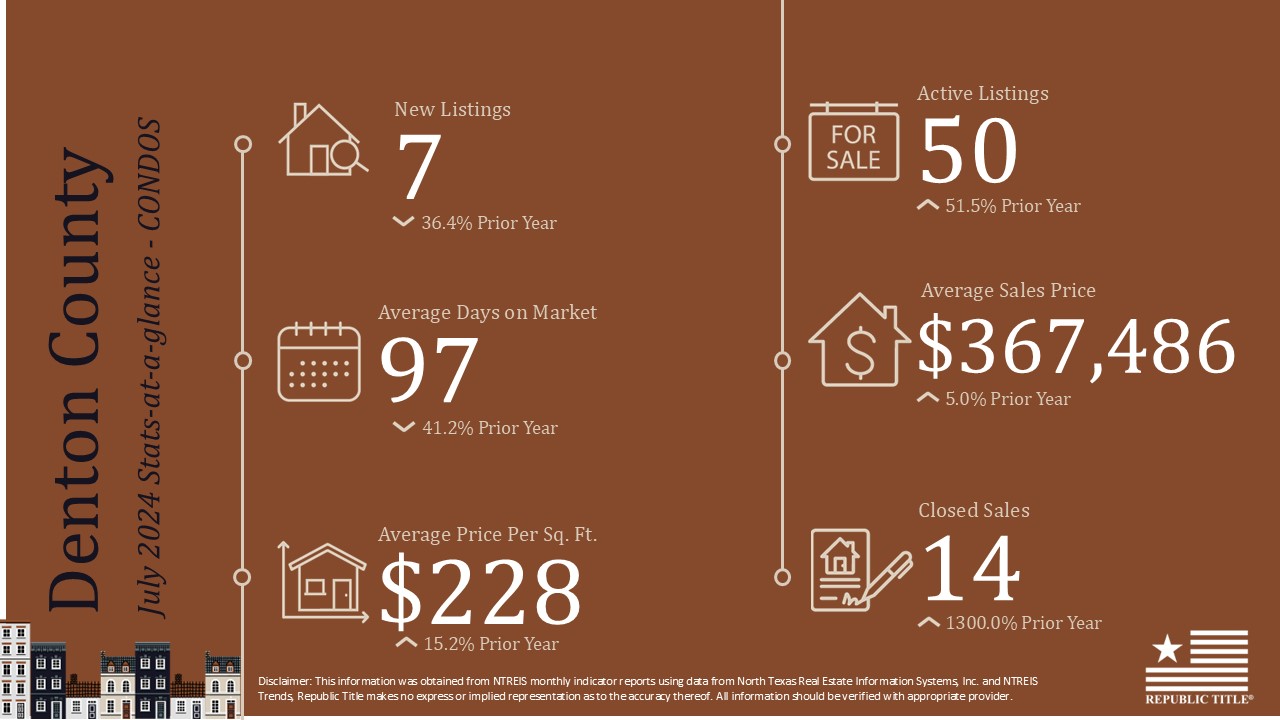
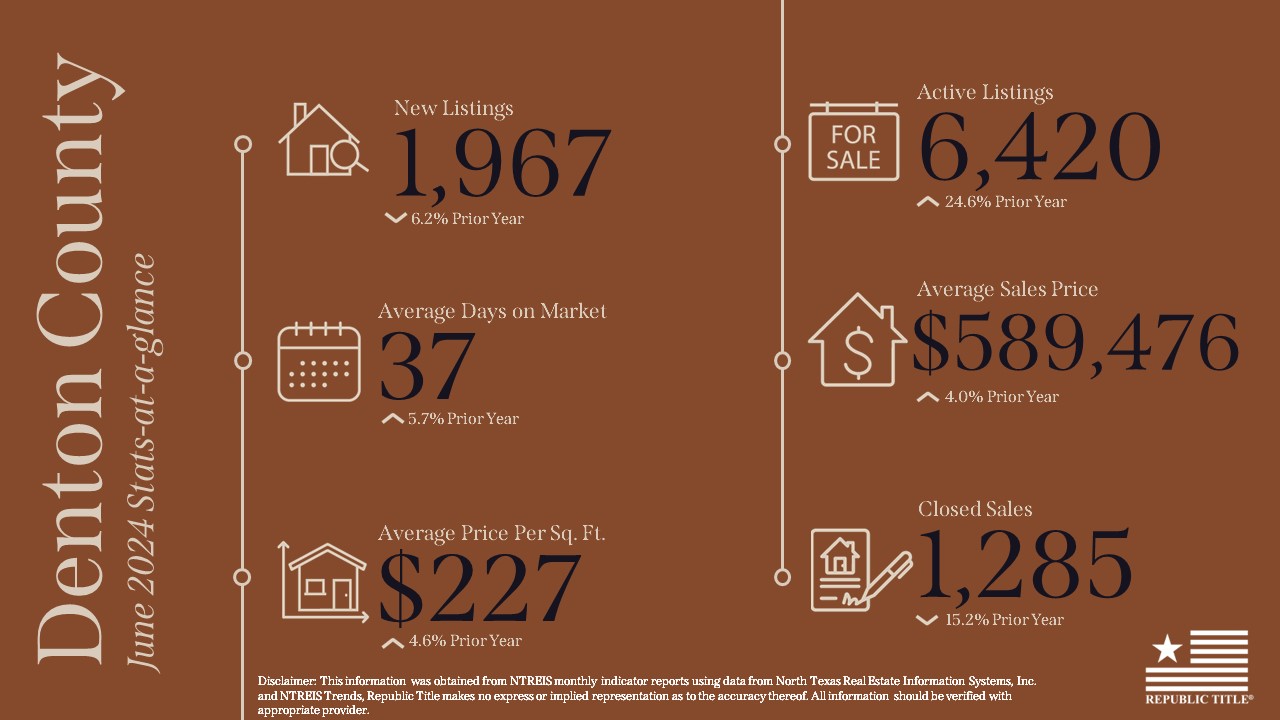
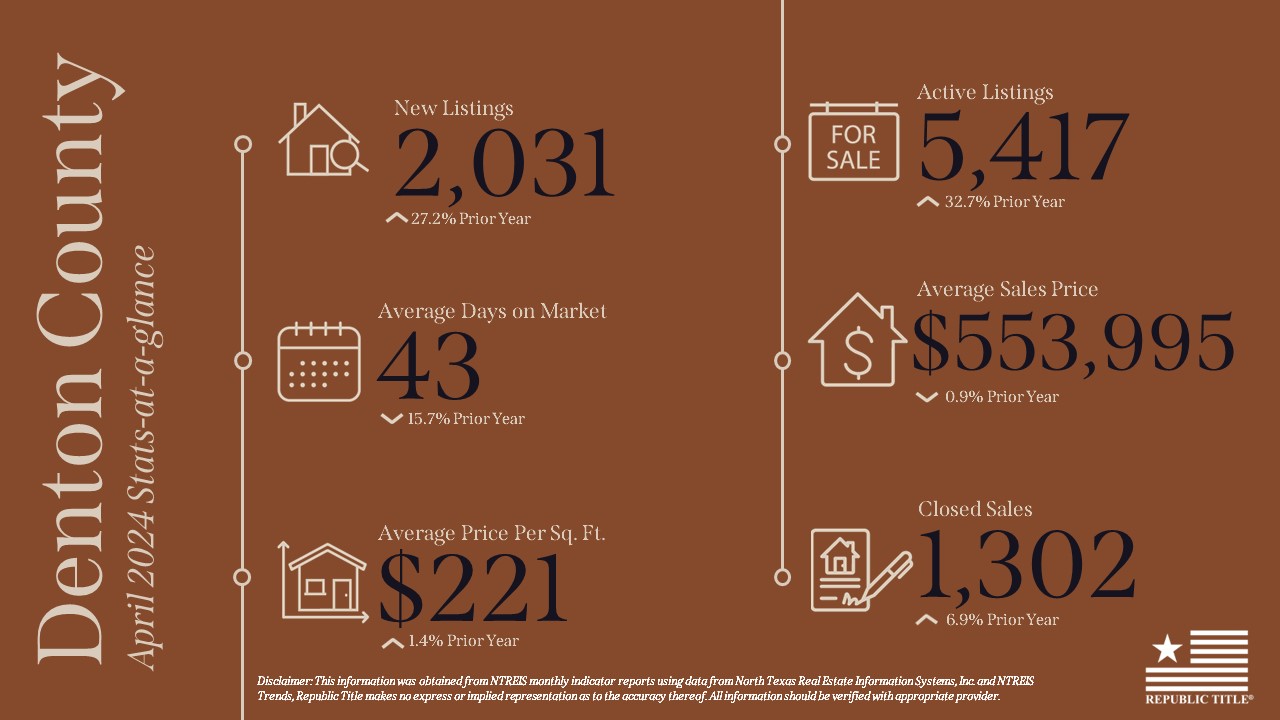
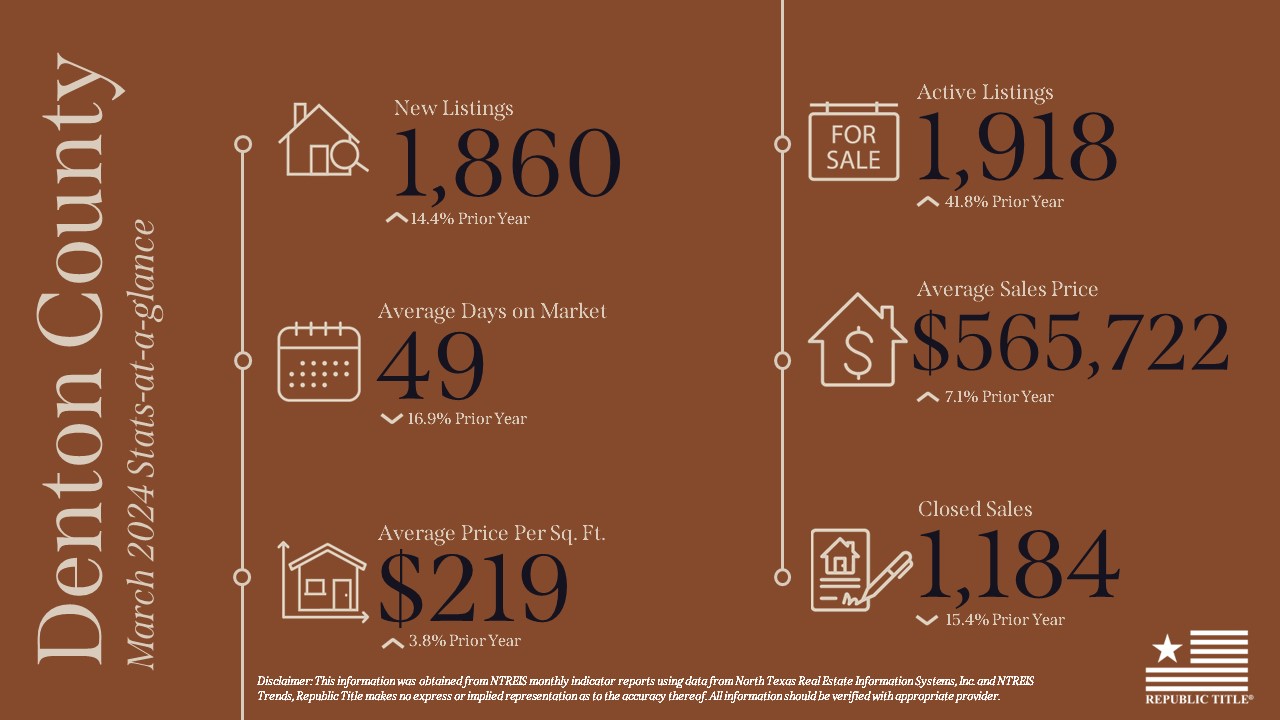
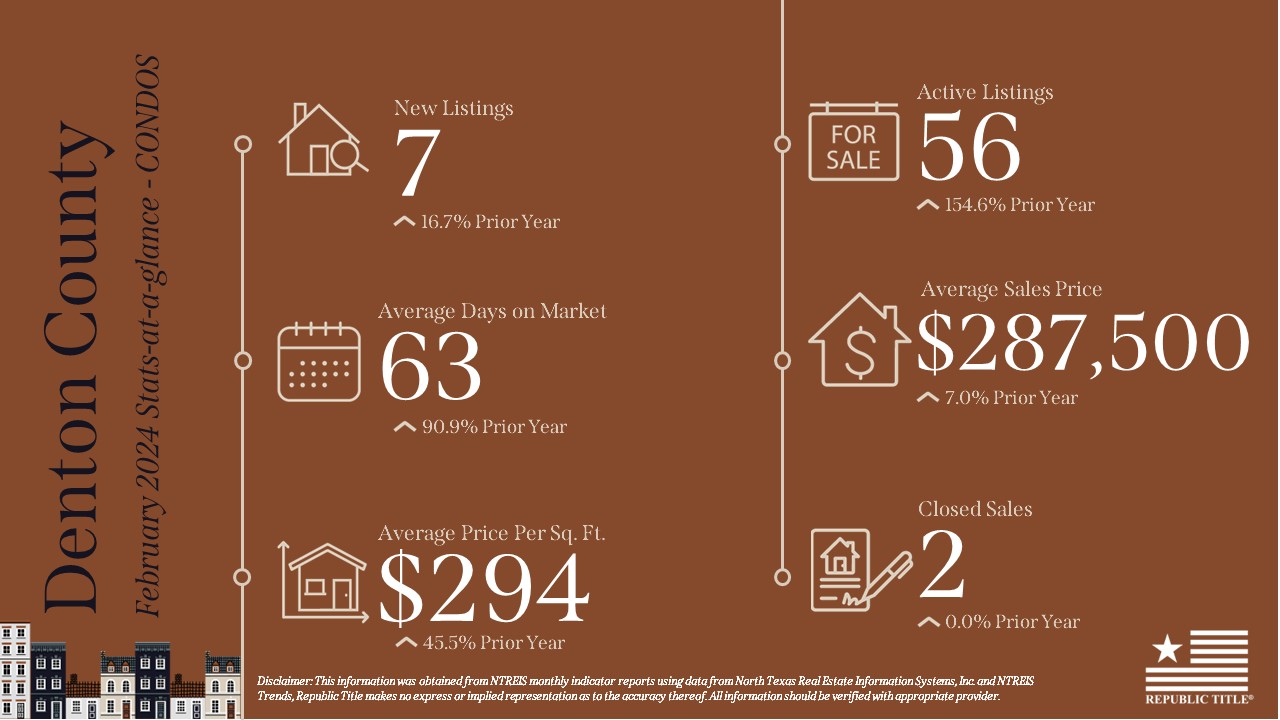
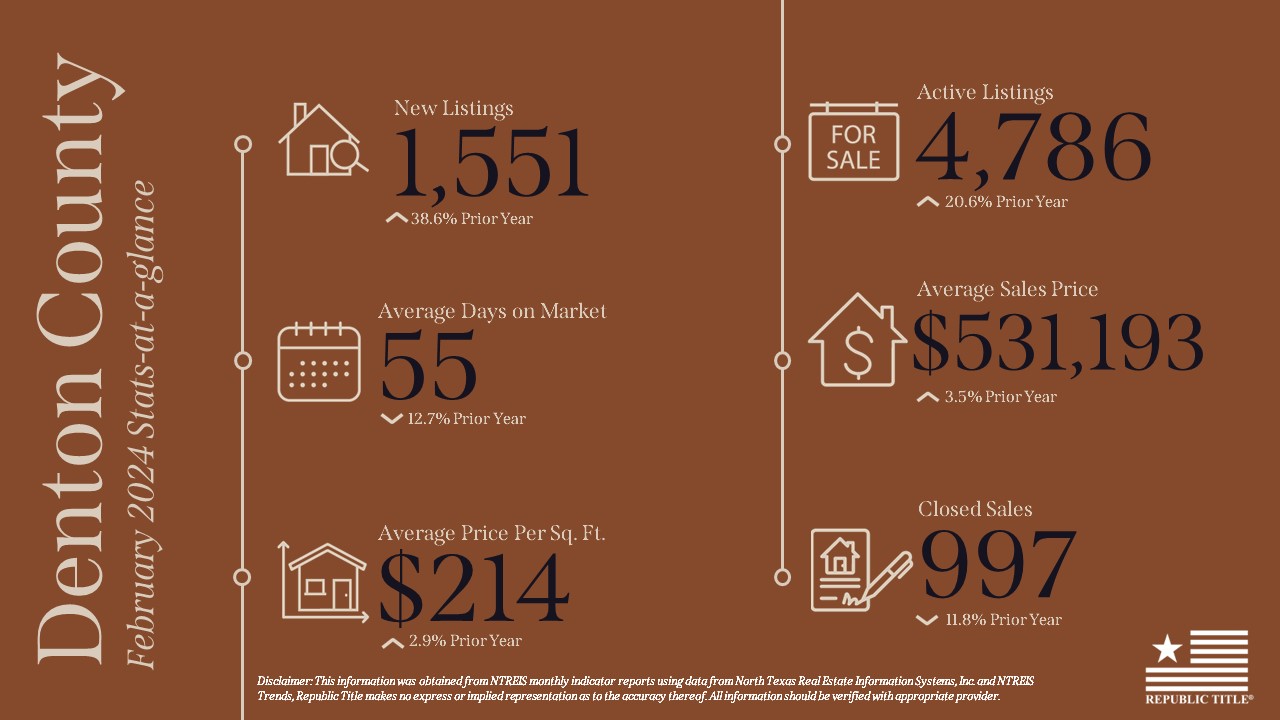
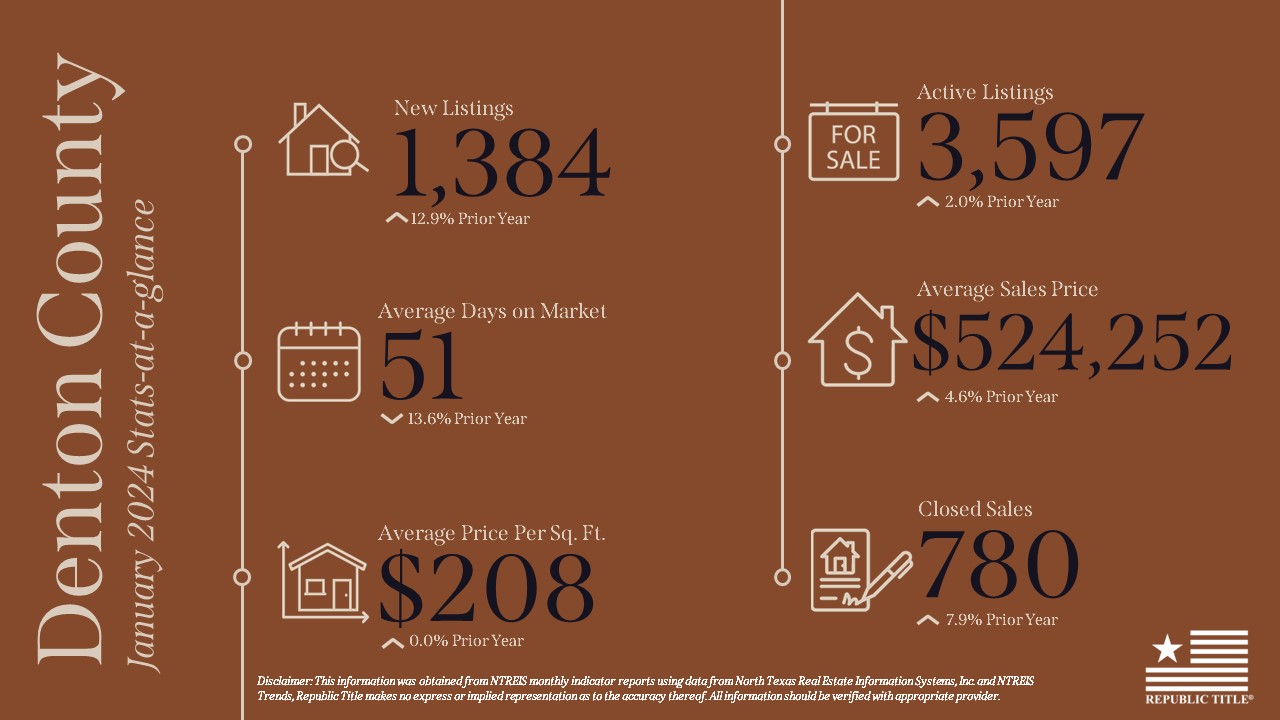
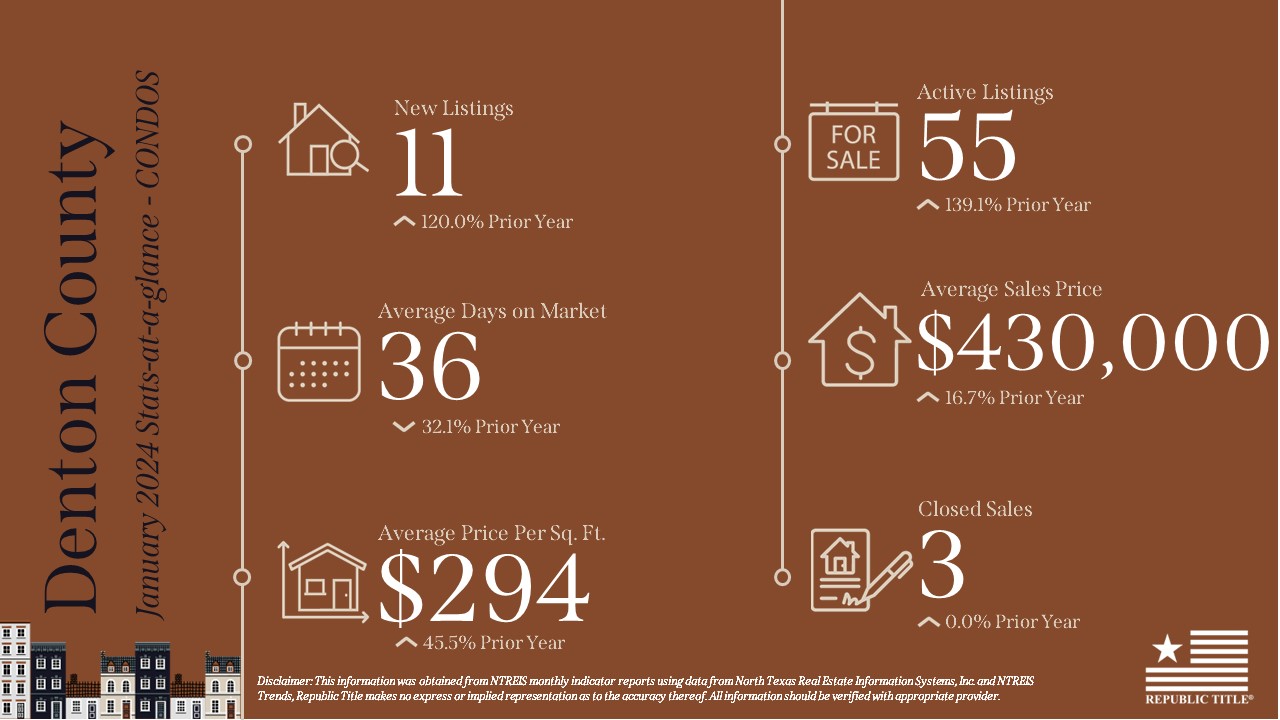
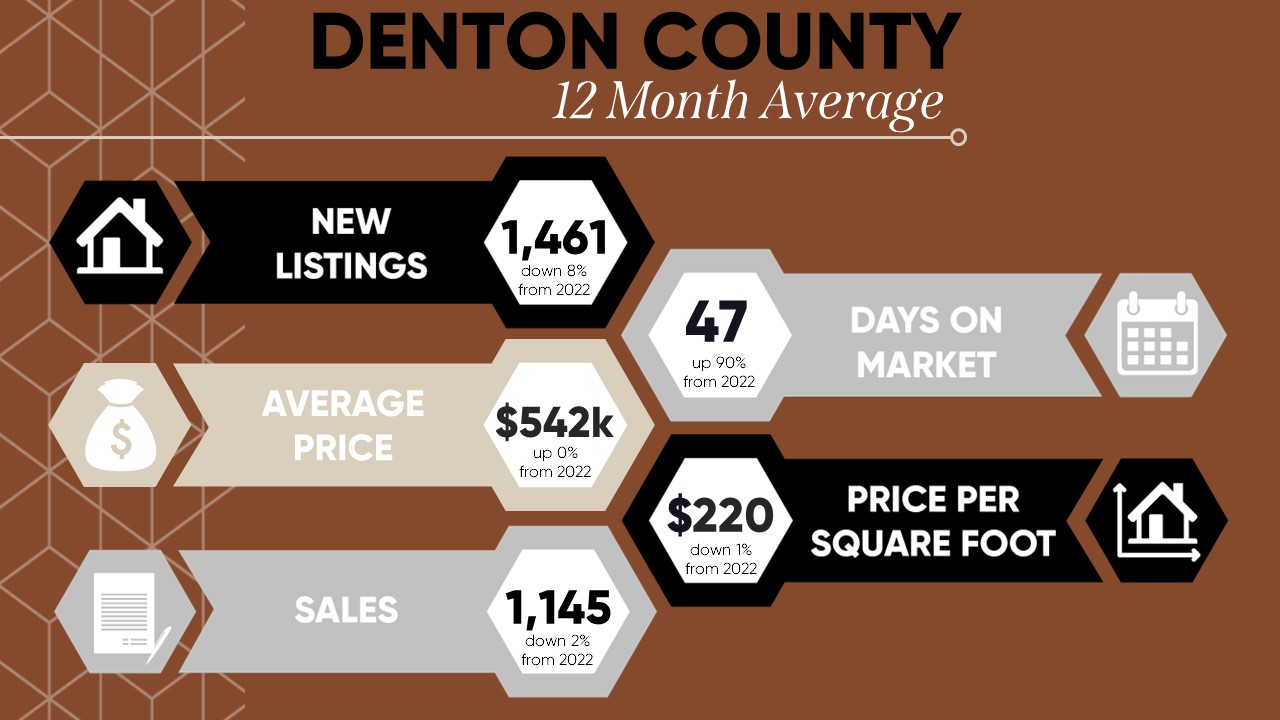
Denton County followed a similar trend, with new listings up by 11.9% and active listings by 26.8%. The DOM was 39 days, up 8.3% from the previous year. The average sales price increased by 1.5% to $578K, and the price per square foot rose slightly by 0.5% to $223. Closed sales remained nearly flat, with a slight decrease of 0.1%, ending at 1,274 units.
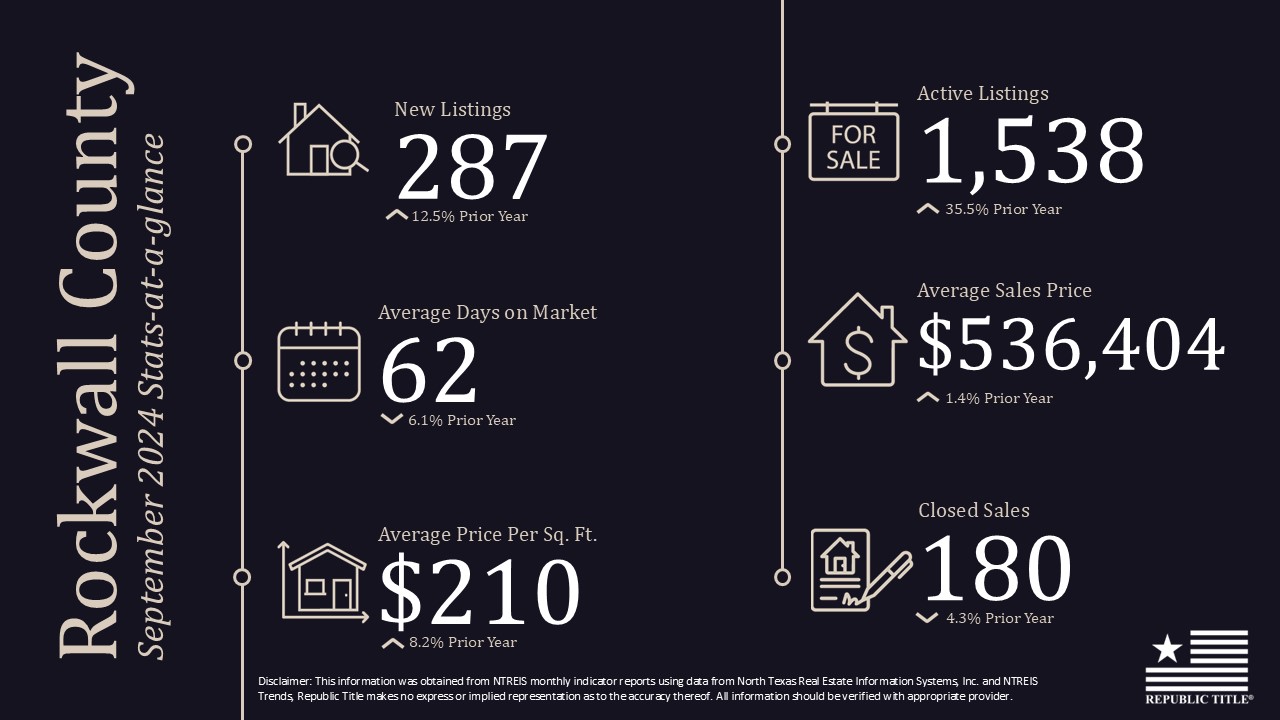
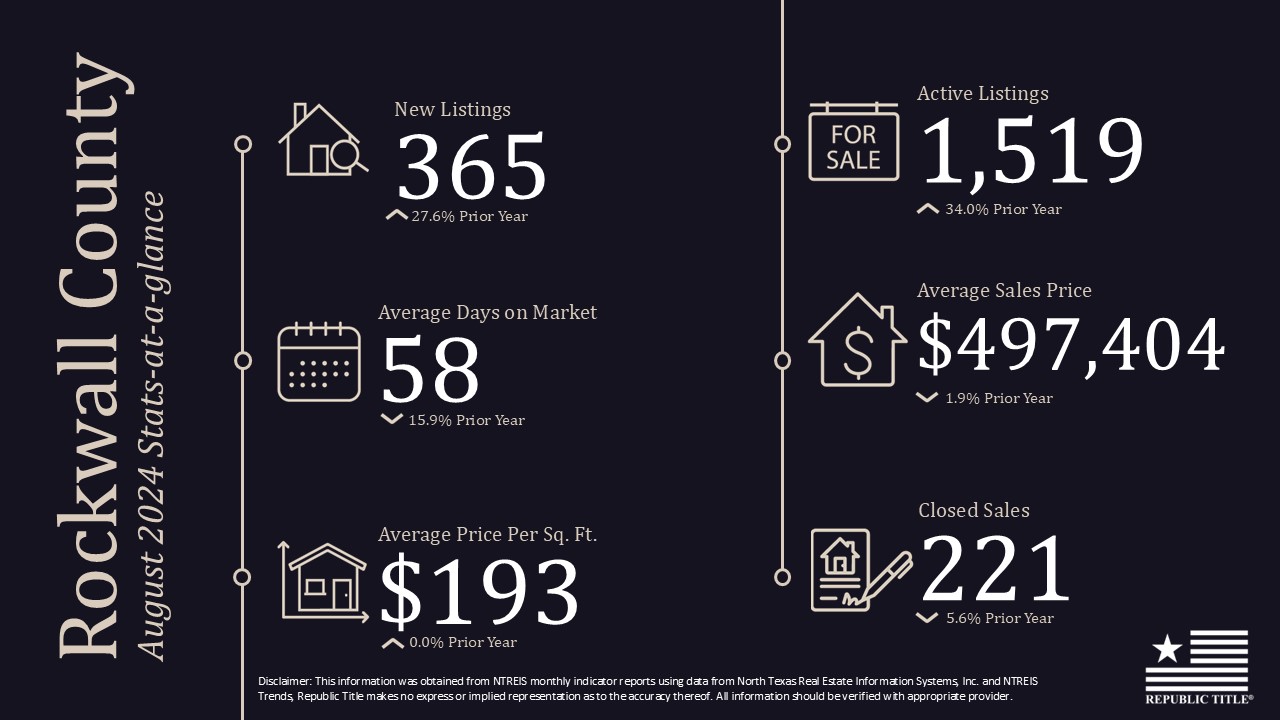
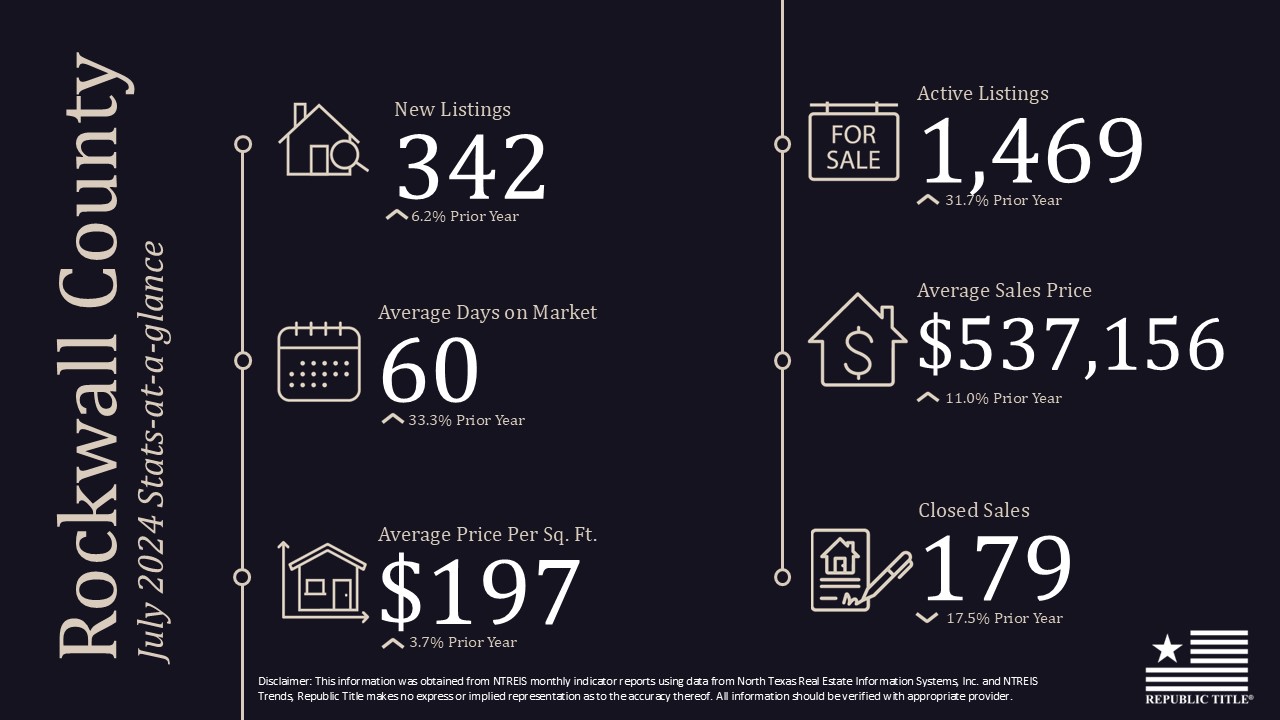
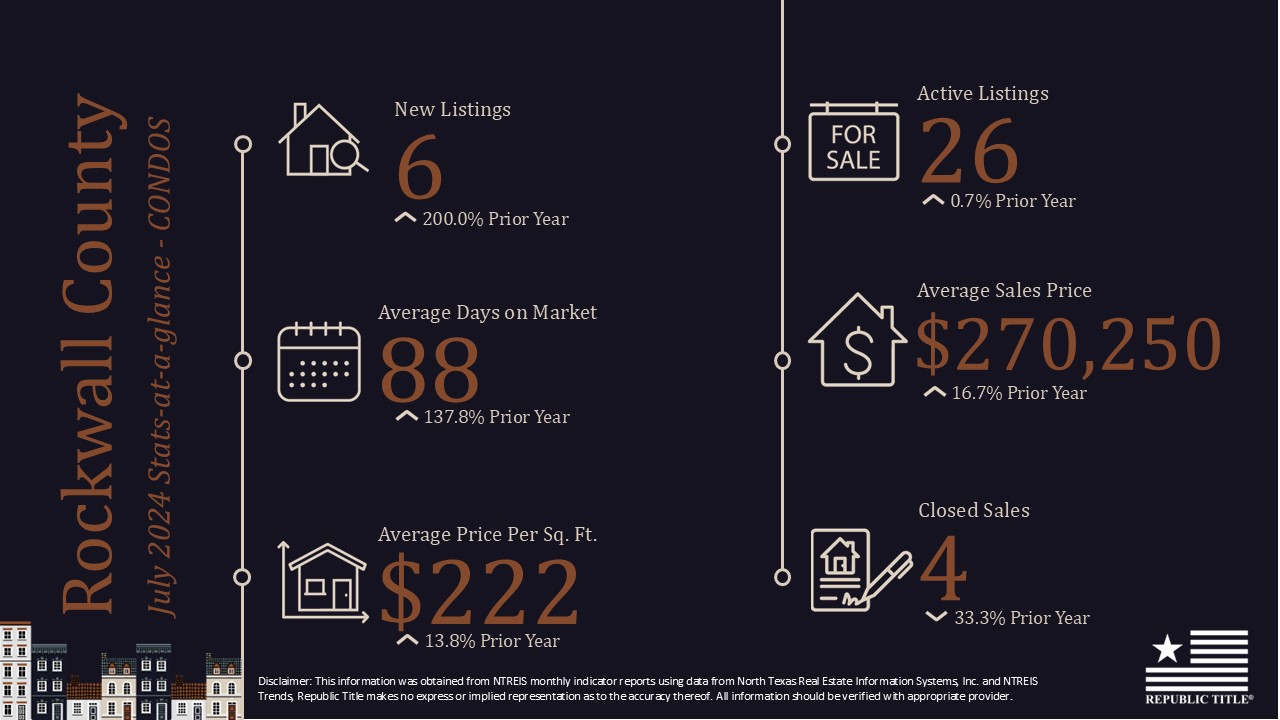
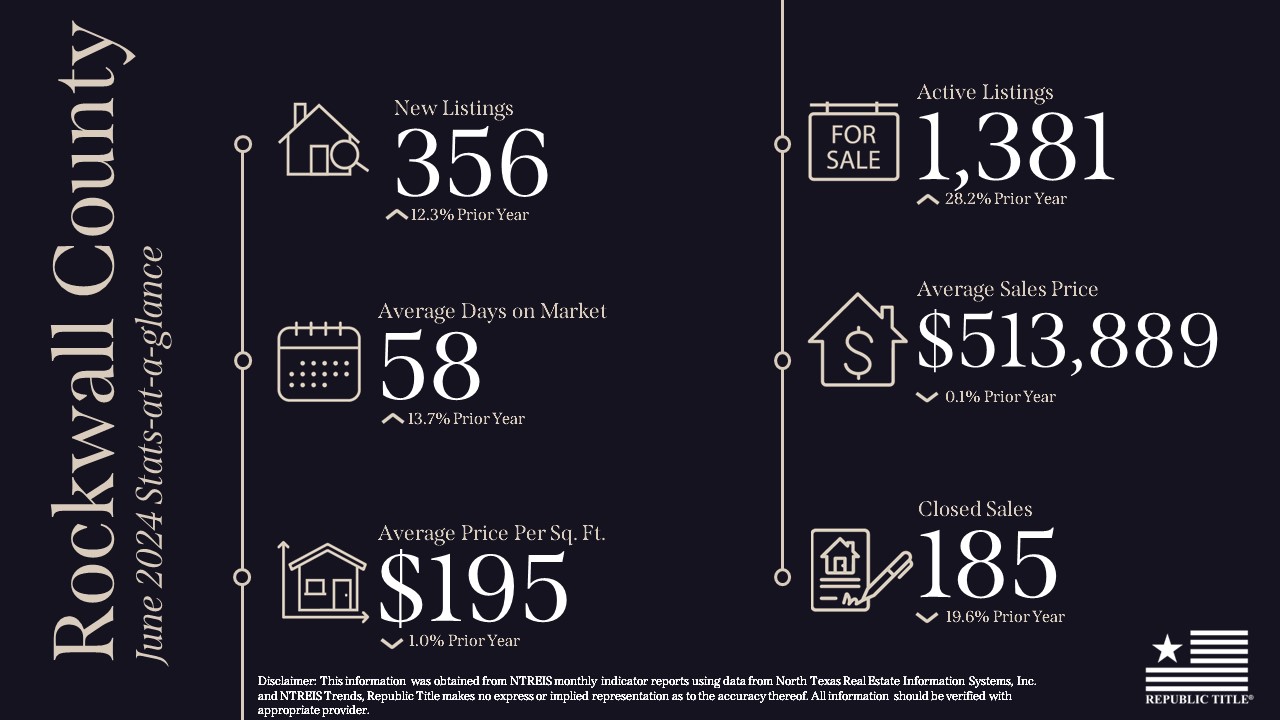
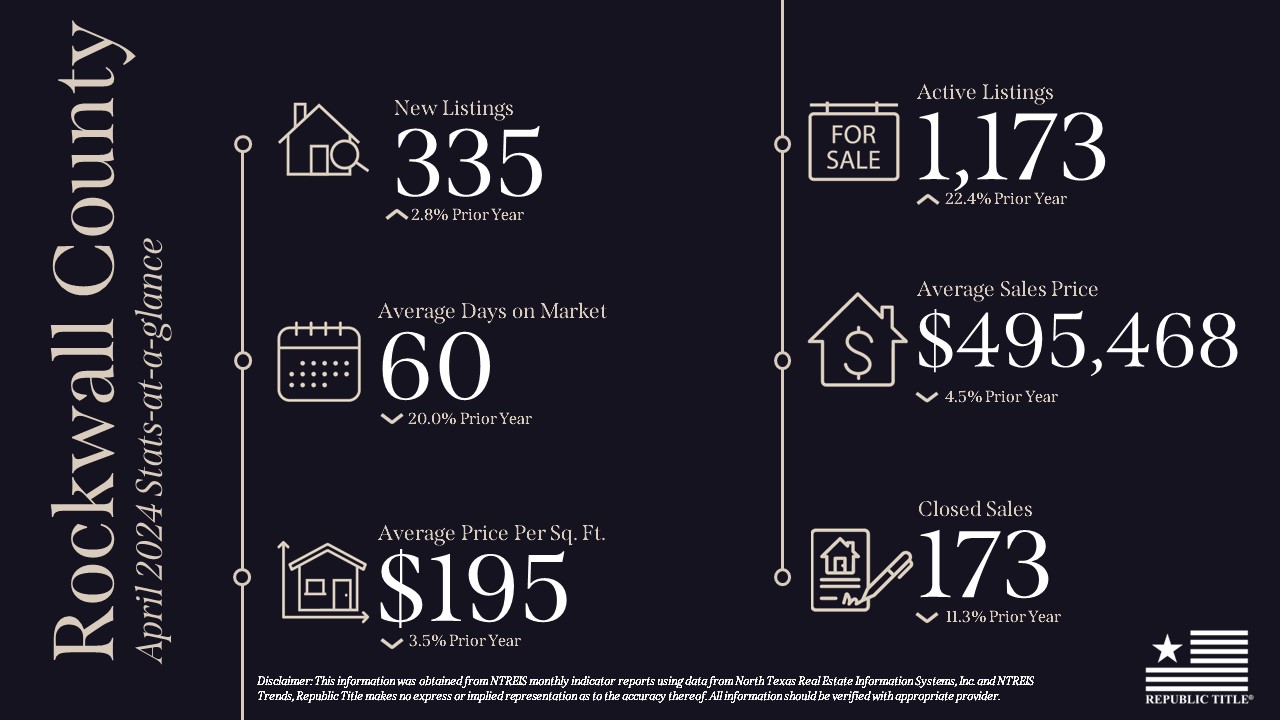
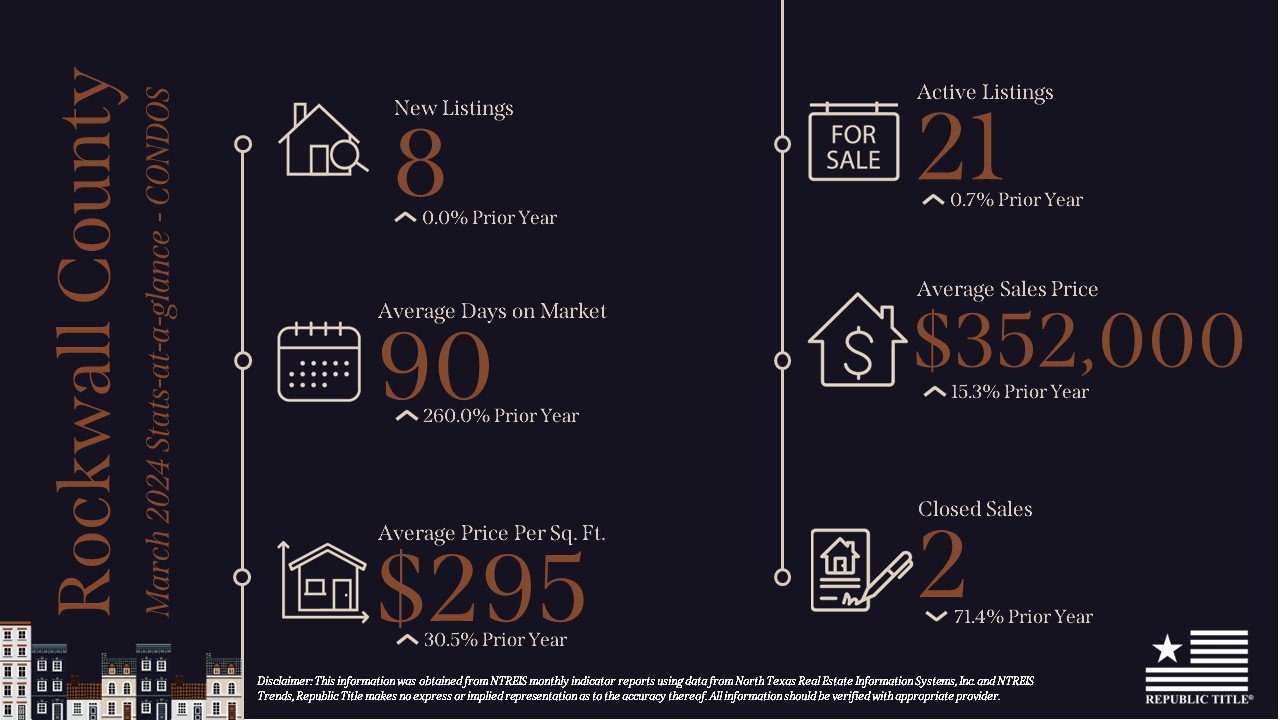
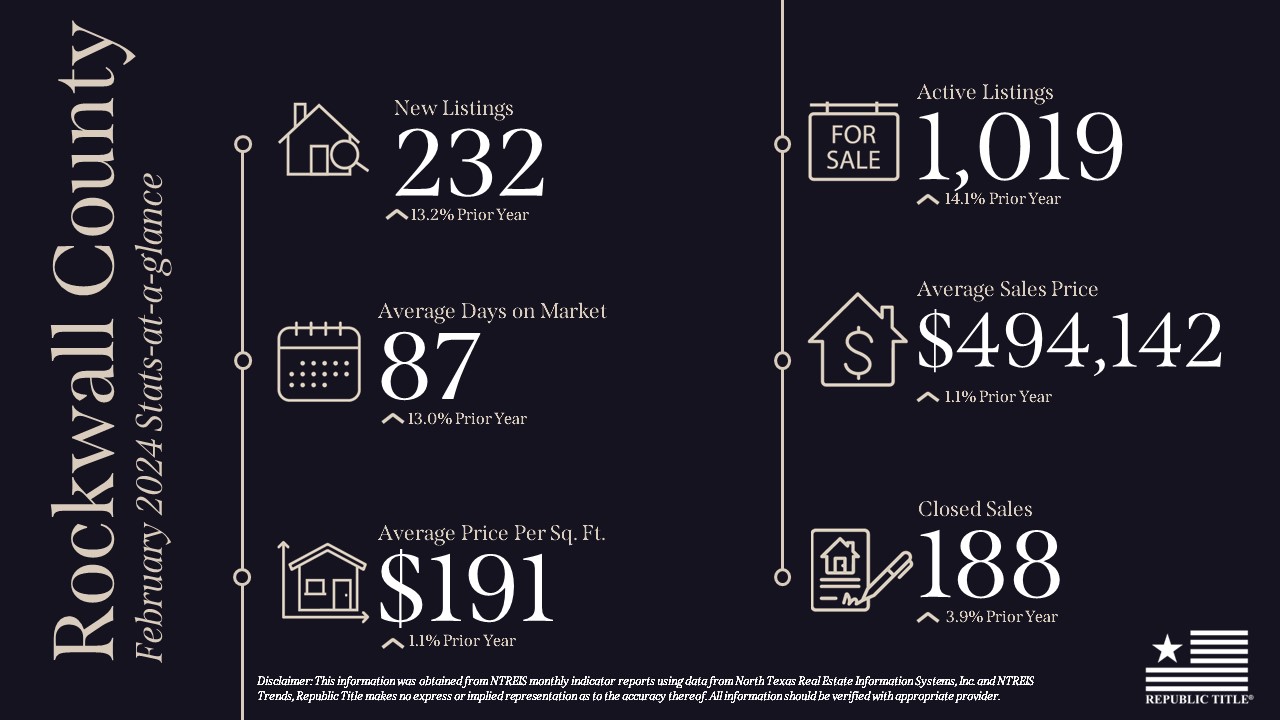
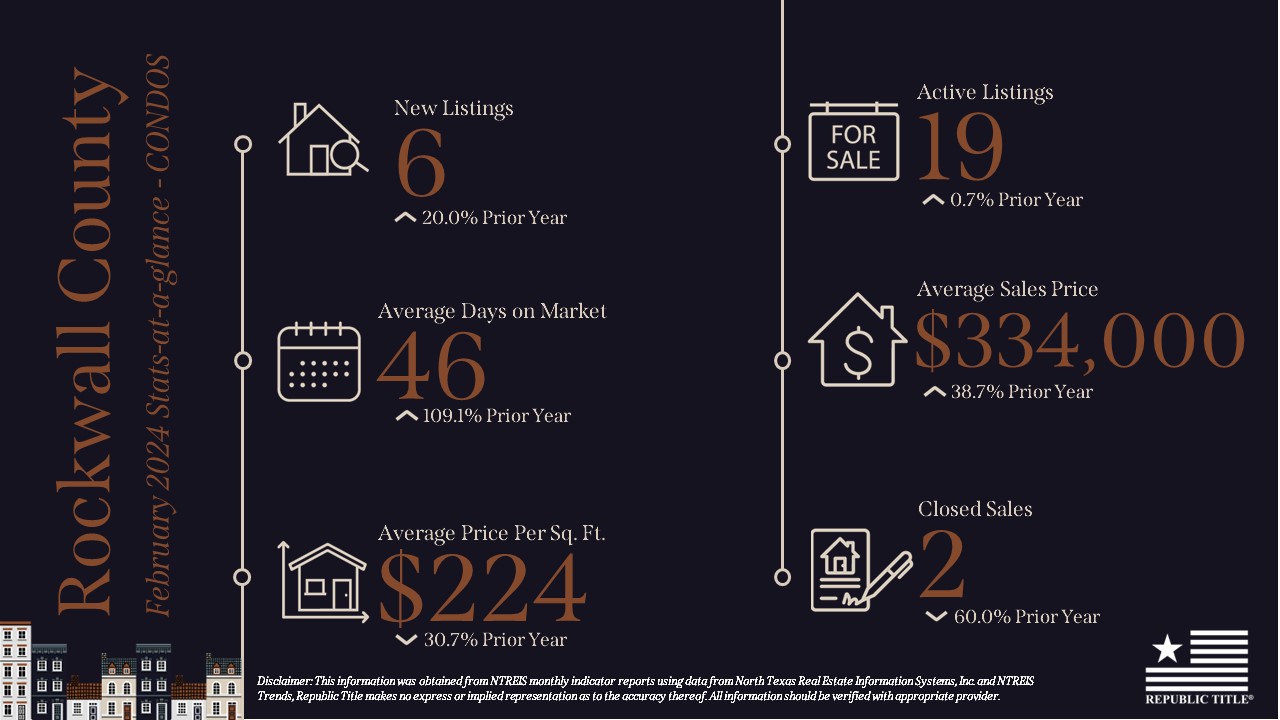
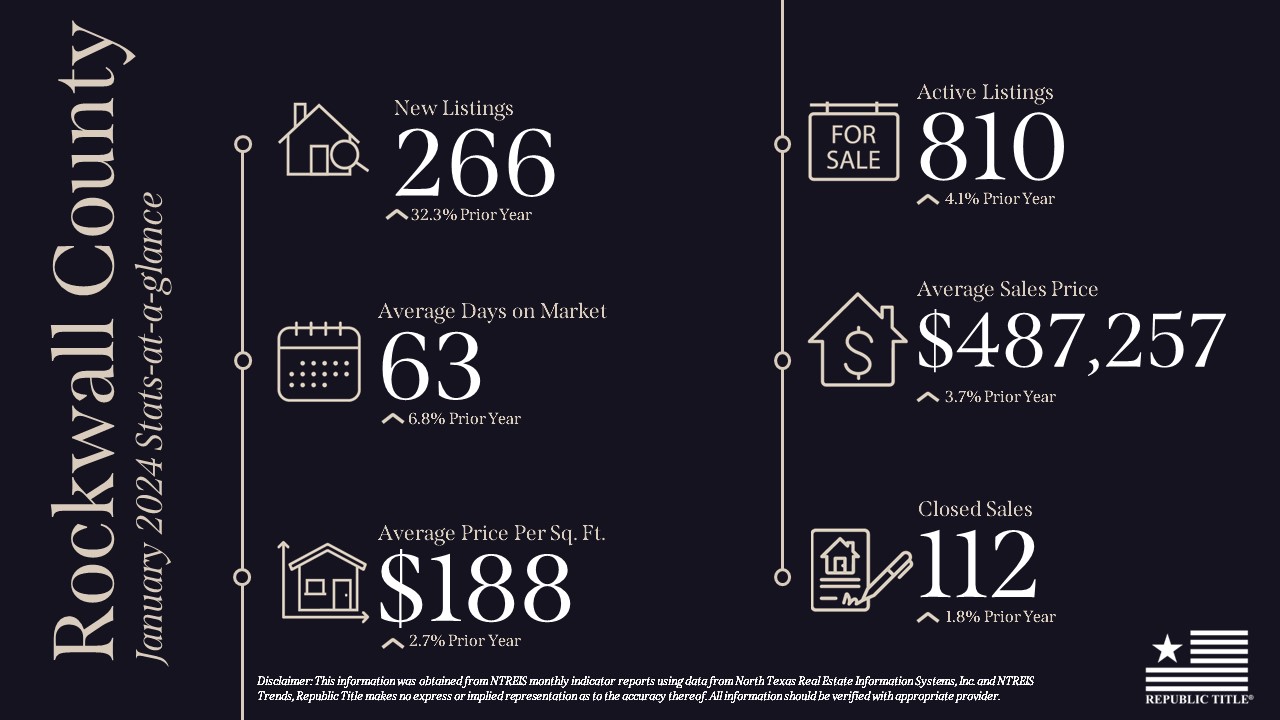
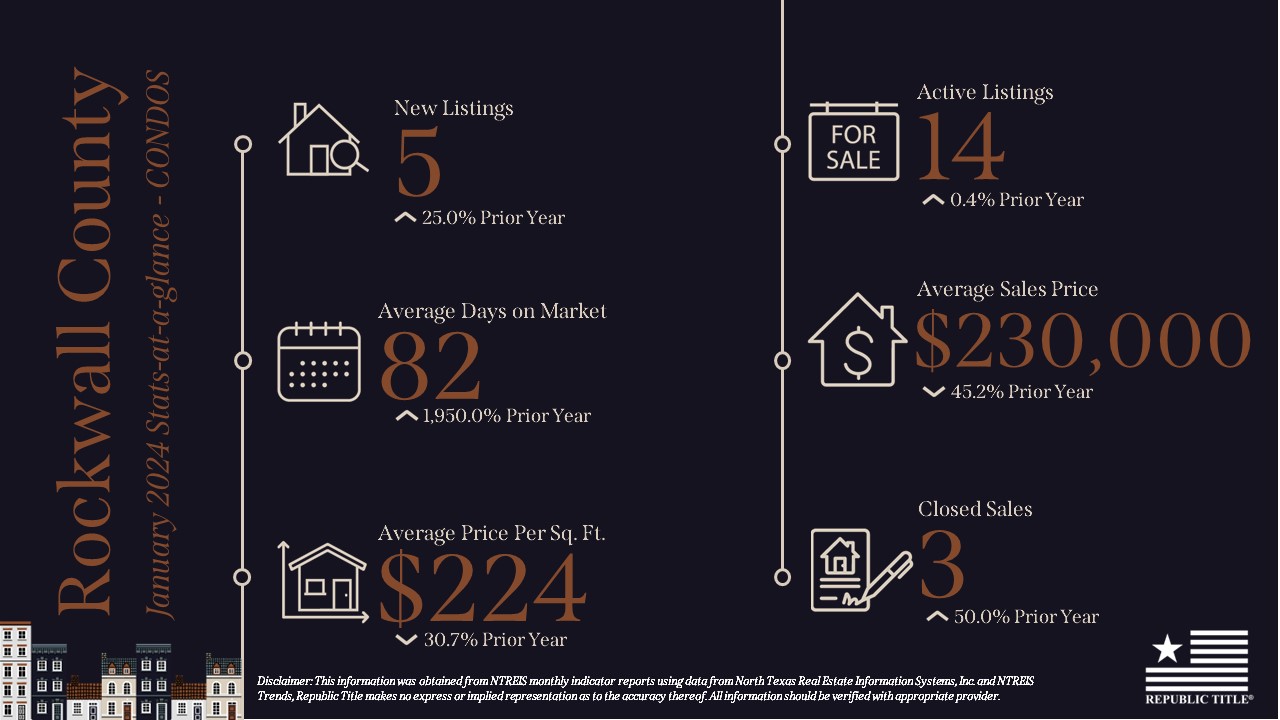
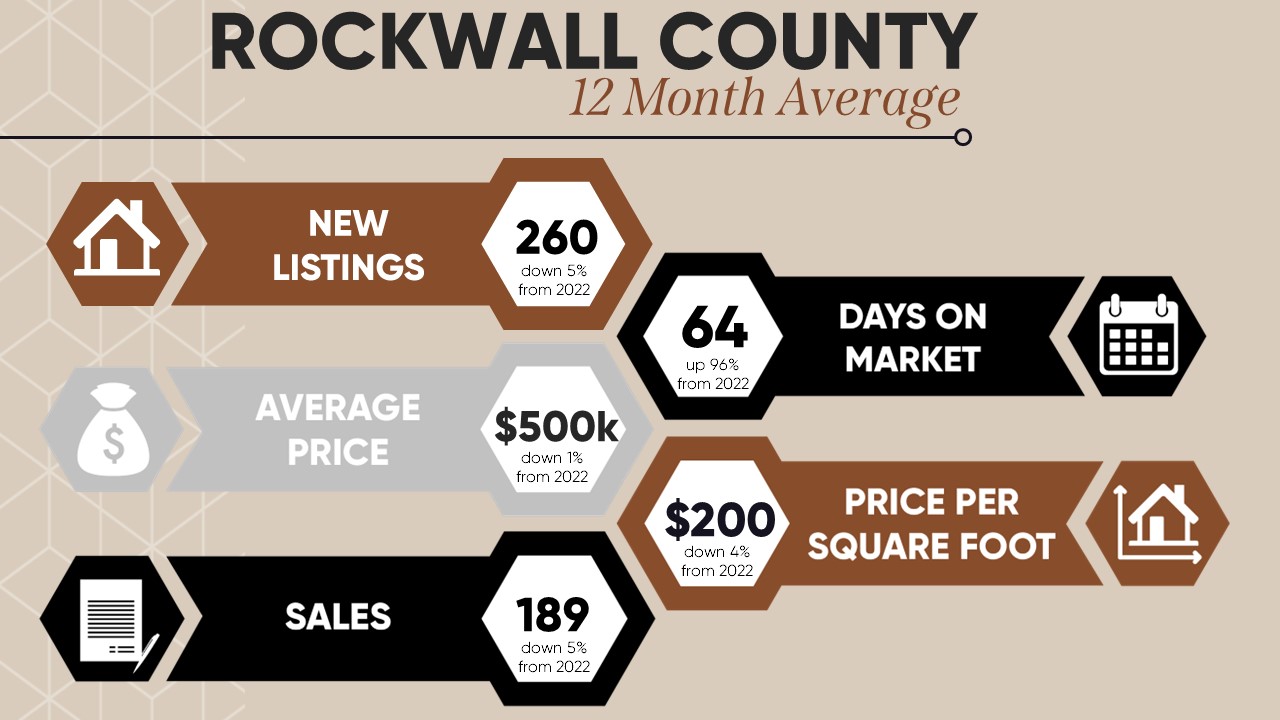
Rockwall County experienced a modest increase in new listings by 6.2% and active listings by 31.7%. However, the DOM rose significantly to 60 days, an increase of over 33% from the prior year. The average sales price increased by 11% to $537K, while the price per square foot went up by 3.7% to $197. Closed sales dropped notably by 17.5%, totaling 179 units.
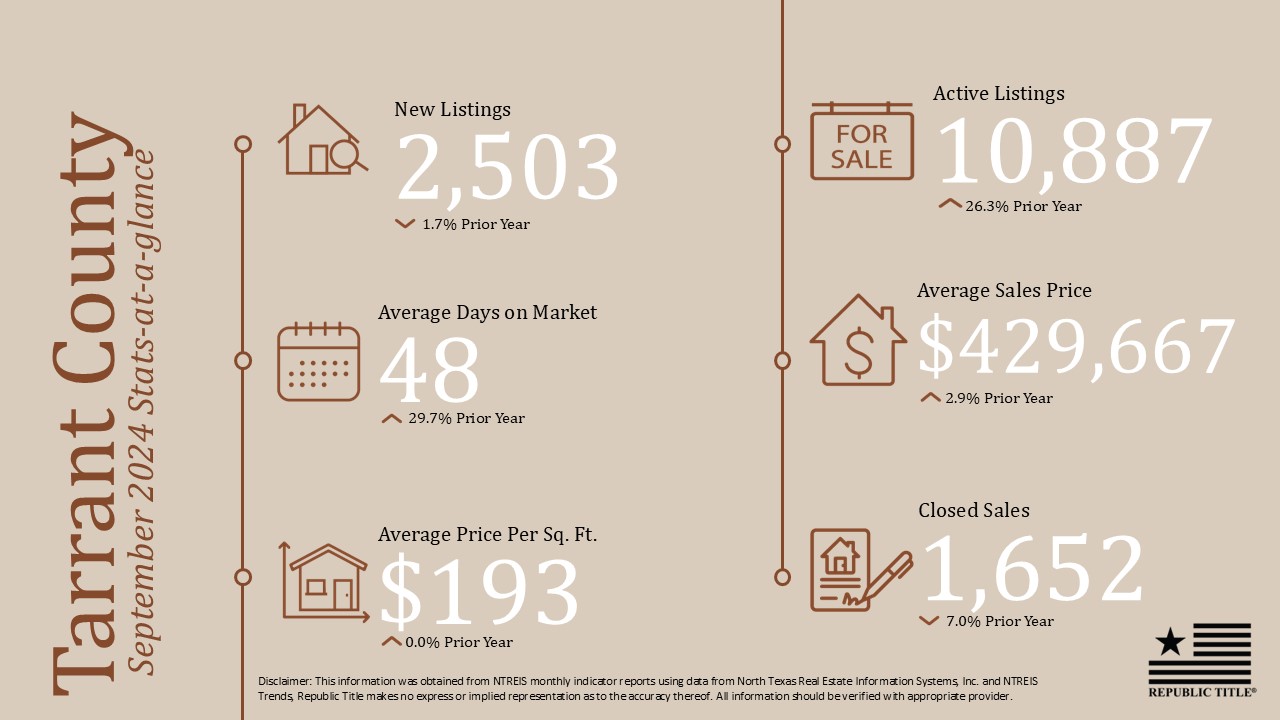
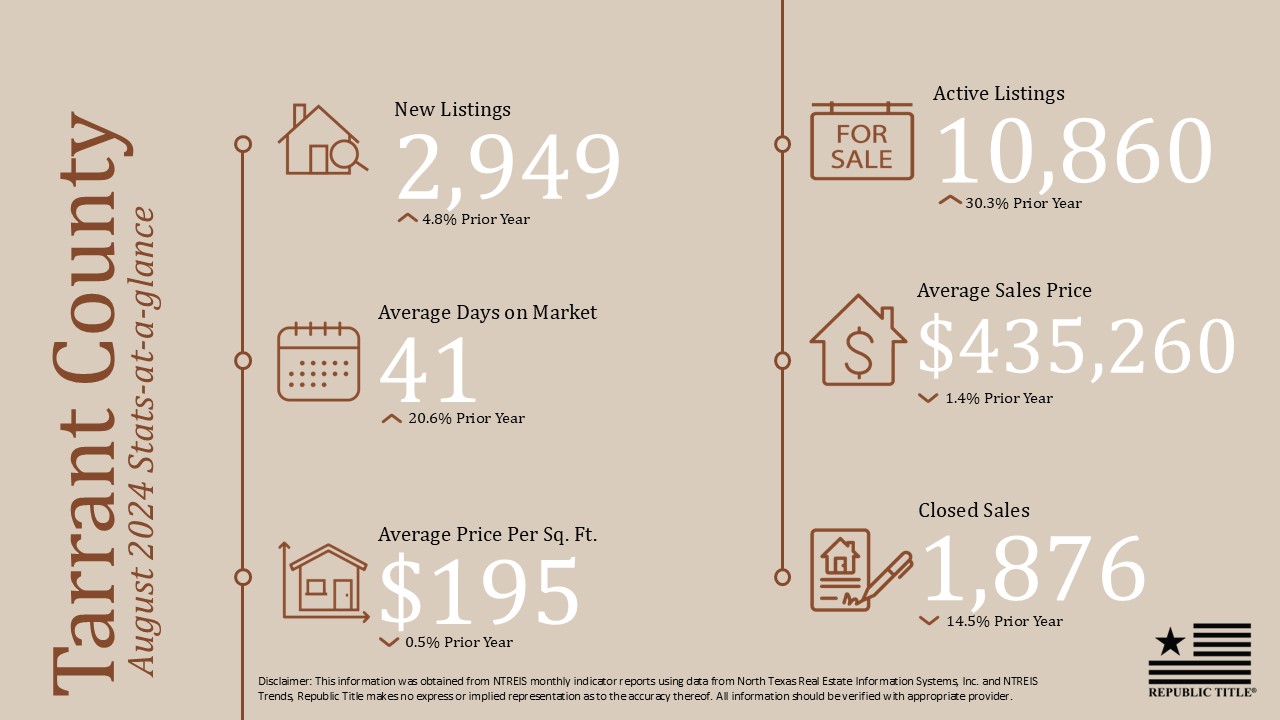
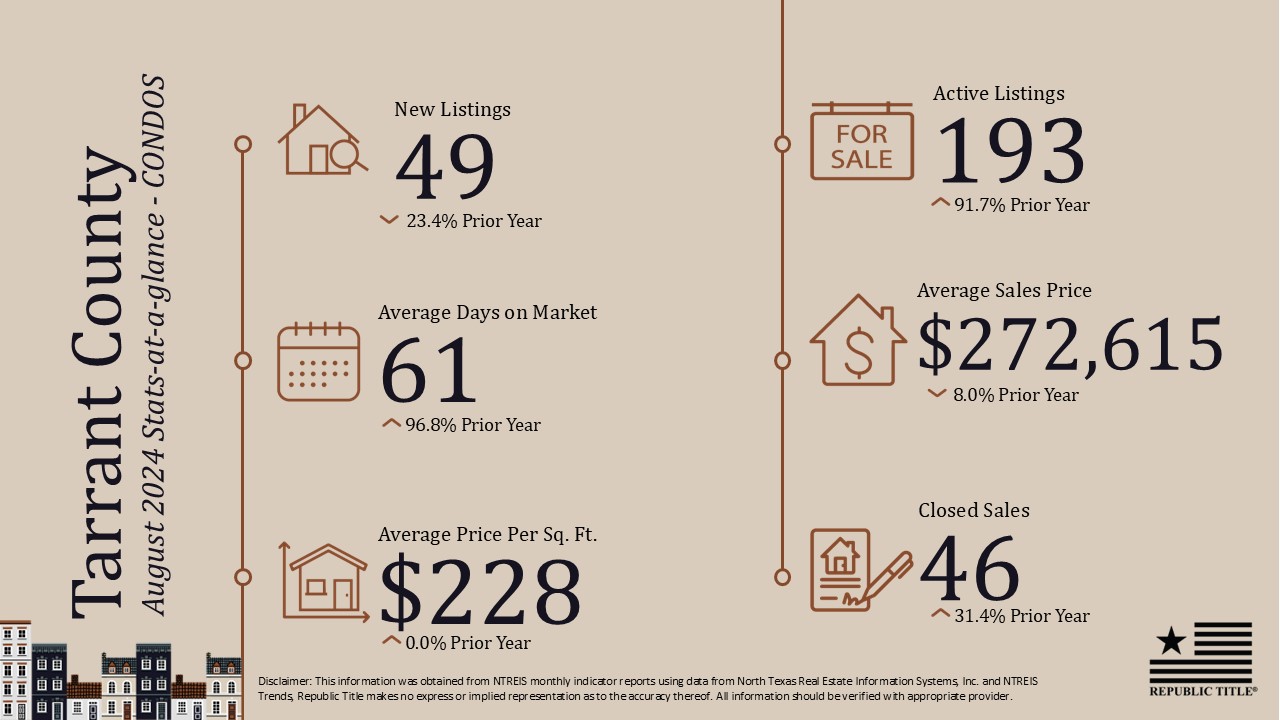
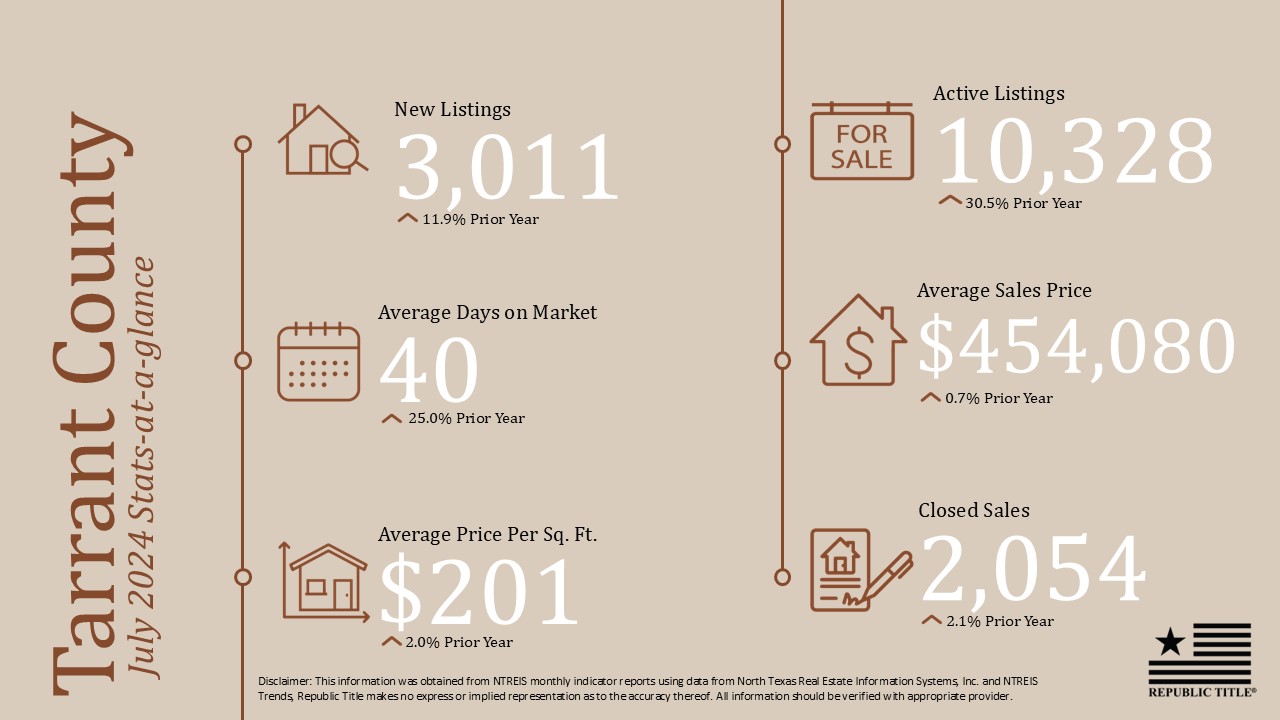
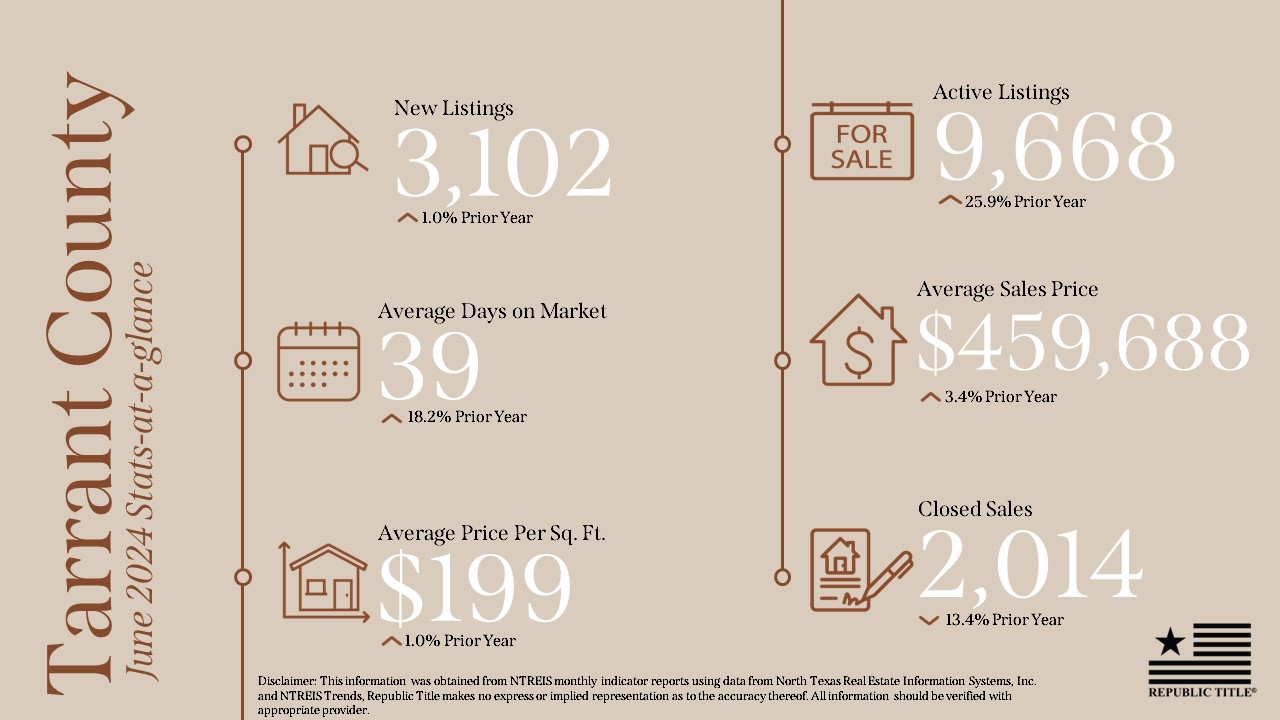
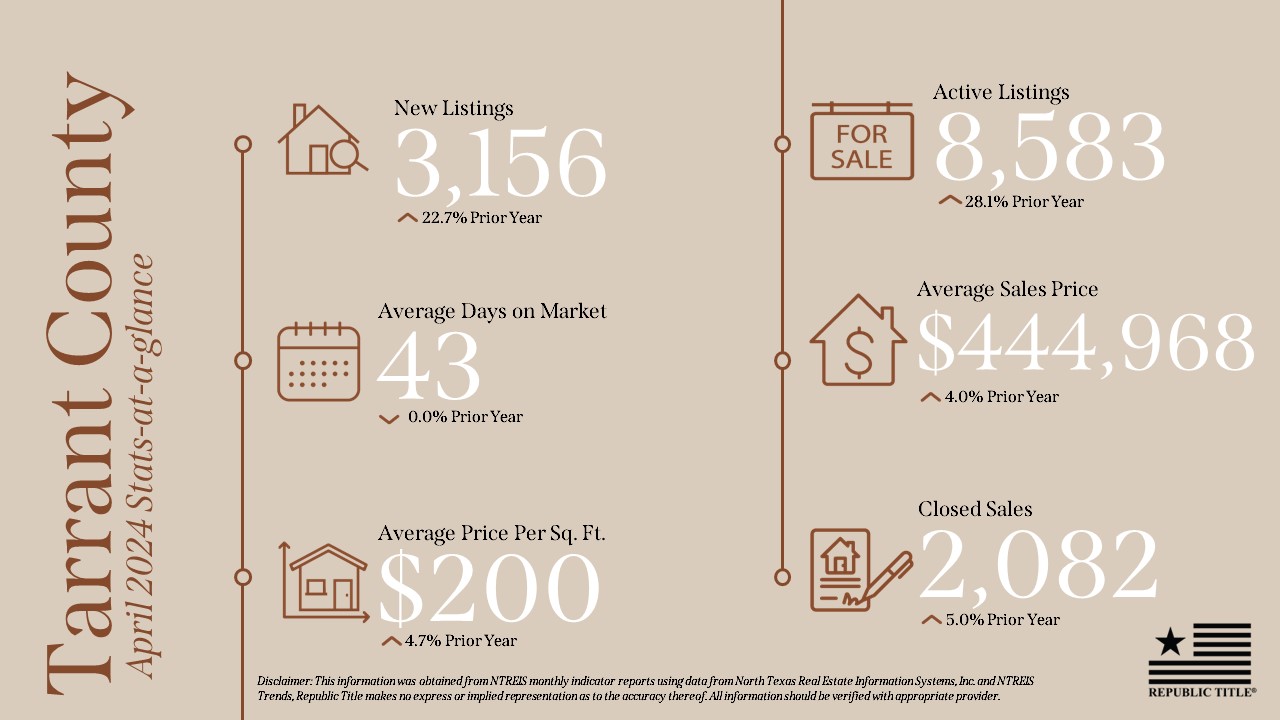
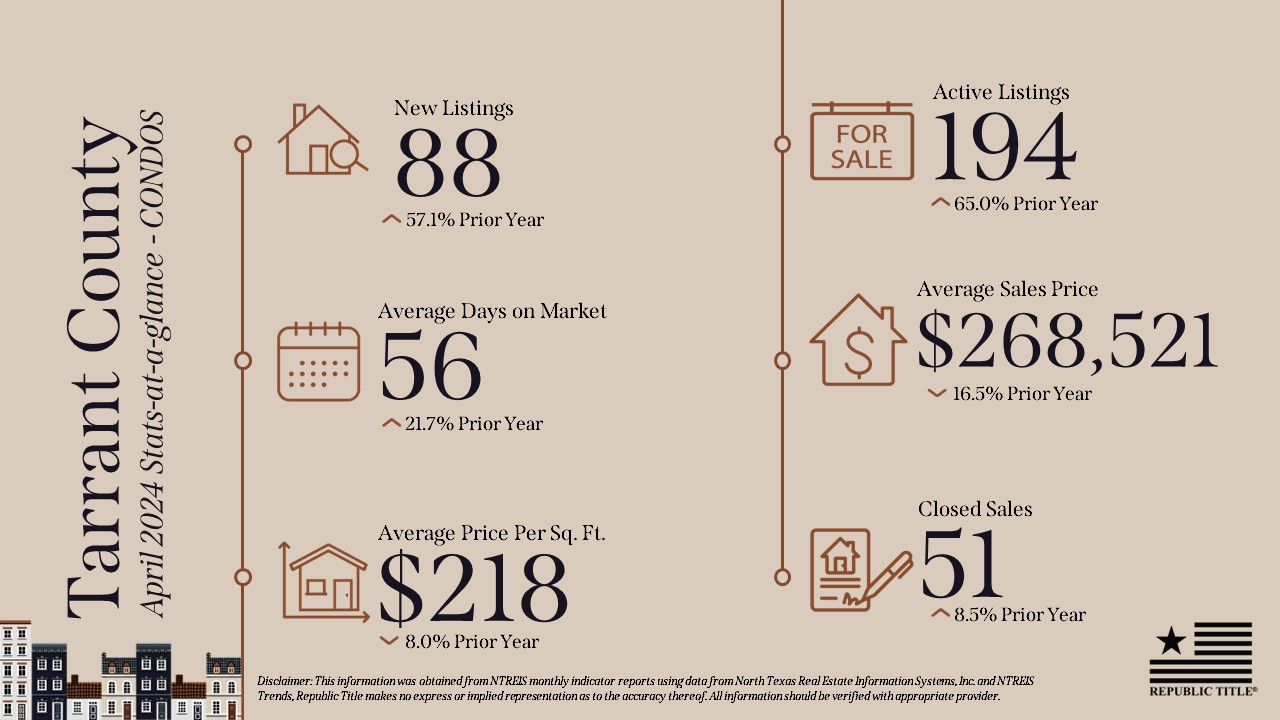
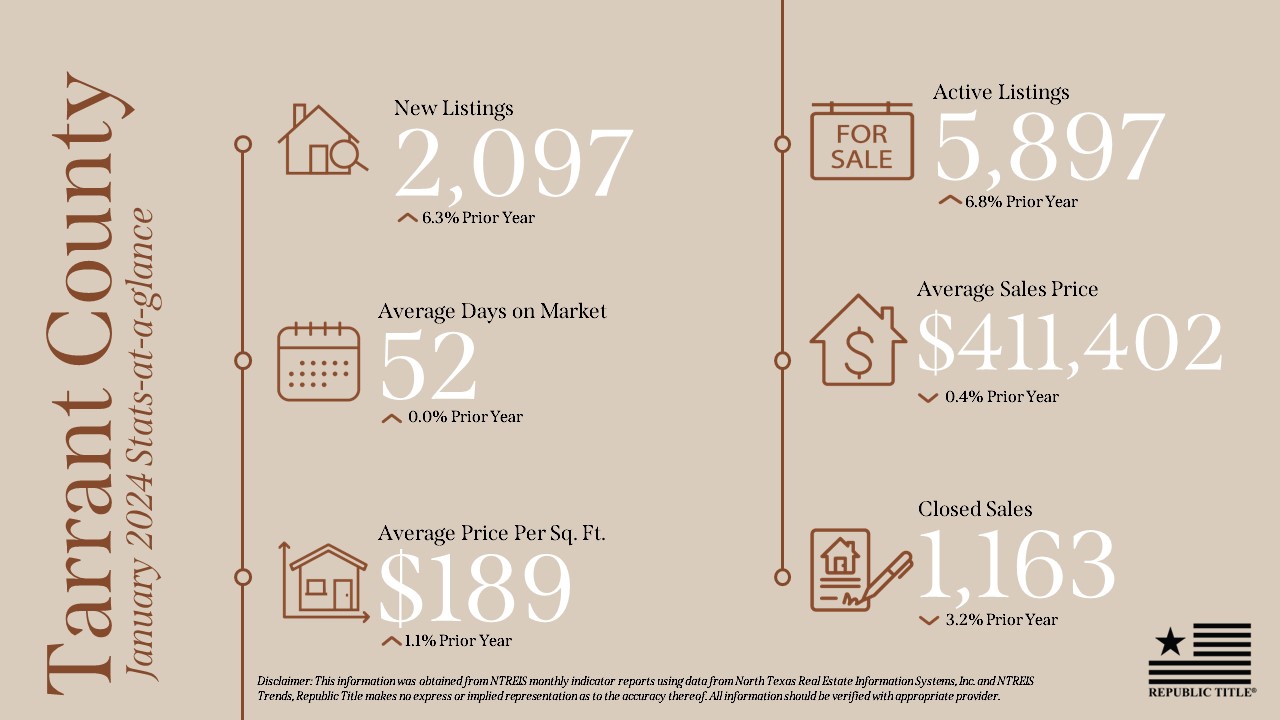
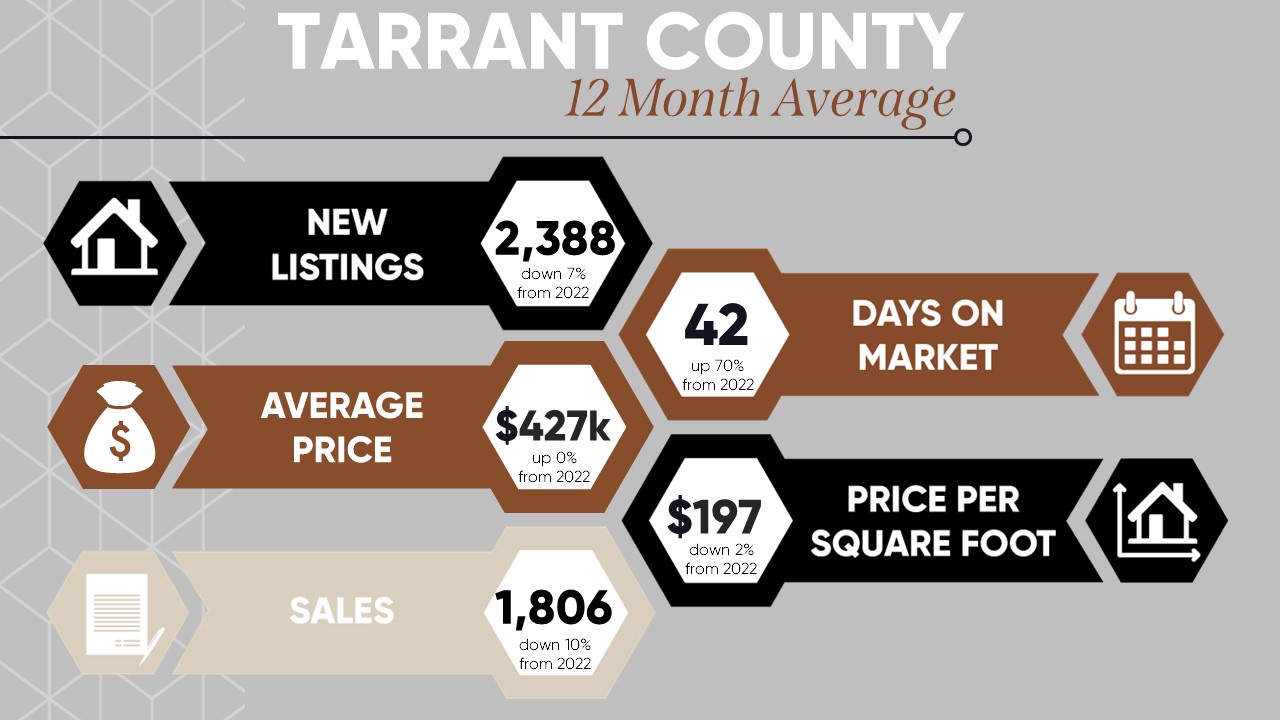
In Tarrant County, new listings increased by 11.9%, and active listings by 30.5%. The DOM was 40 days, a 25% increase from the previous year. The average sales price was $454K, with the price per square foot at $201. Closed sales saw a slight rise of 2.1%, reaching 2,054 units.
Our stats infographics include a year over year comparison and area highlights for single family homes broken down by county. We encourage you to share these infographics and video with your sphere.
For more stats information, pdfs and graphics of our stats including detailed information by county, visit the Resources section on our website at DFW Area Real Estate Statistics | Republic Title of Texas.
For the full report from the Texas A&M Real Estate Research Center and for NTREIS Local Market reports click here.