A Sellers Temporary Leaseback allows the seller to continue living in the home after closing for a limited time. The Seller leaseback begins when the sale is closed and funded and can last for up to 90 days. During this lease term the Seller is the tenant and the Buyer is now the landlord.
Join Republic Title’s Sarah Mann and Shaun Neidigh as they discuss:
– What is a Sellers Leaseback?
– What are the other terms that are negotiated?
– Additional considerations when negotiating a leaseback
In our newest video, Republic Title’s Sheri Groom and Matt Visinsky discuss what you need to know about homestead exemptions. A homestead is a house or other residential structure that is used for residential purposes. To qualify for homestead in Texas the owner must be an individual (a corporation or other business entity cannot have a homestead), and use the home as his or her principal residence.
Listen in as Republic Title’s Sheri Groom and Matt Visinsky explain:
What is a homestead?
What are some of the benefits and protections of homesteads?
Who can apply for a homestead exemption?
For more informative videos from the Republic Title Legal Team, check out our YouTube channel: https://youtu.be/OHUe02-4c4c
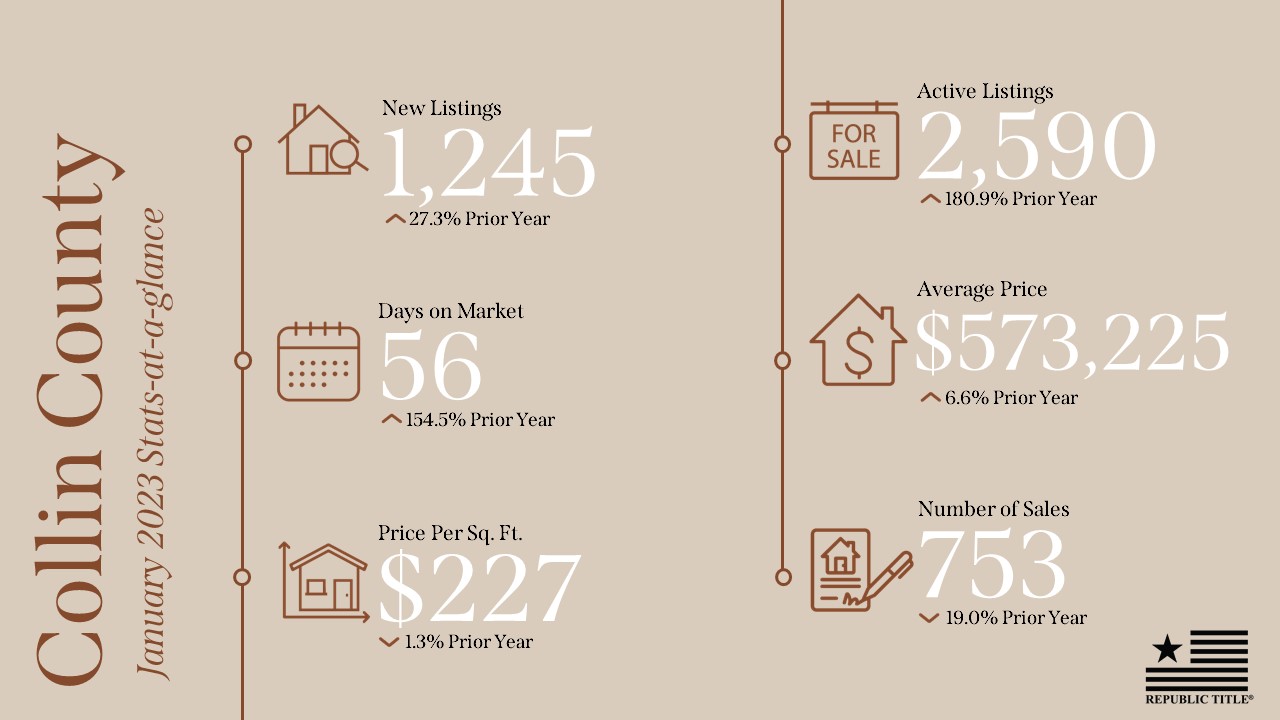
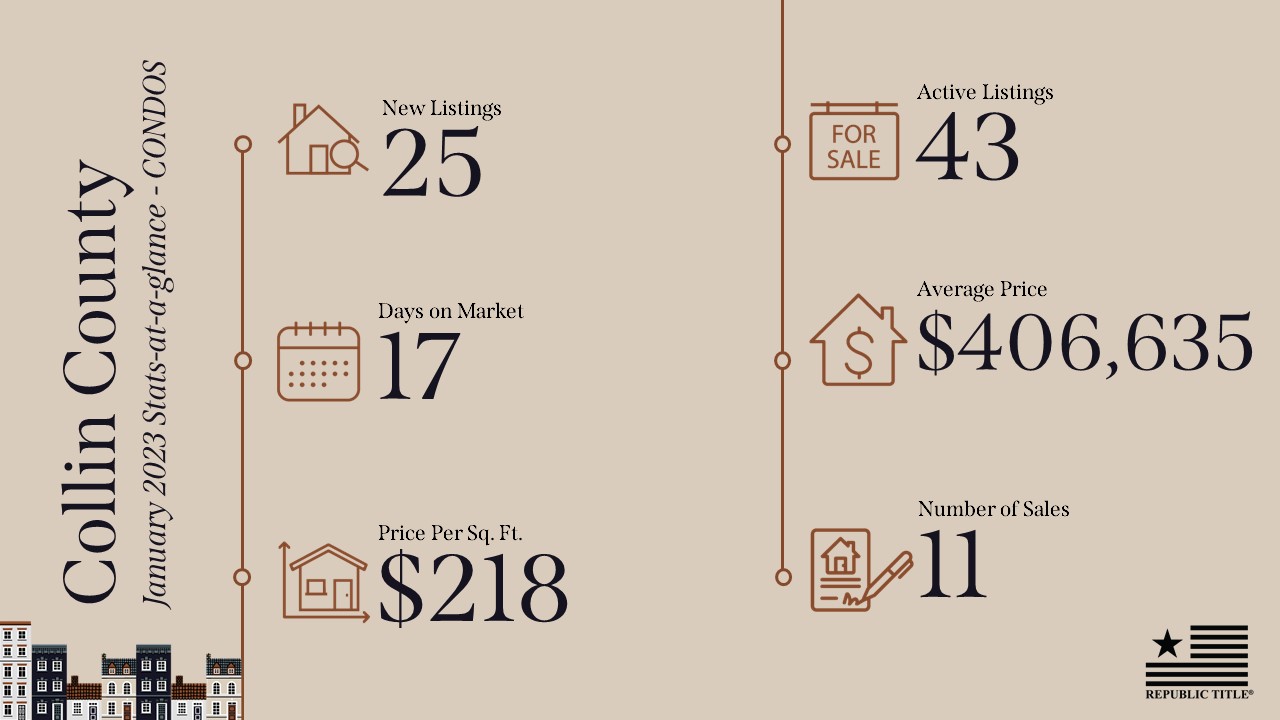
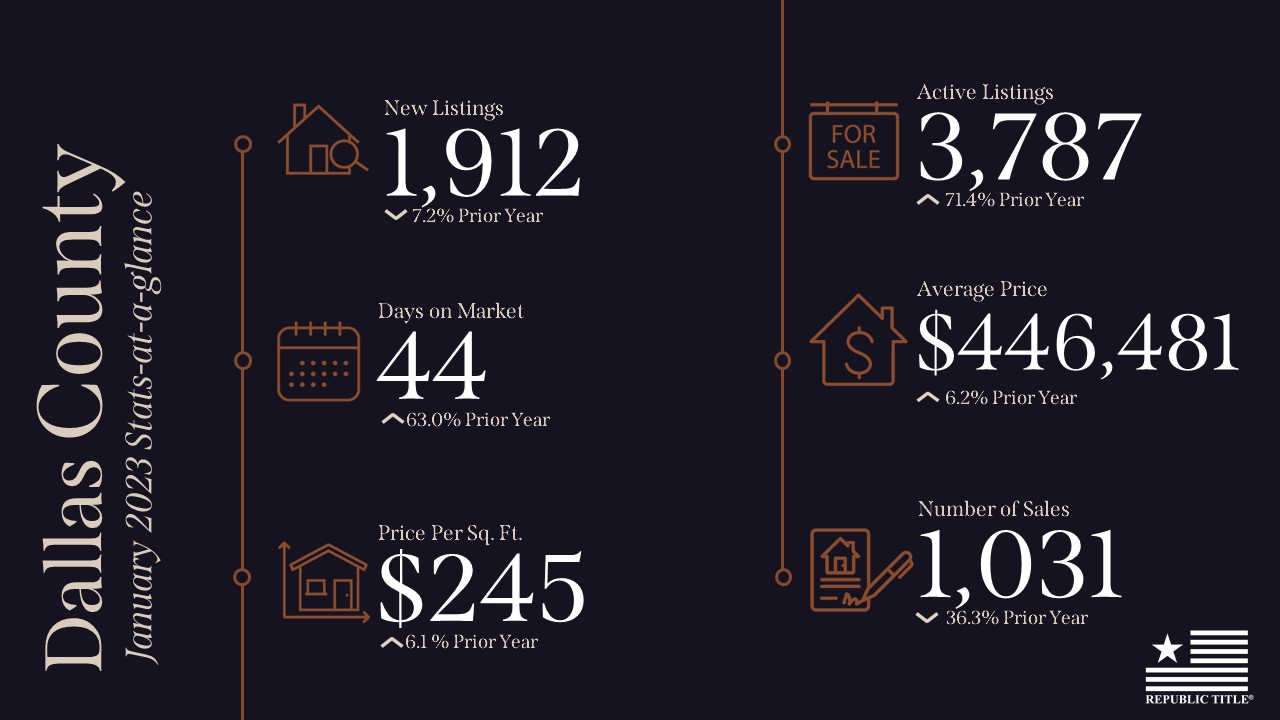
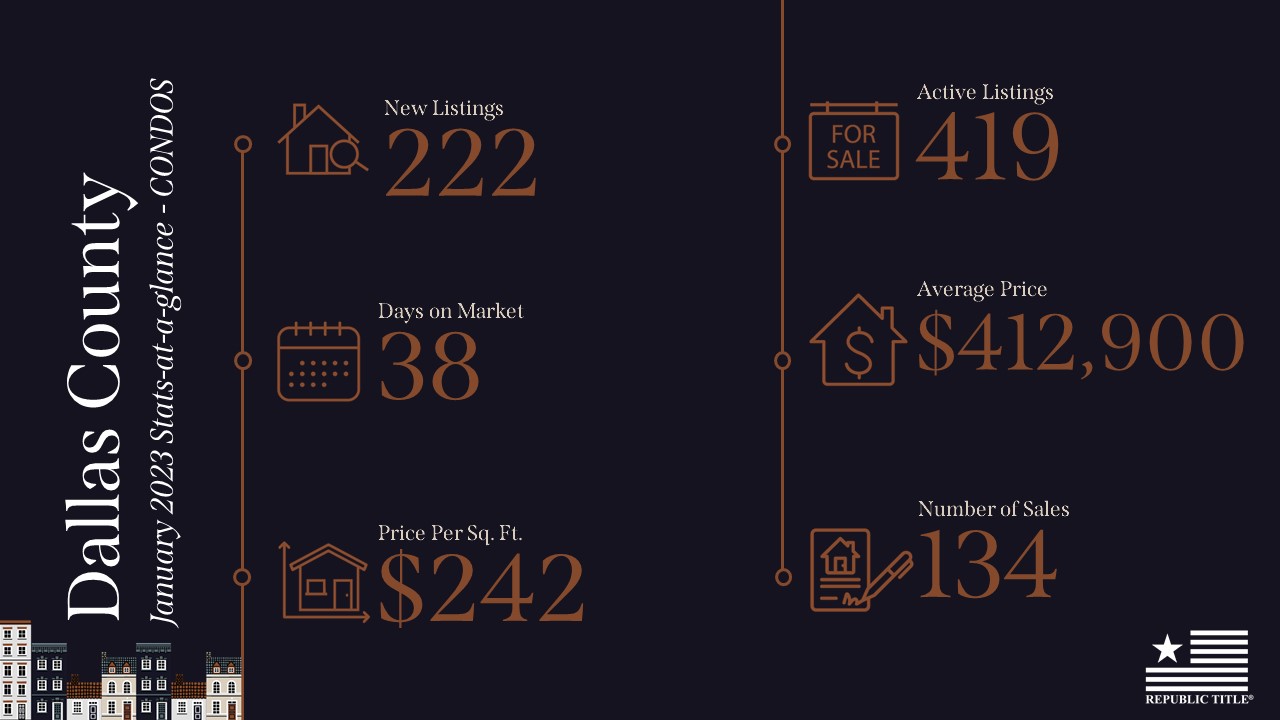
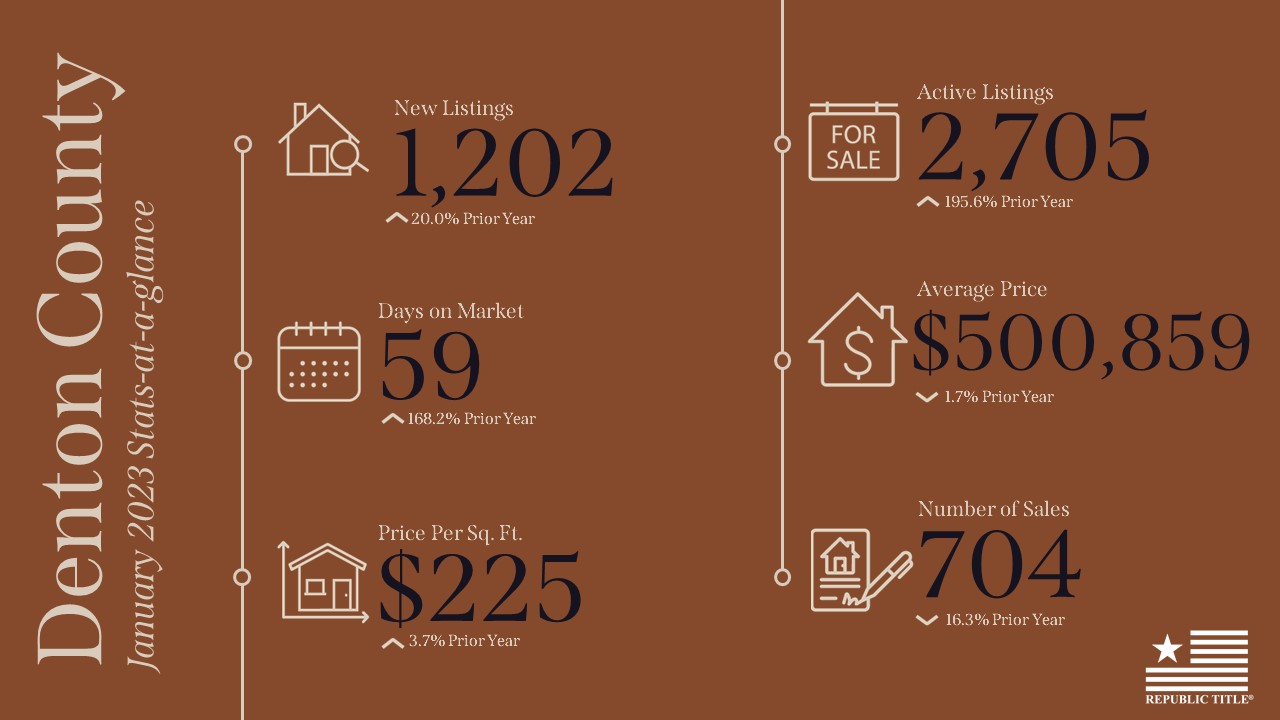
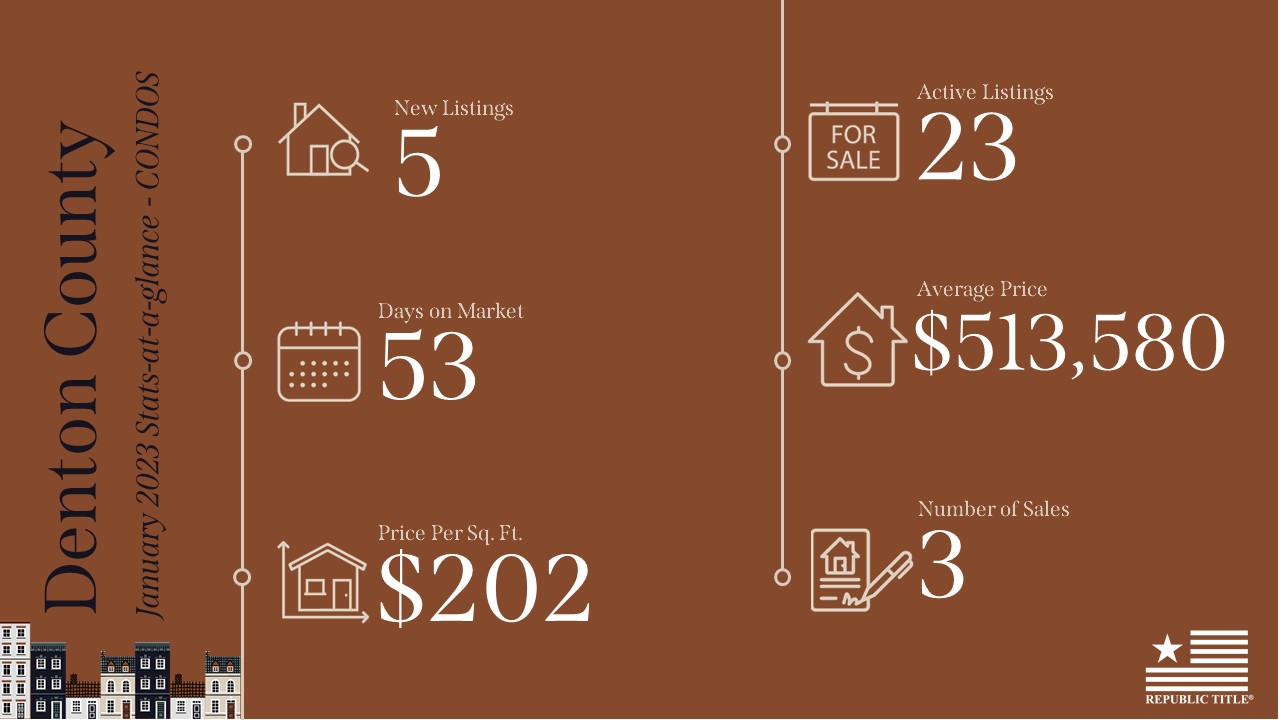
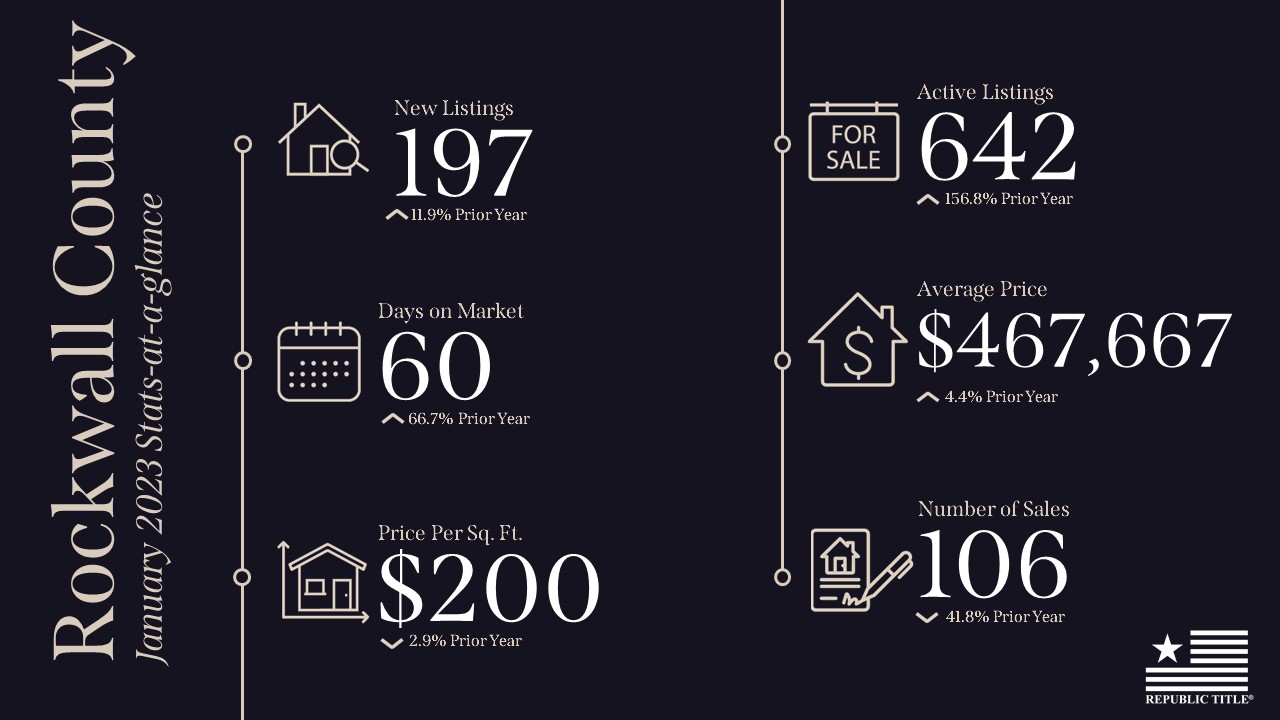
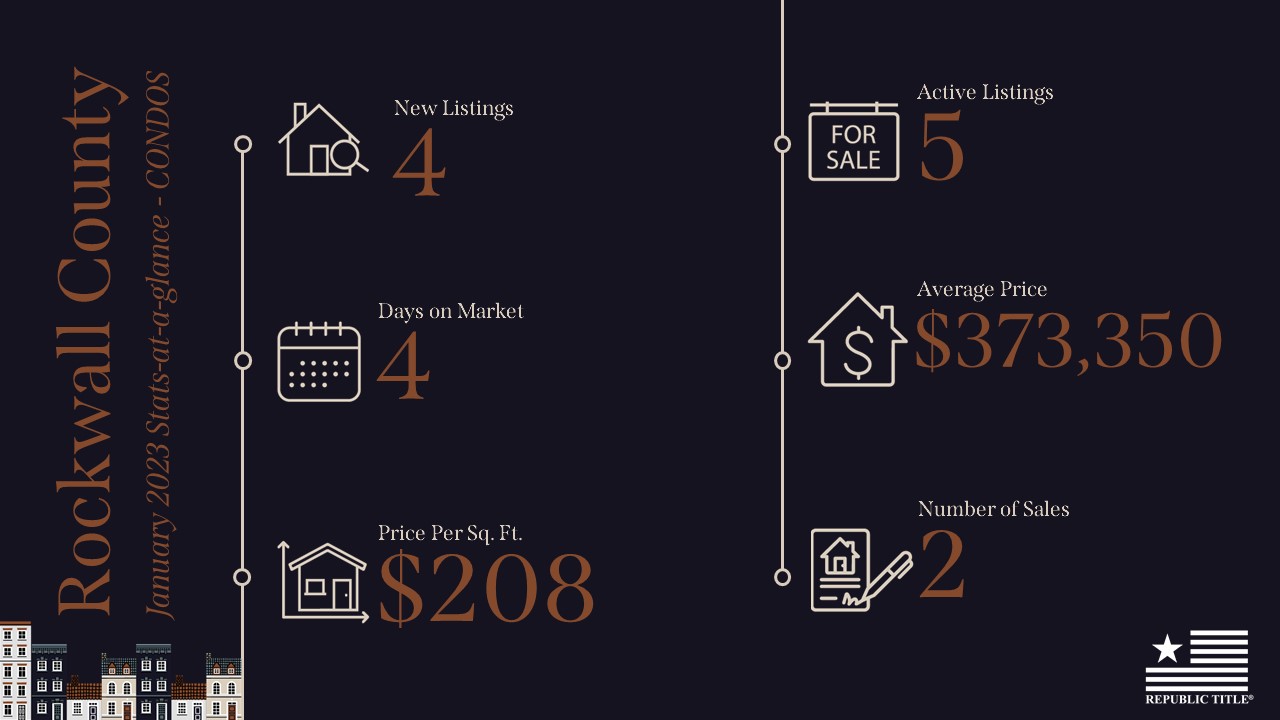
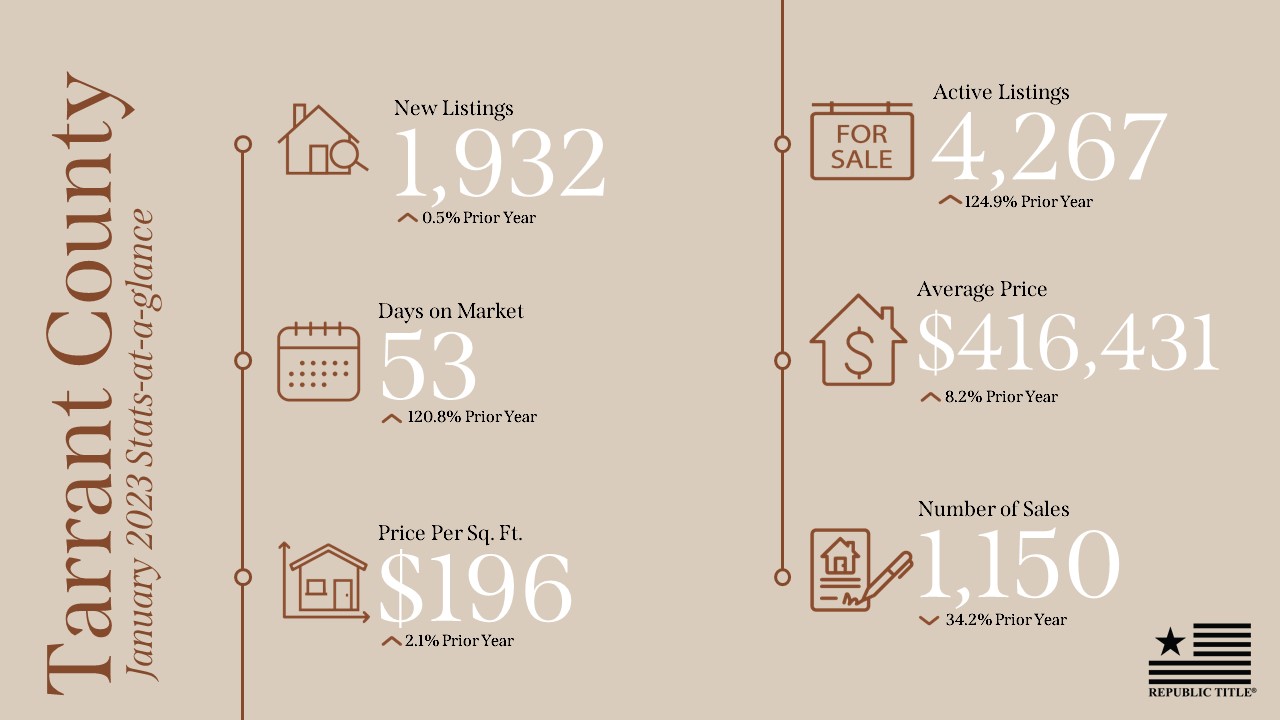
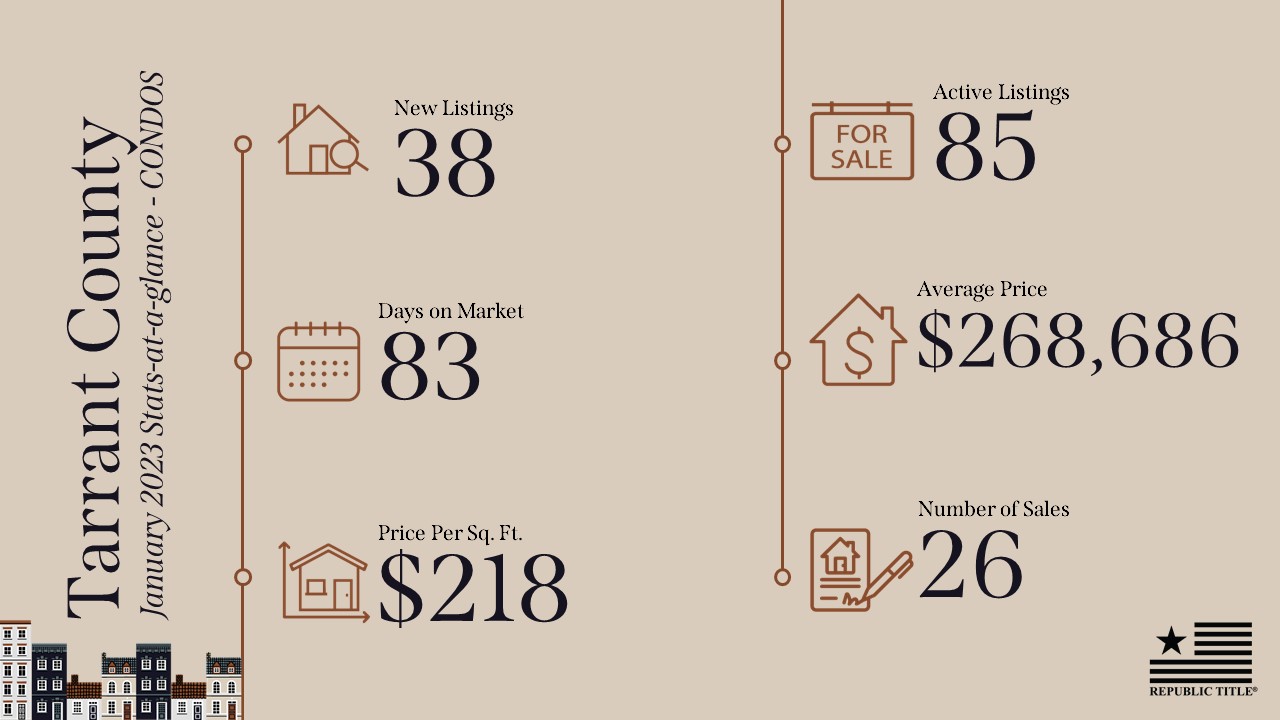
In January 2023, new listings are up in all North Texas counties that we report on over December 2022 so the much-needed inventory is coming to market.
Active listings are up across the board compared to this time last year ranging from 71% increase in Dallas County to 195% increase in Denton County. Compared to January 2022, average sales price has increased in each county except Denton which was down slightly.
Dallas is expected to be the top buyer’s market in the nation by year-end 2023 so all eyes are on the Spring selling season!
Our stats infographics include a year over year comparison and area highlights for single family homes broken down by county. We encourage you to share these infographics and video with your sphere.
Our second annual stats report of the DFW real estate market is here!
We’ve taken our monthly stats-at-a-glance reports from January through December of 2022, totaled, averaged, and compared the data to the numbers from 2021. The result is an annual report of the DFW real estate market in 2022.
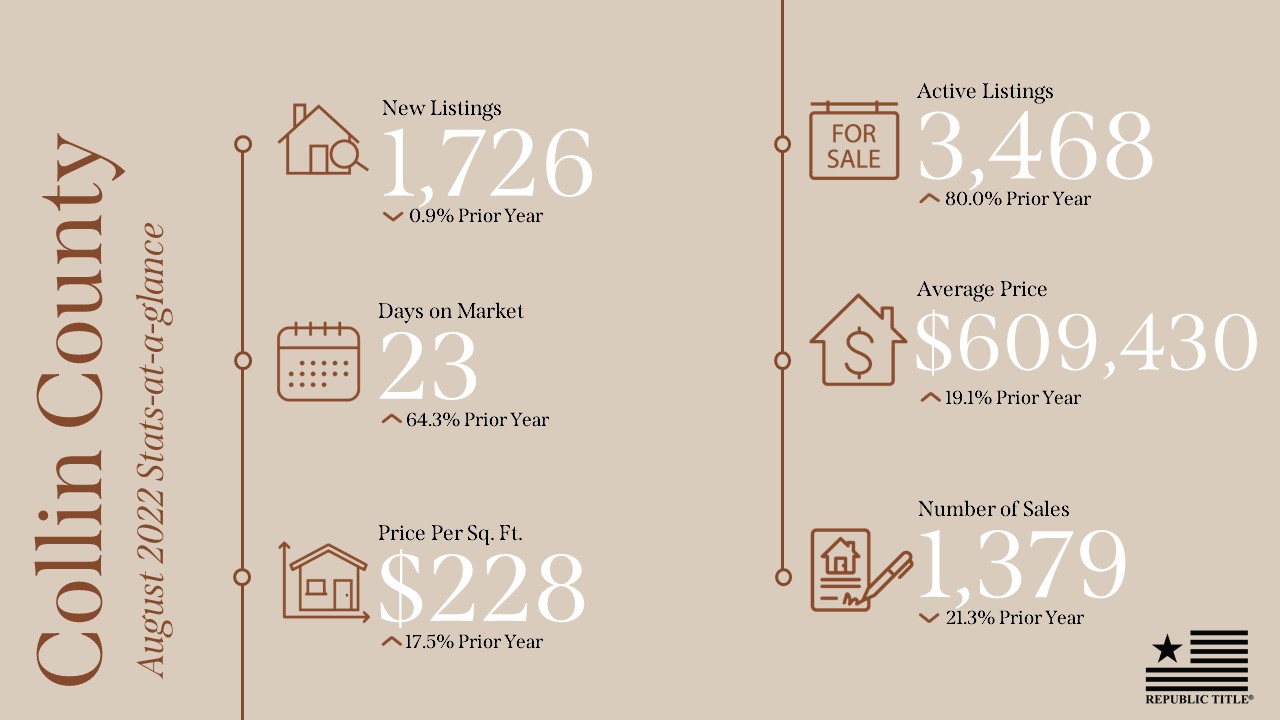
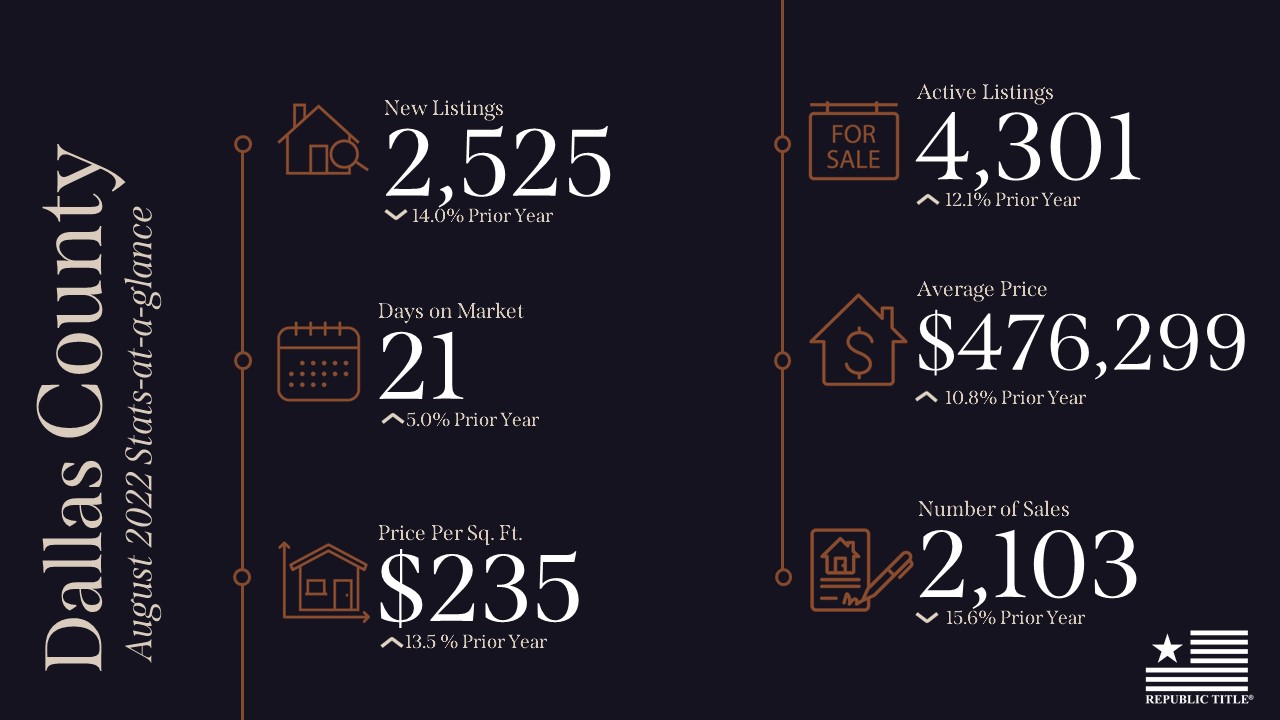
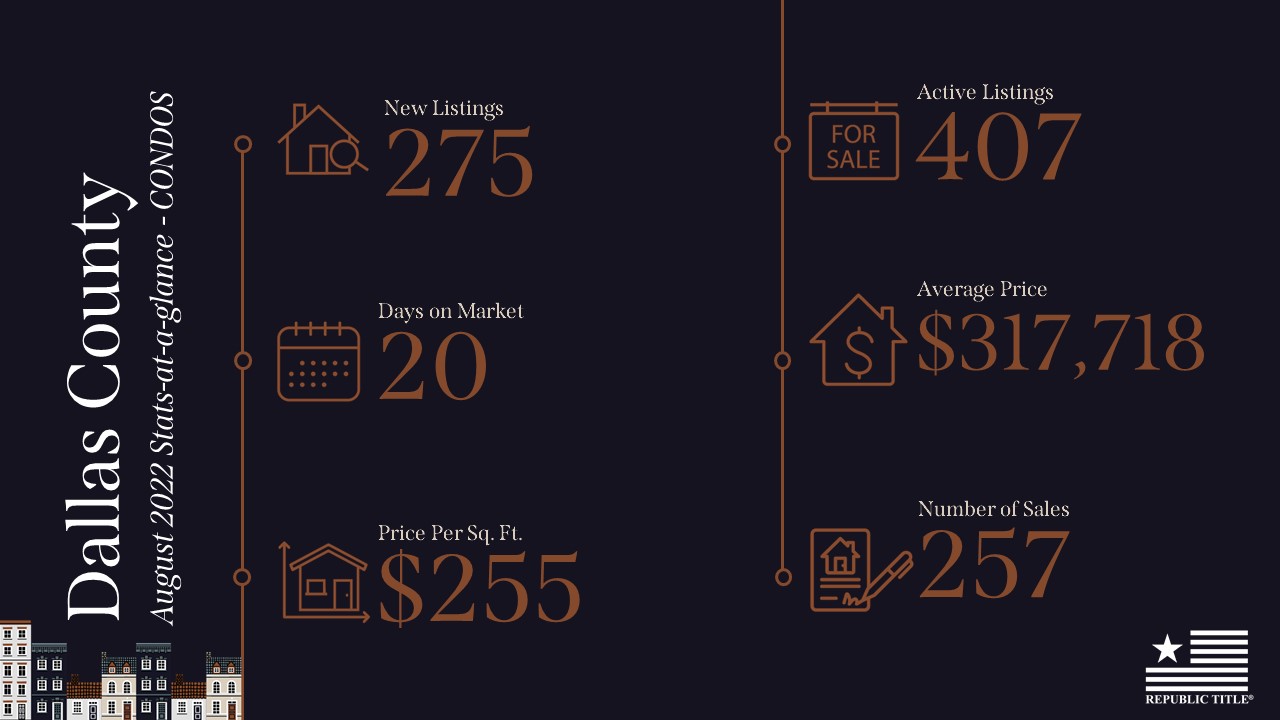
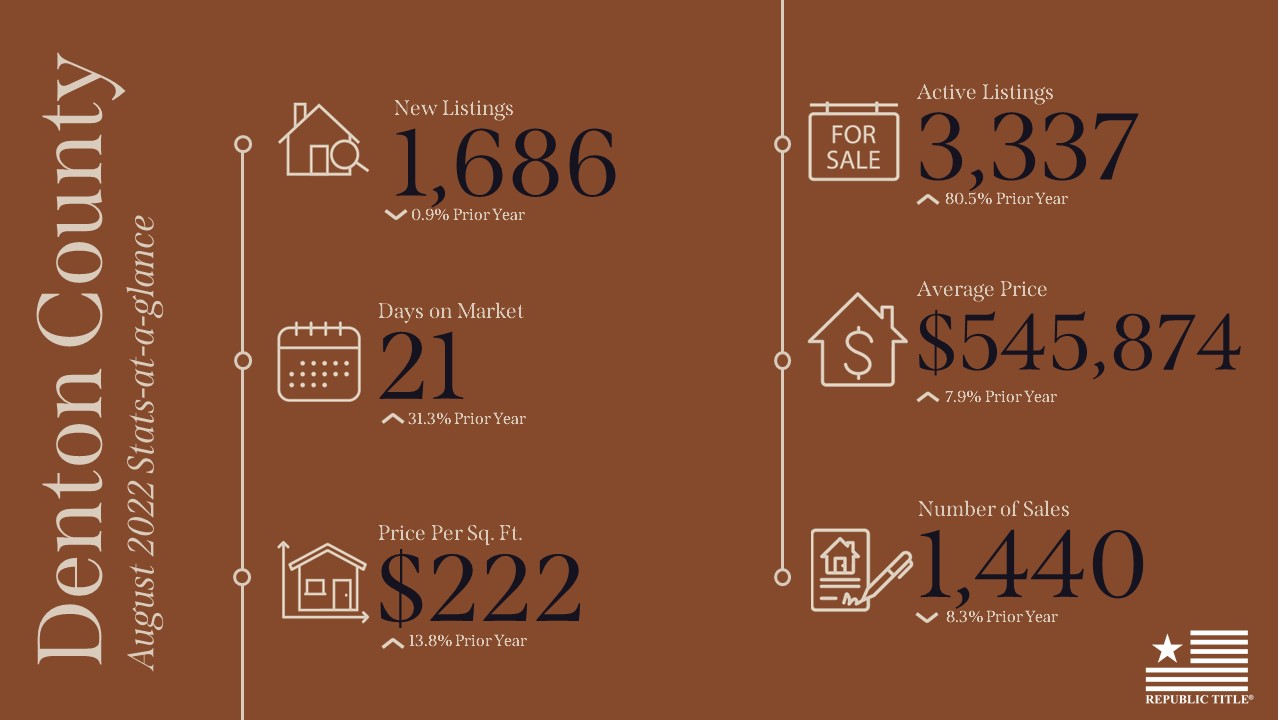
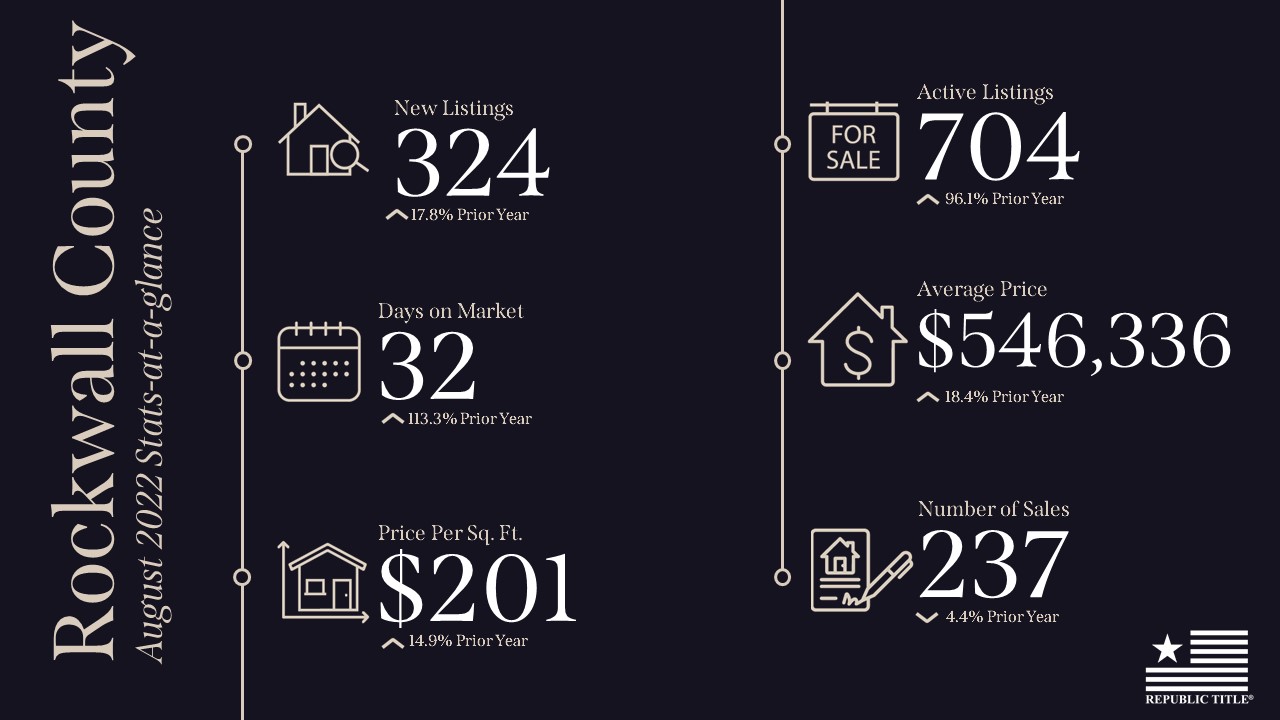
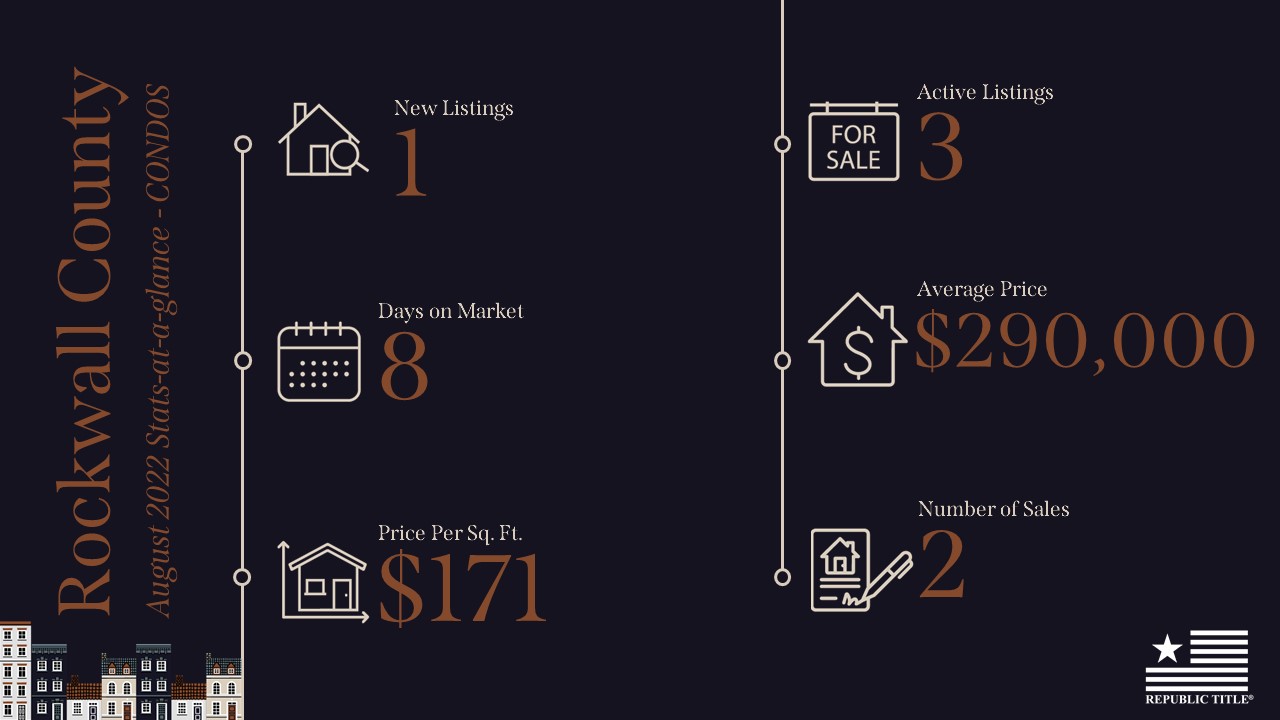
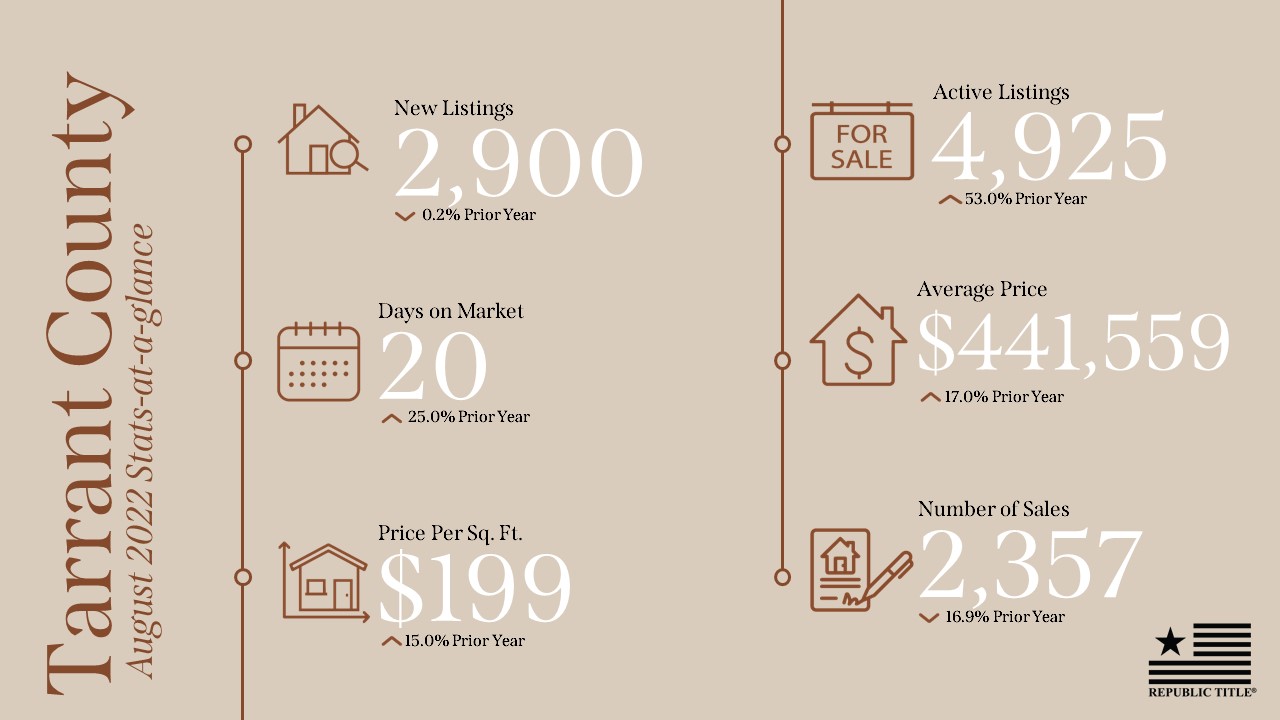
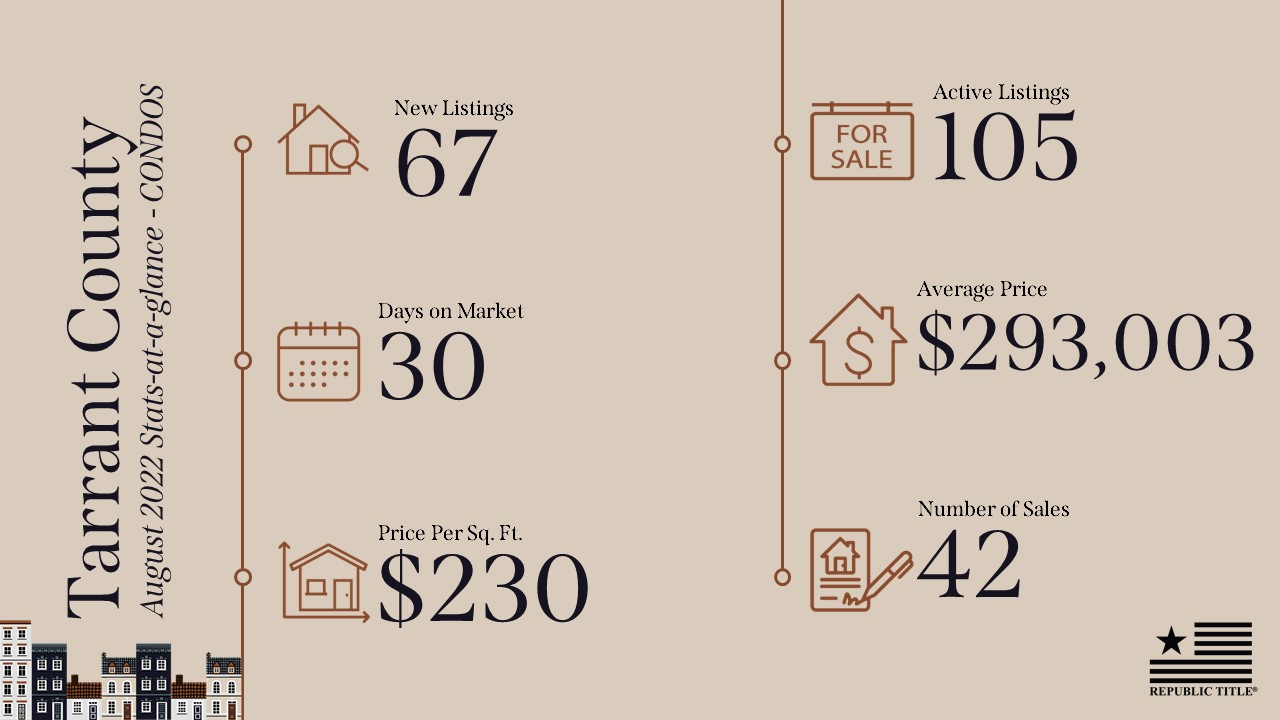
August 2022 Stats are IN! Here are the highlights! In Collin County New listings are slightly down, while Active listings are up quite a bit from last year. The days on market, average sales price and price per square foot are also up as we are all aware, with the actual number of sales down about 21% from 2021. In Dallas County, the new listings are also down slightly with Active listings up with similar percentages to Collin County. The days on market, average sales price and price per square foot are also up in Dallas with the number of sales down about 15% from last year. The statistics are about the same in Denton and Rockwall counites as you can see. In summary, while the market is definitely slower than 2021, we are still experiencing a shortage of homes for sale in the entire metroplex which makes it a great time be in the business in North Texas! Happy sharing and selling!
Our stats infographics include a year over year comparison and area highlights for single family homes broken down by county. We encourage you to share these infographics and video with your sphere.
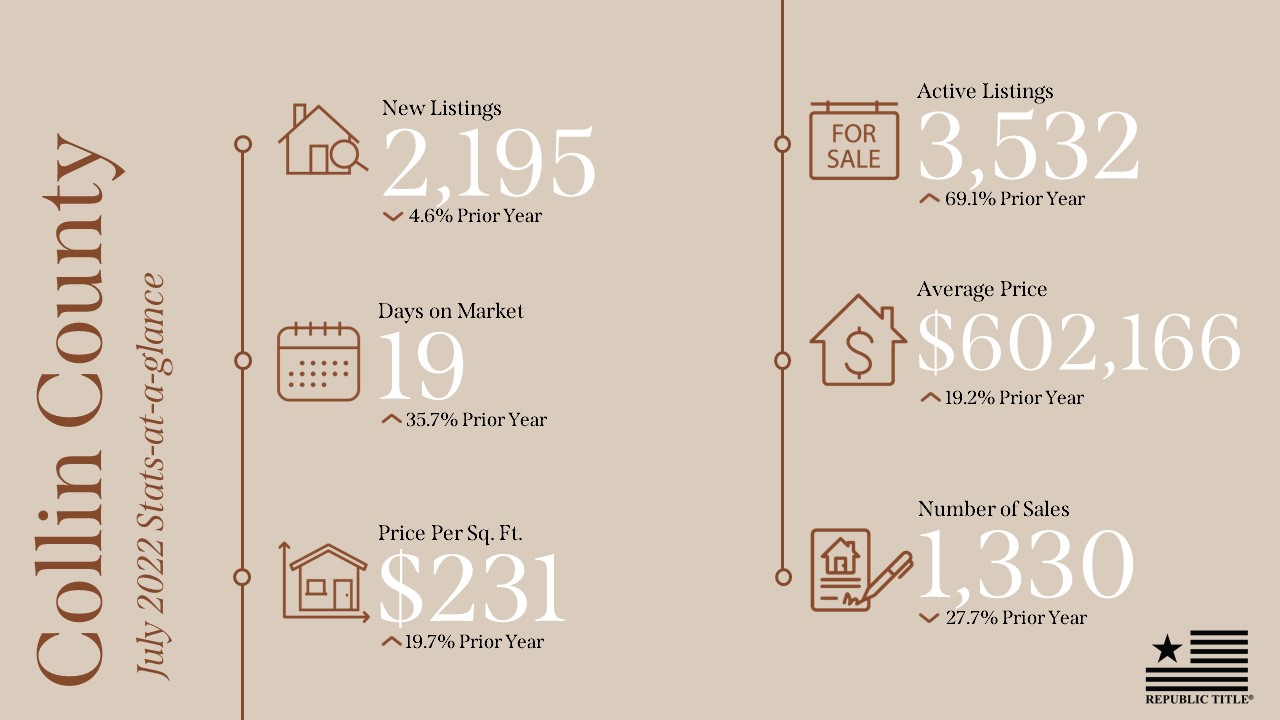
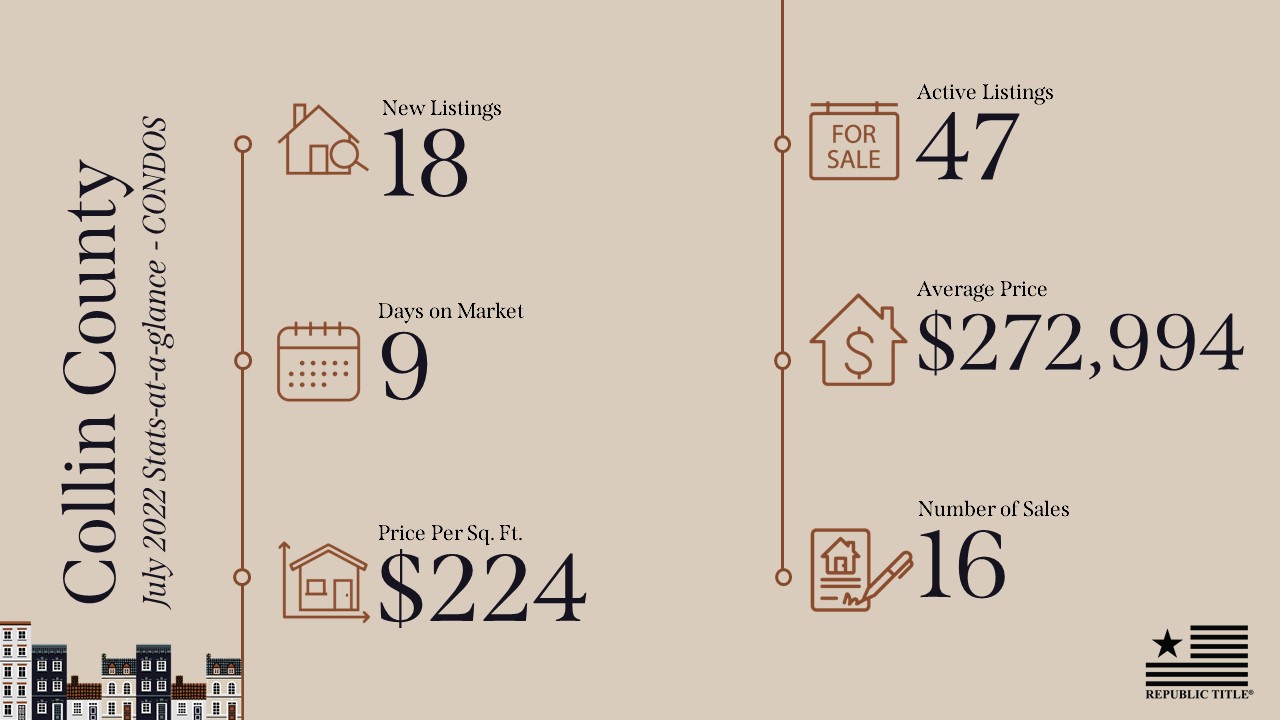
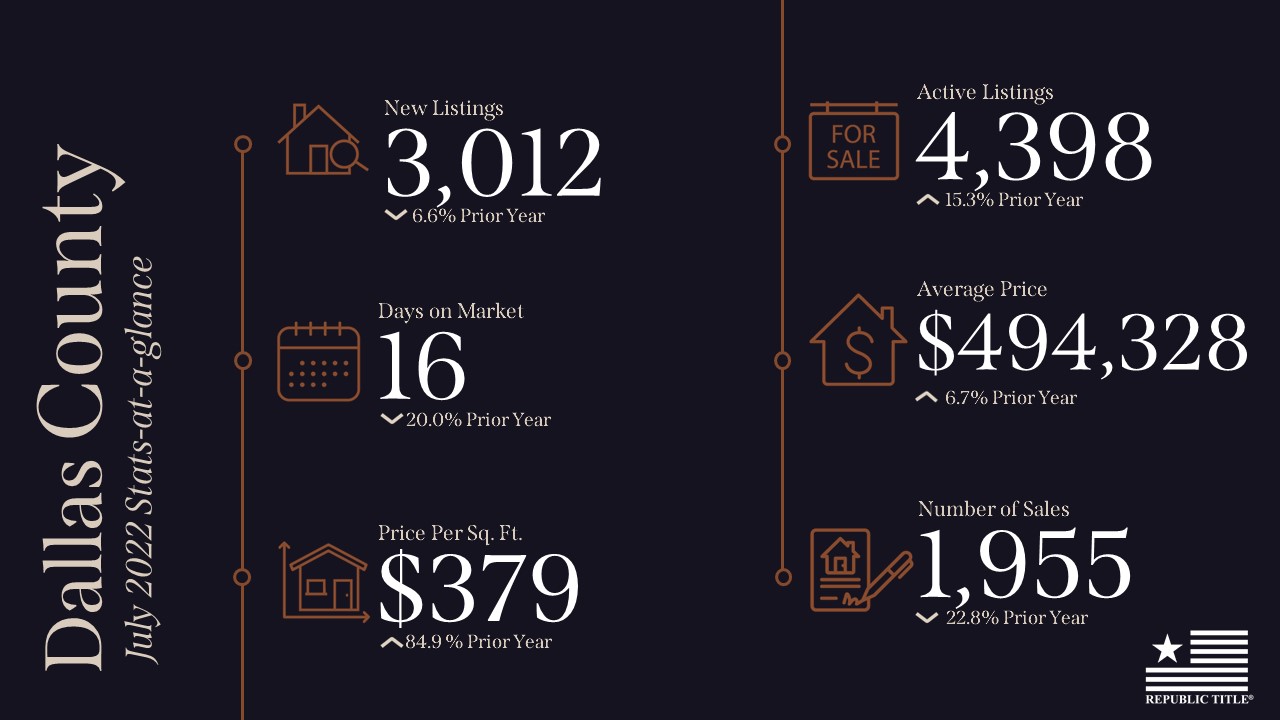
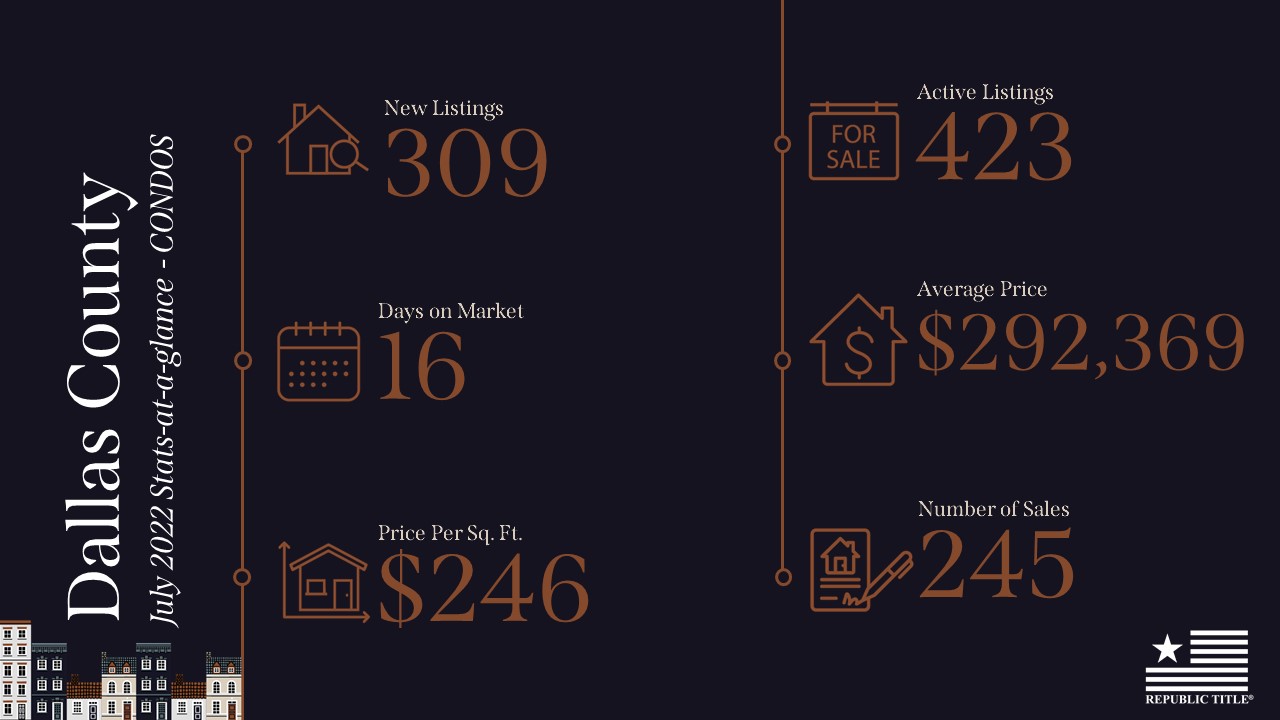
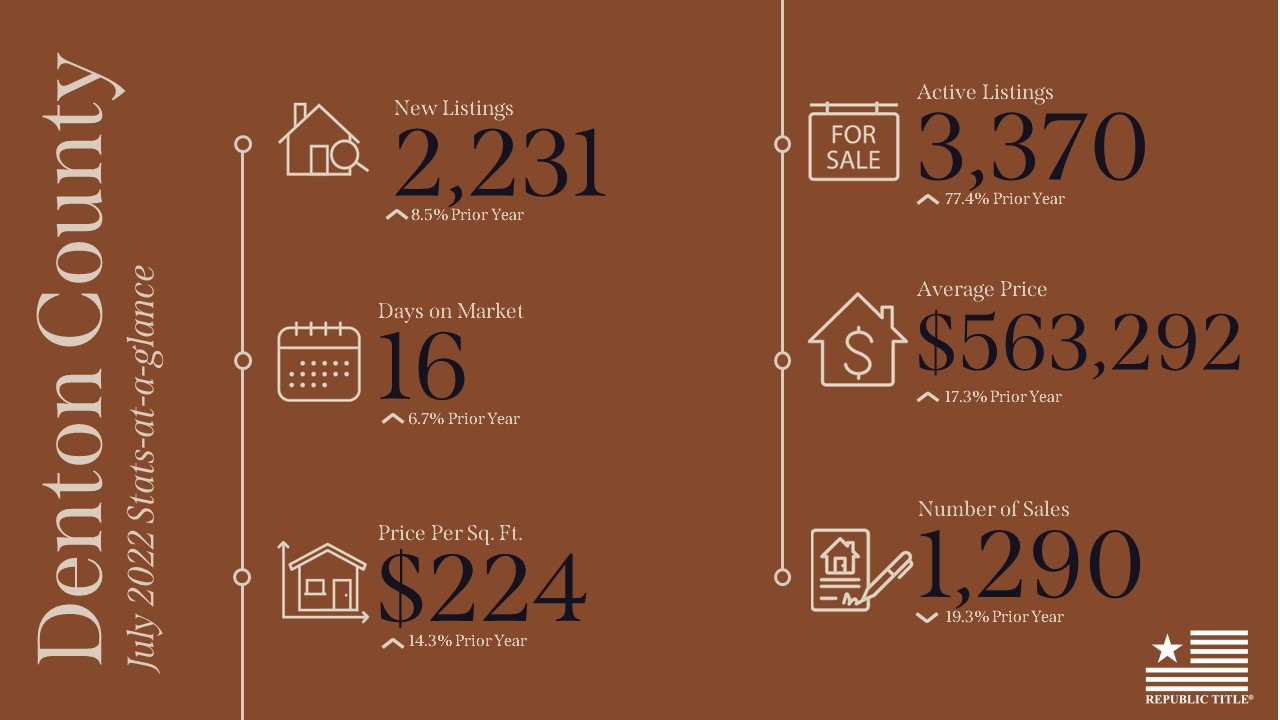
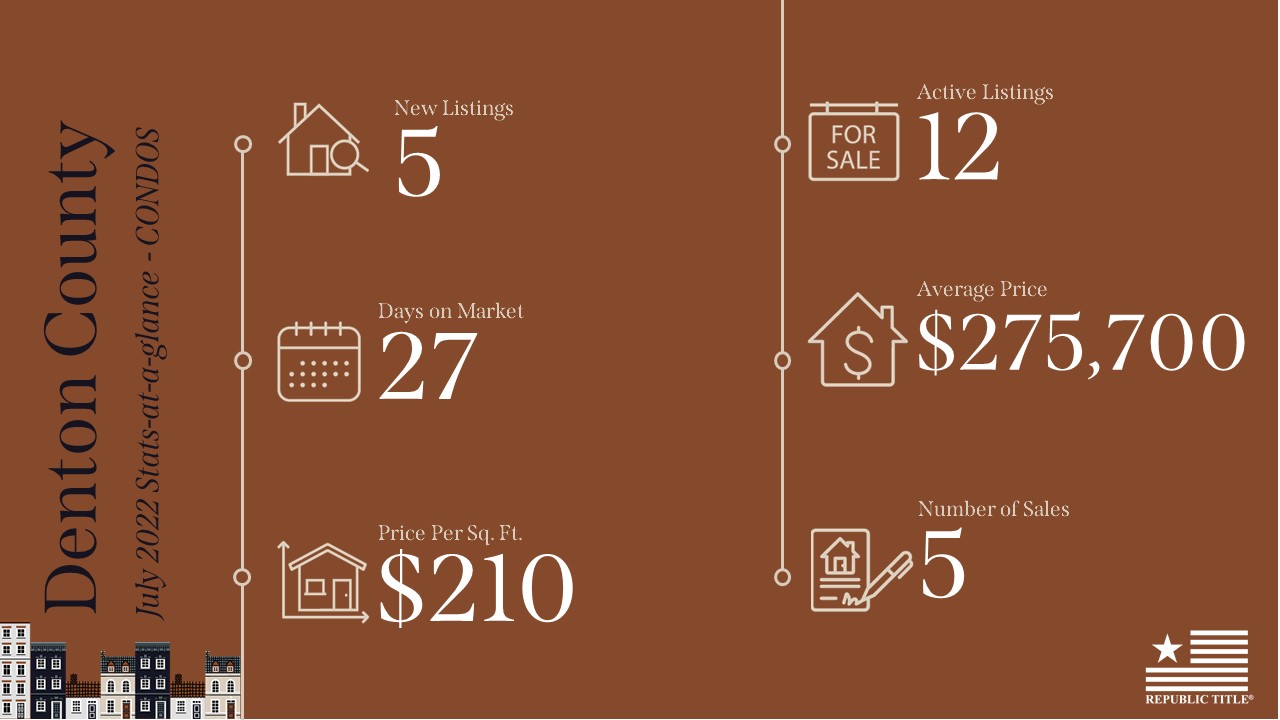
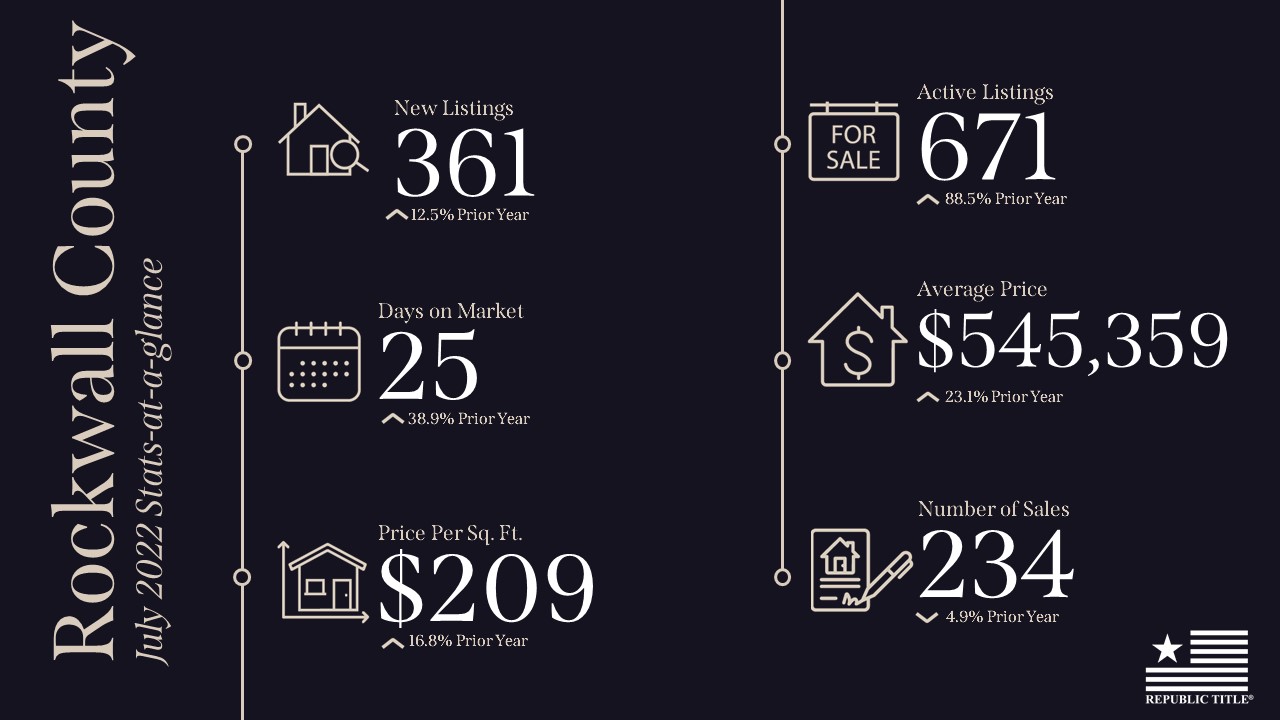
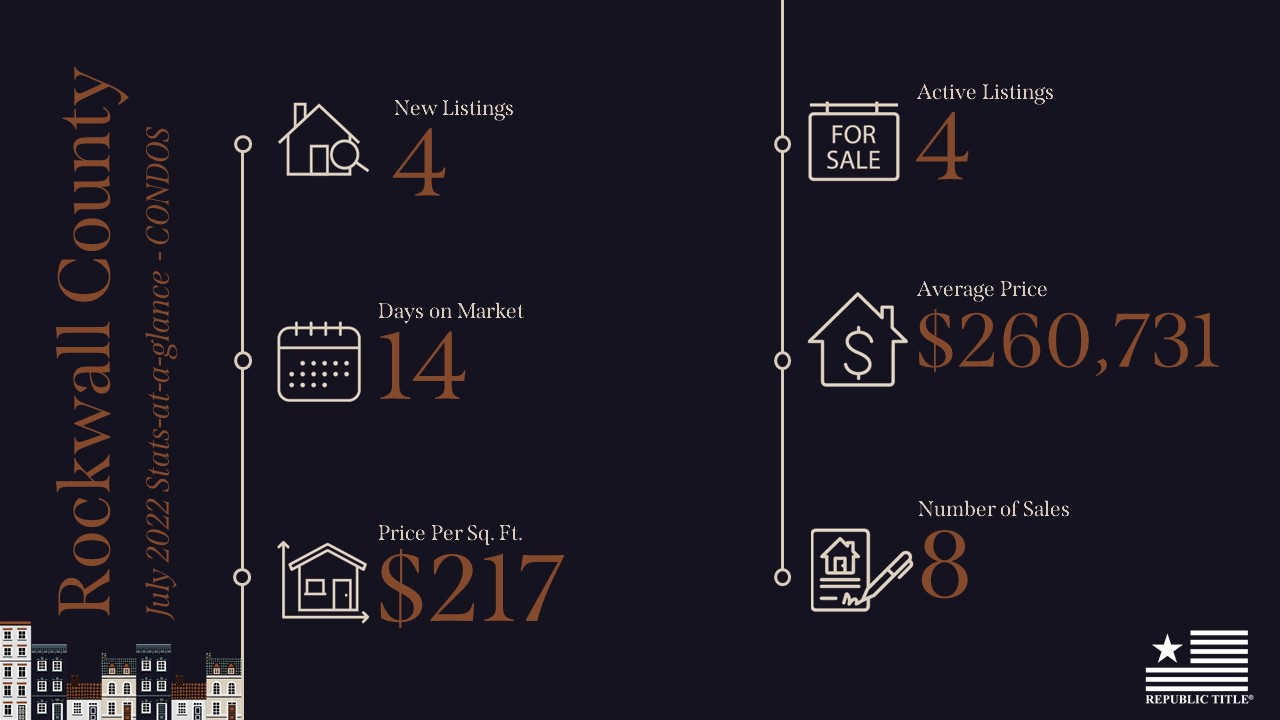
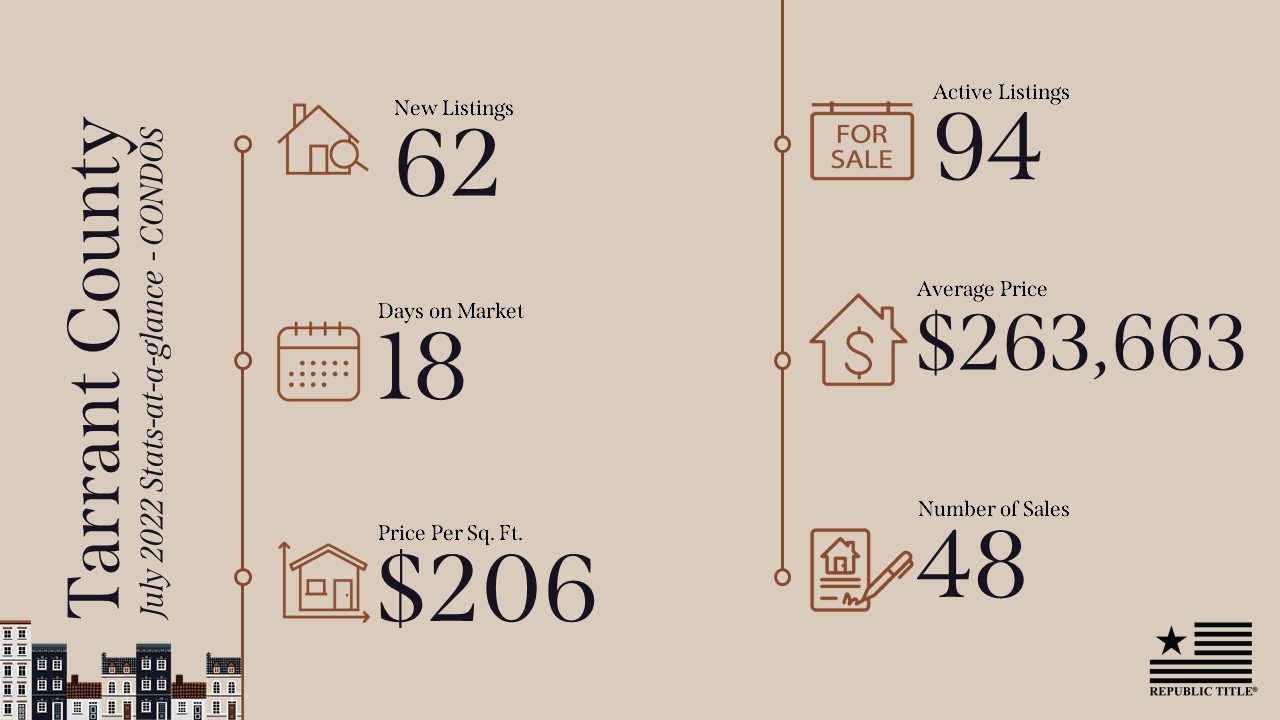
Home prices continue to increase in North Texas! Collin County leads the pack with an average price of $602,166 which is up 19.2% over July 2021. According to a report from Texas Realtors, house prices are climbing faster in North Texas than they are in any other Texas metro area. The good news is that active listings are also up in each county including 3,532 active listings in Collin County (up 69.1% over July 2021) to 3,370 active listings in Denton County (up 77.4% over July 2021).
Our stats infographics include a year over year comparison and area highlights for single family homes broken down by county. We encourage you to share these infographics and video with your sphere.
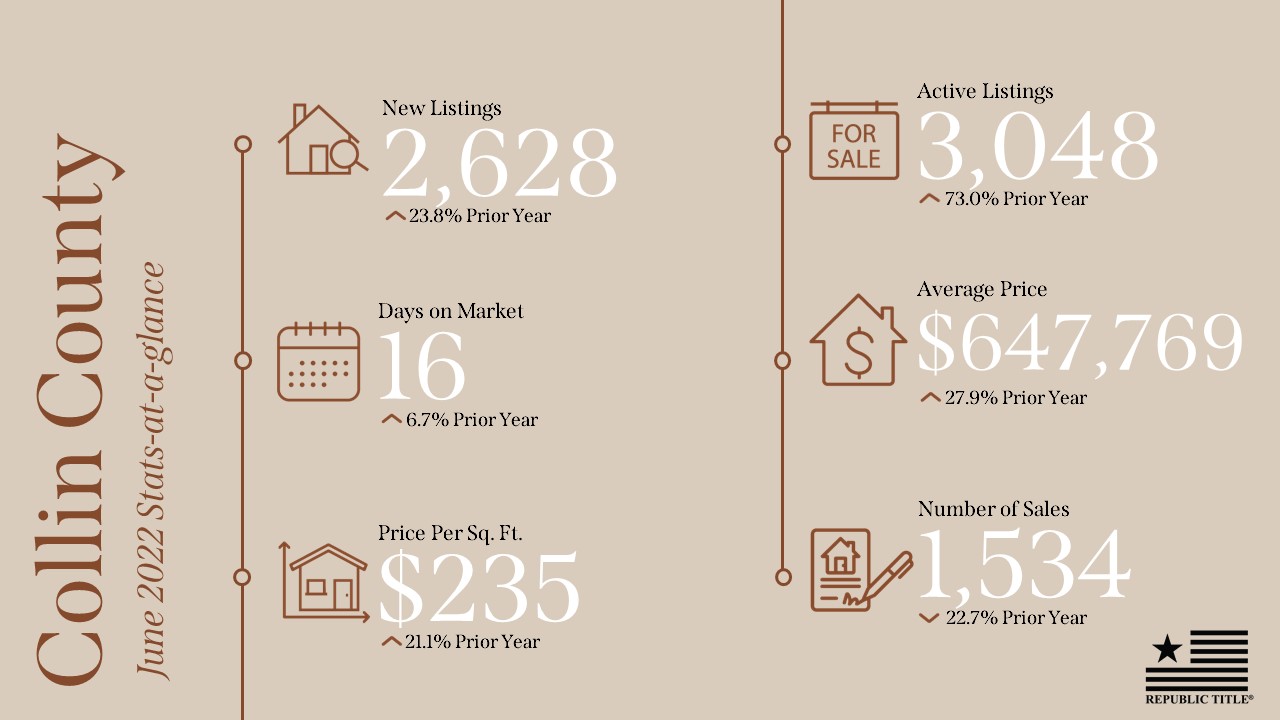
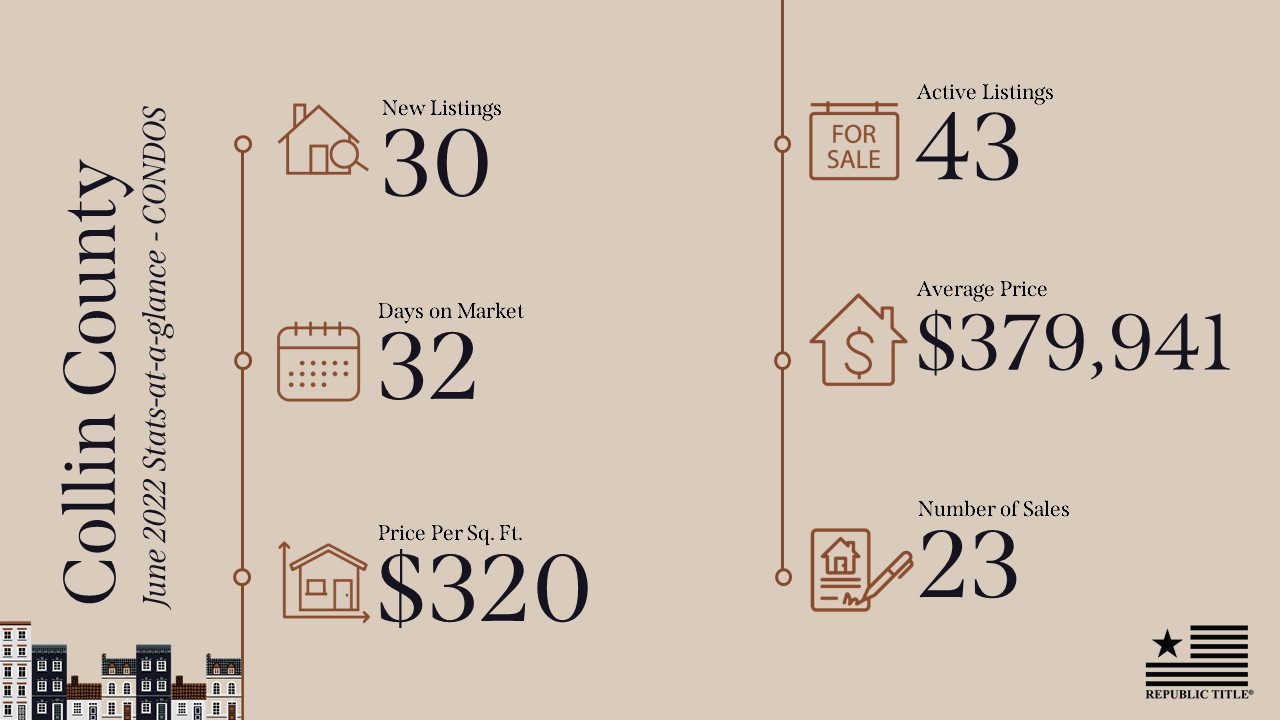
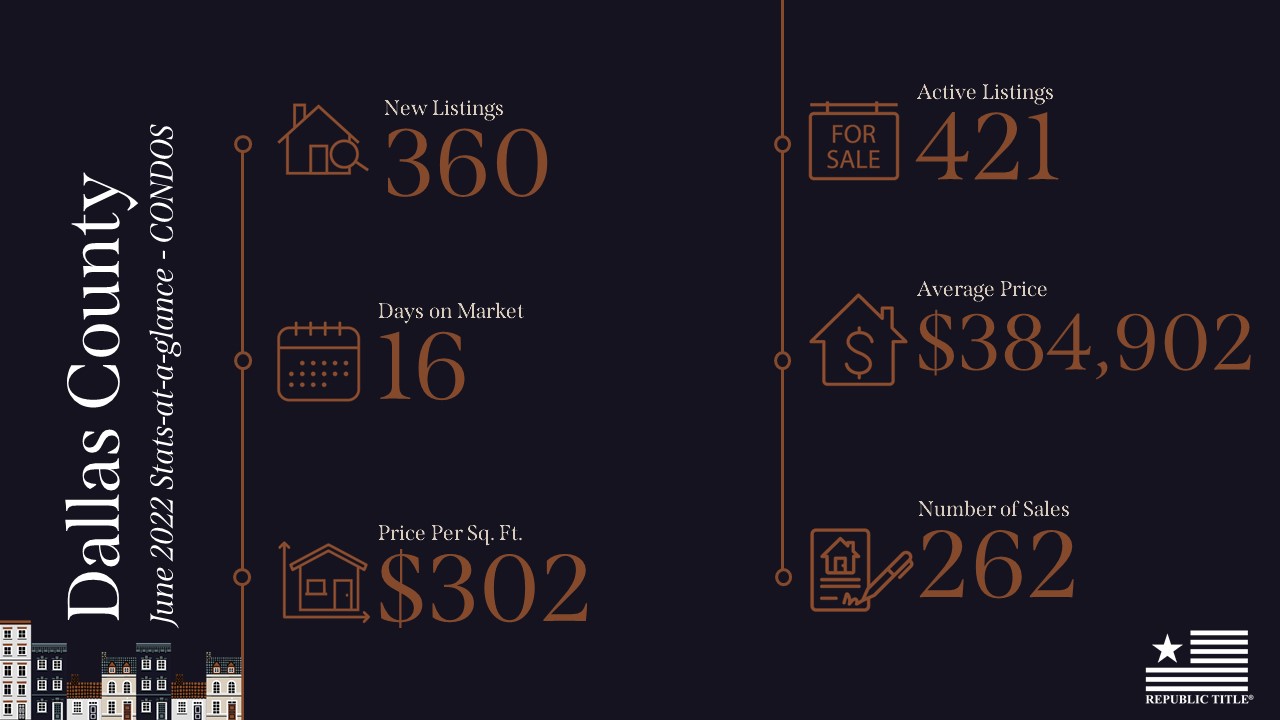
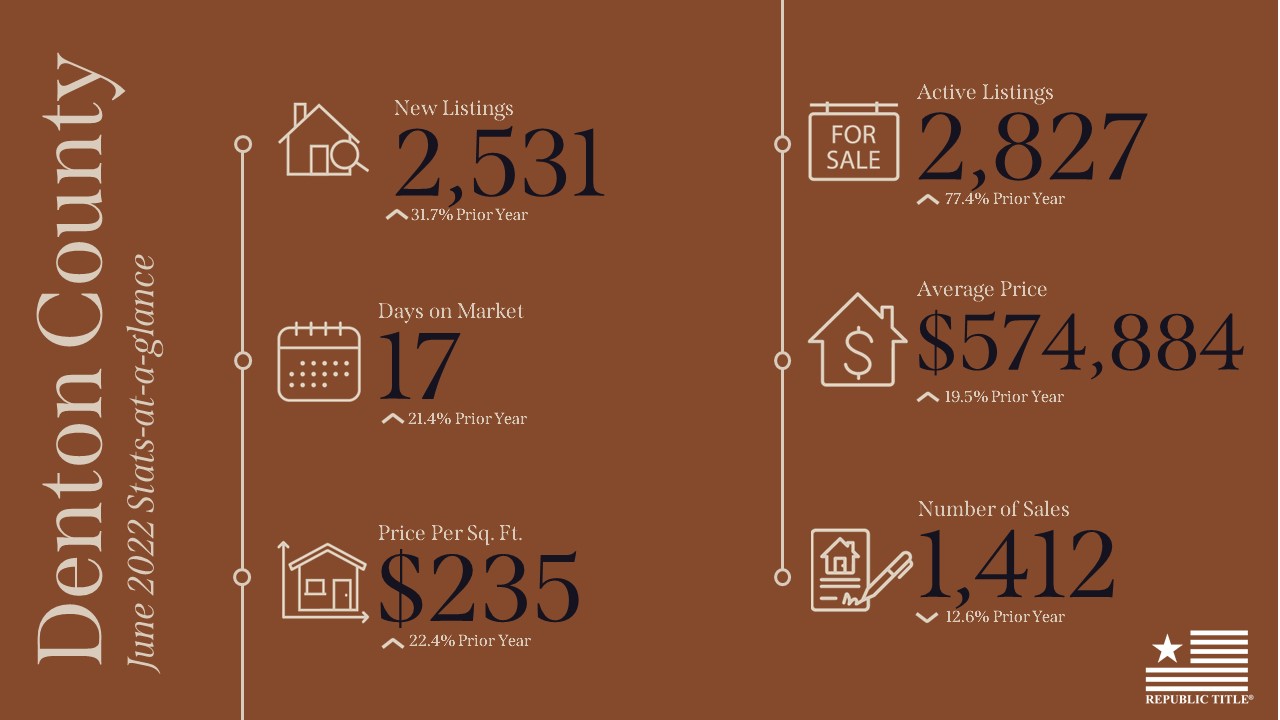
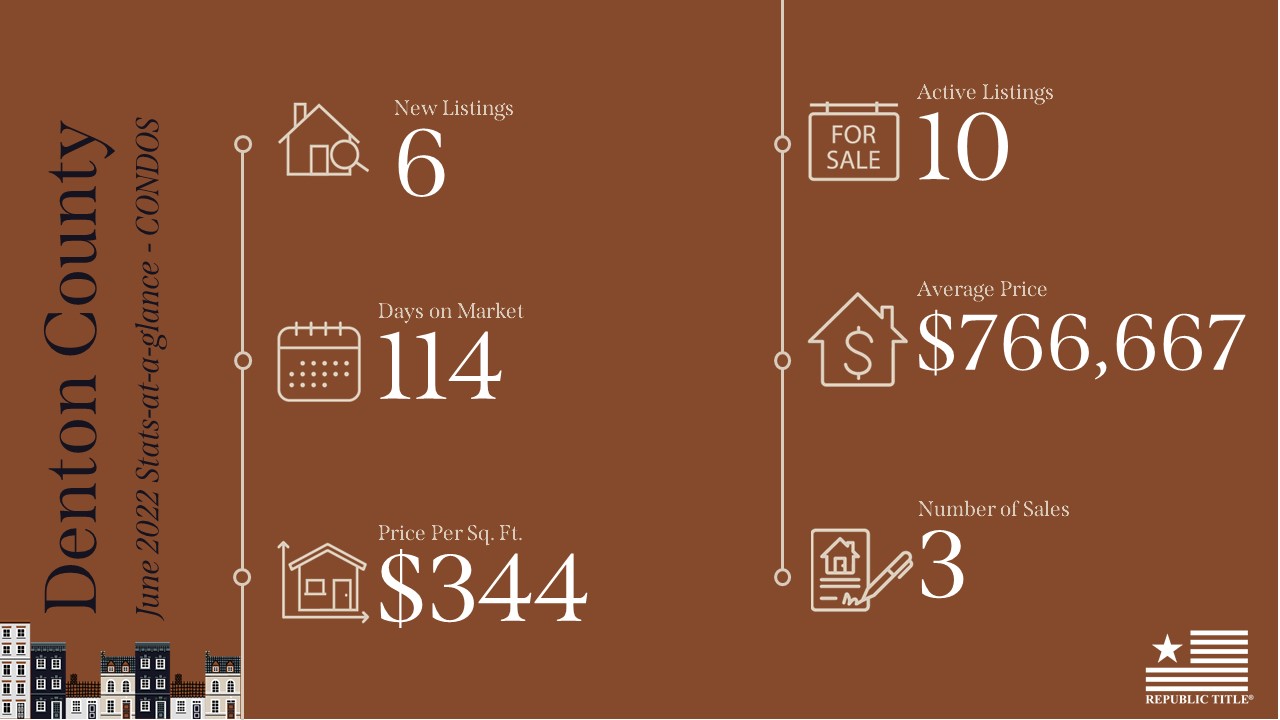
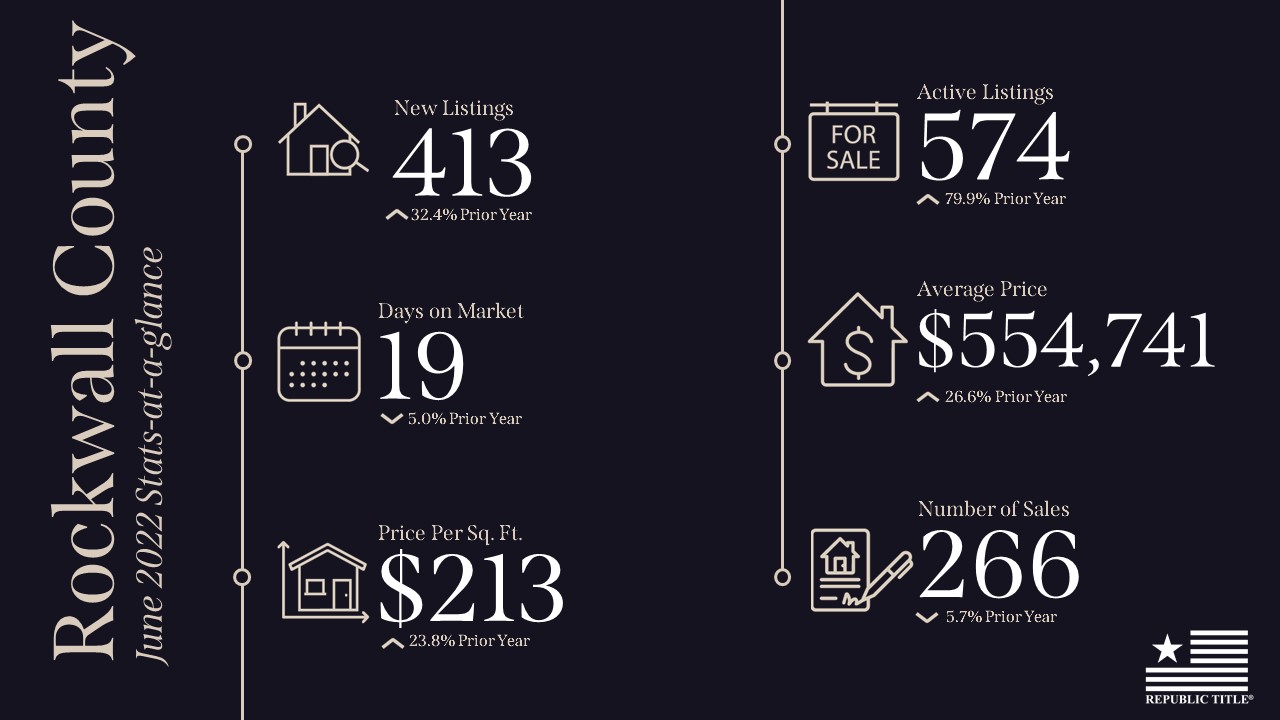
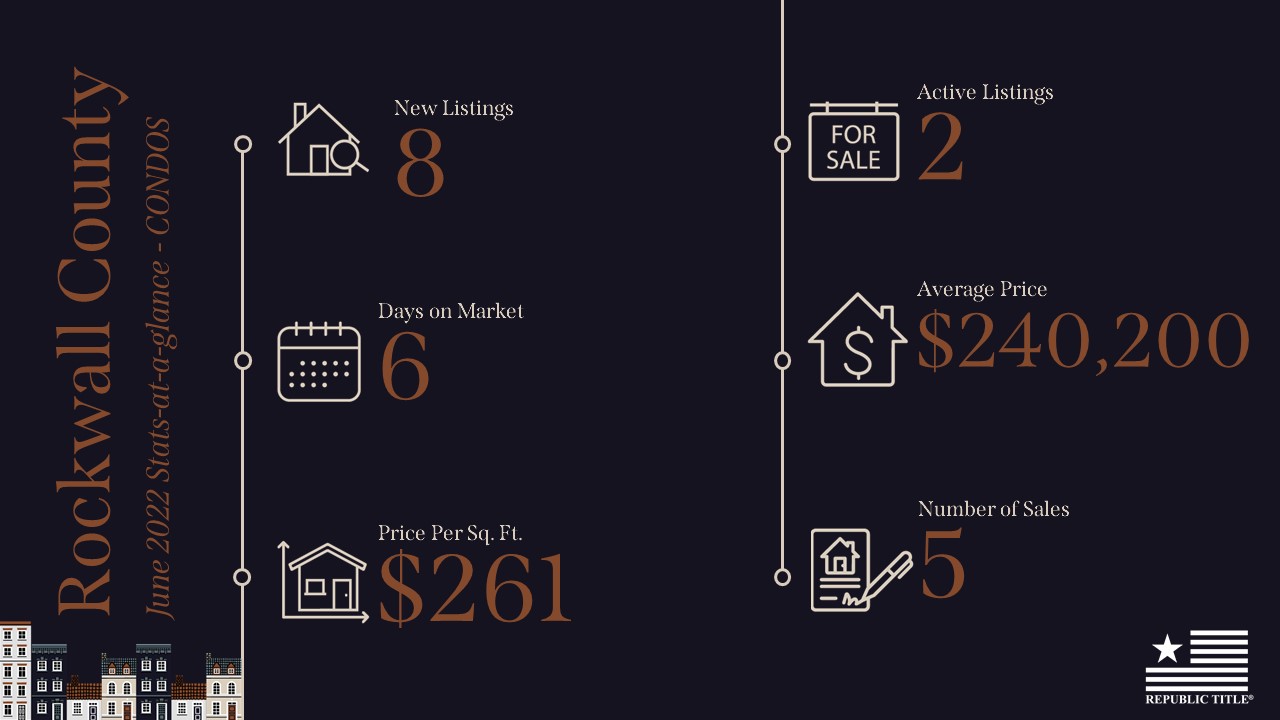
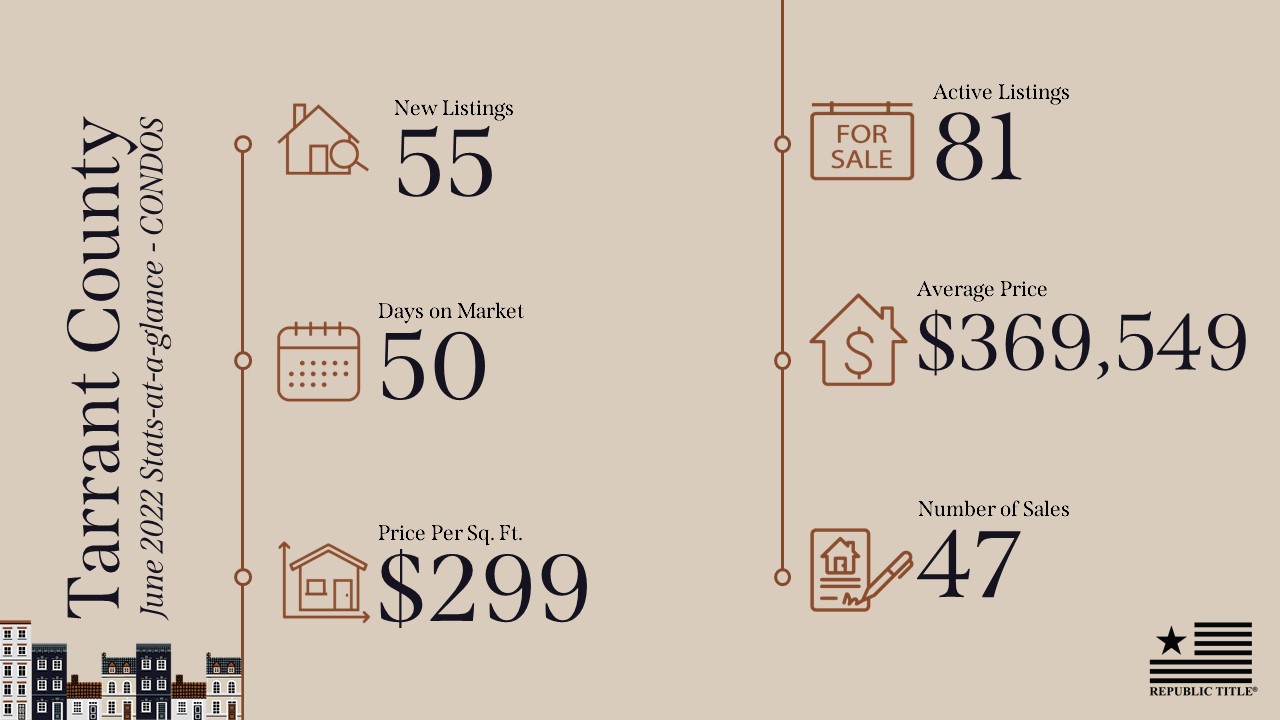
In June, home inventory increased in each county with new listings up ranging from 6% to 32% over June 2021. There is also an increase in inventory compared to last month in each county which is welcome as the DFW housing market has experienced tight supply conditions for some time. Average sales prices are up ranging from 15% in Dallas County to 27.9% in Collin County compared to June 2021. According to the Home Buying Institute, we are still in a seller’s market, but “these recent trends should make things a bit easier for buyers going forward”.
Our stats infographics include a year over year comparison and area highlights for single family homes broken down by county. We encourage you to share these infographics and video with your sphere.
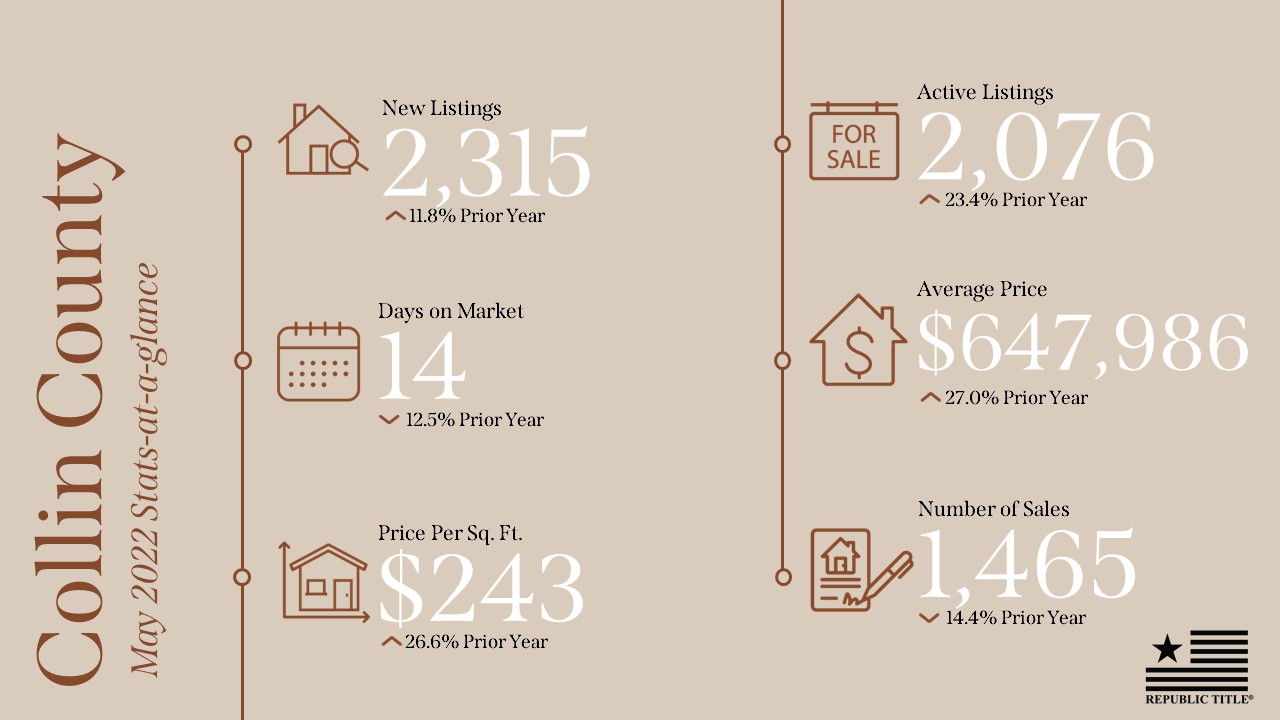
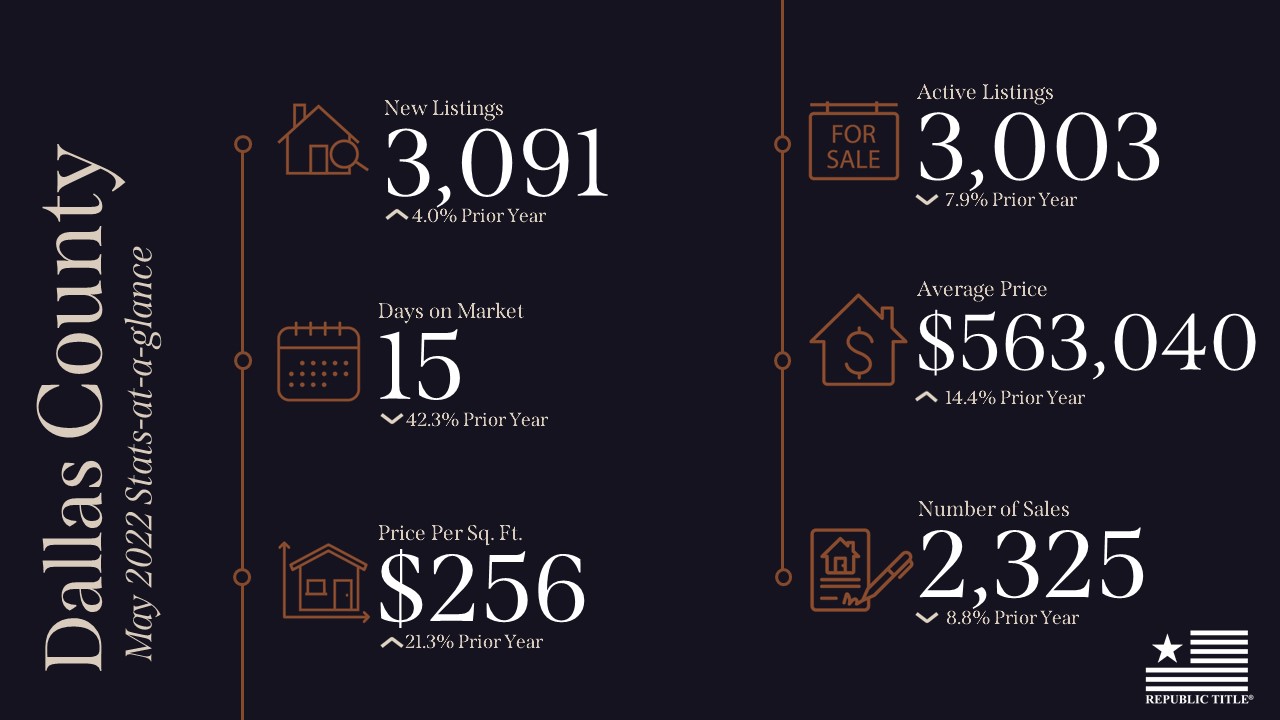
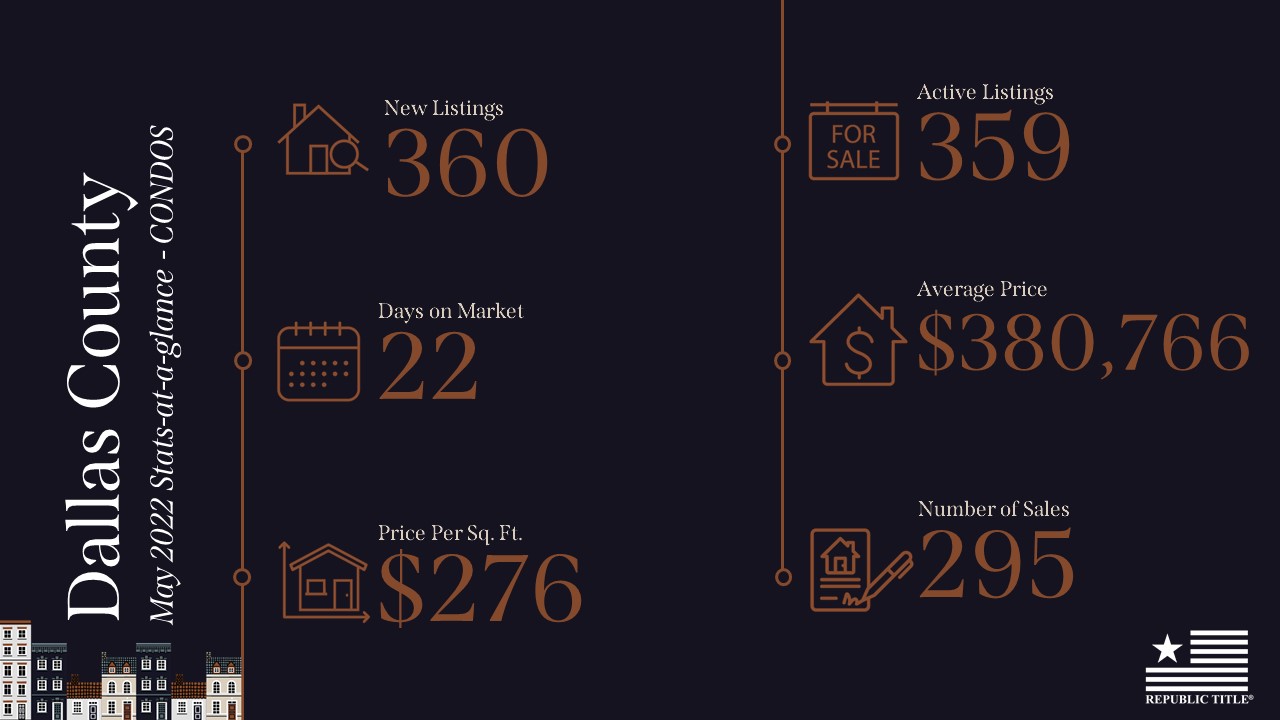
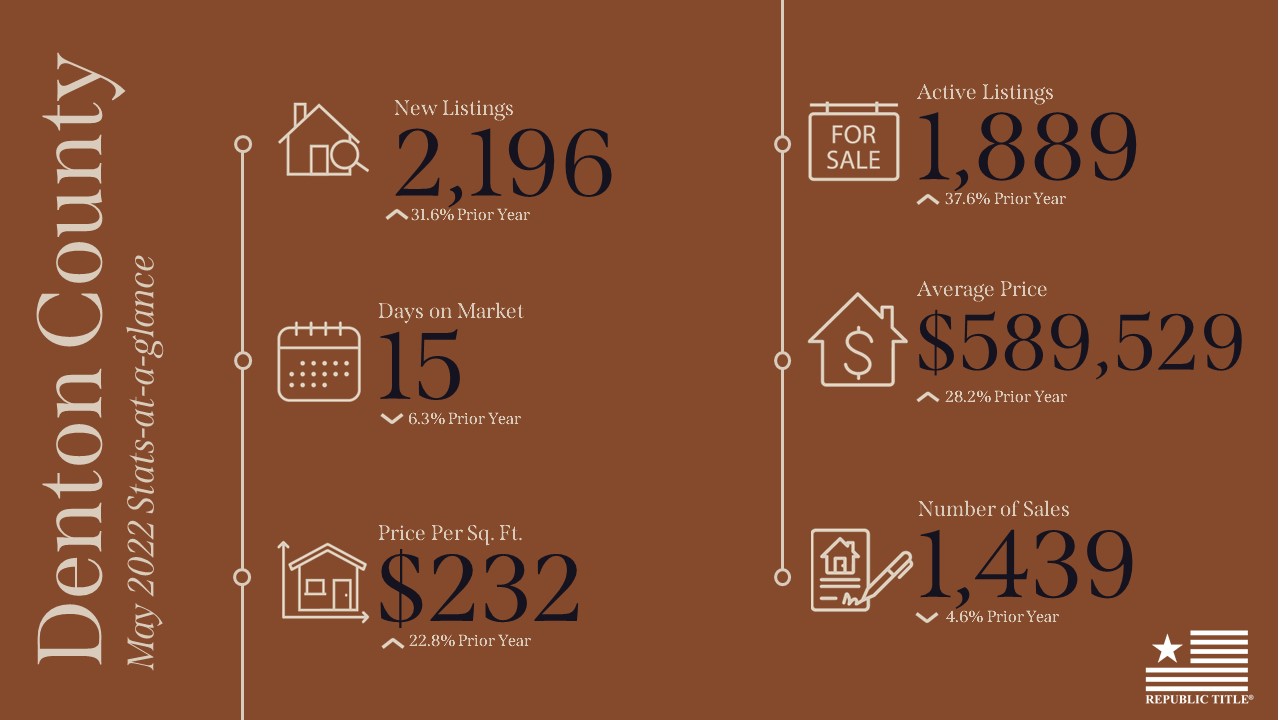
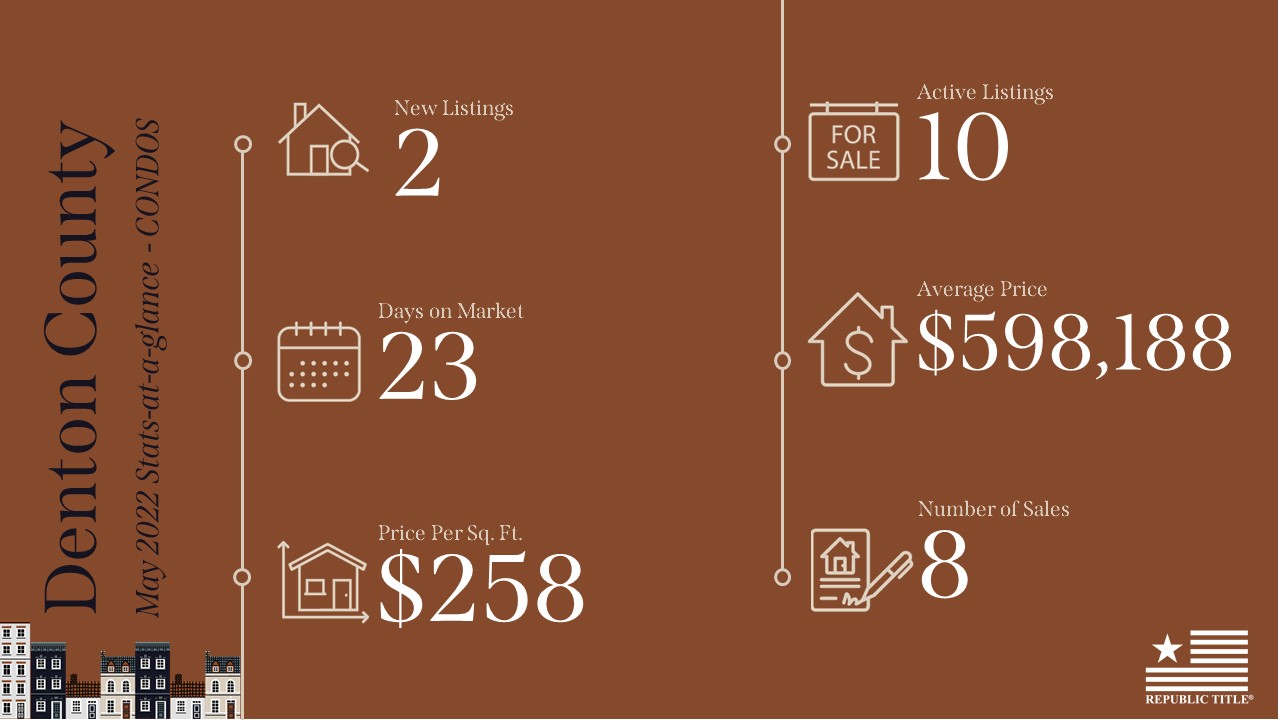
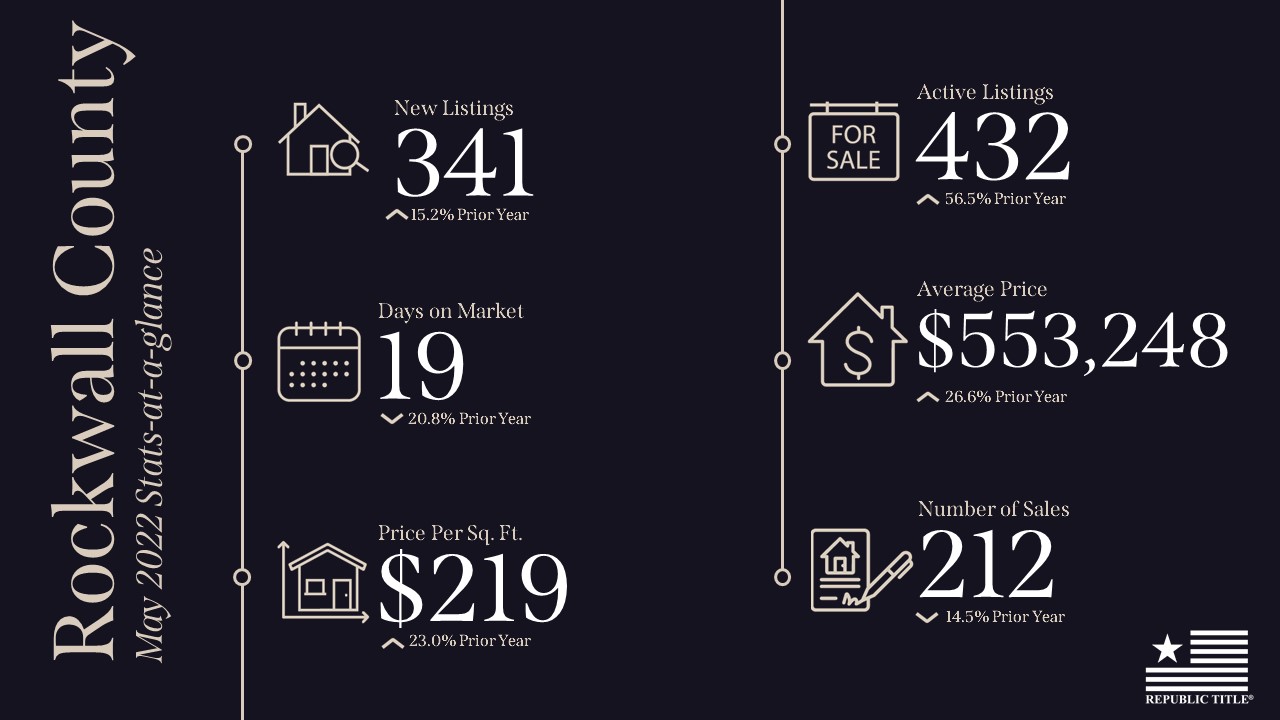
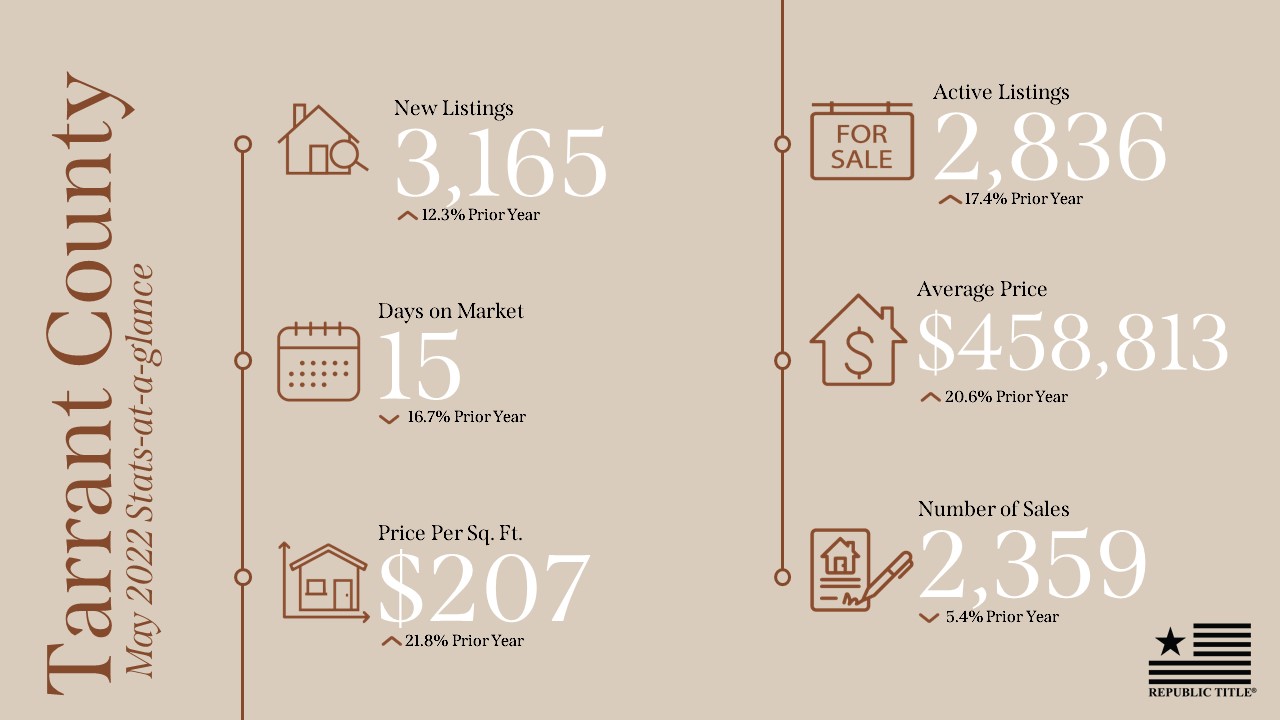
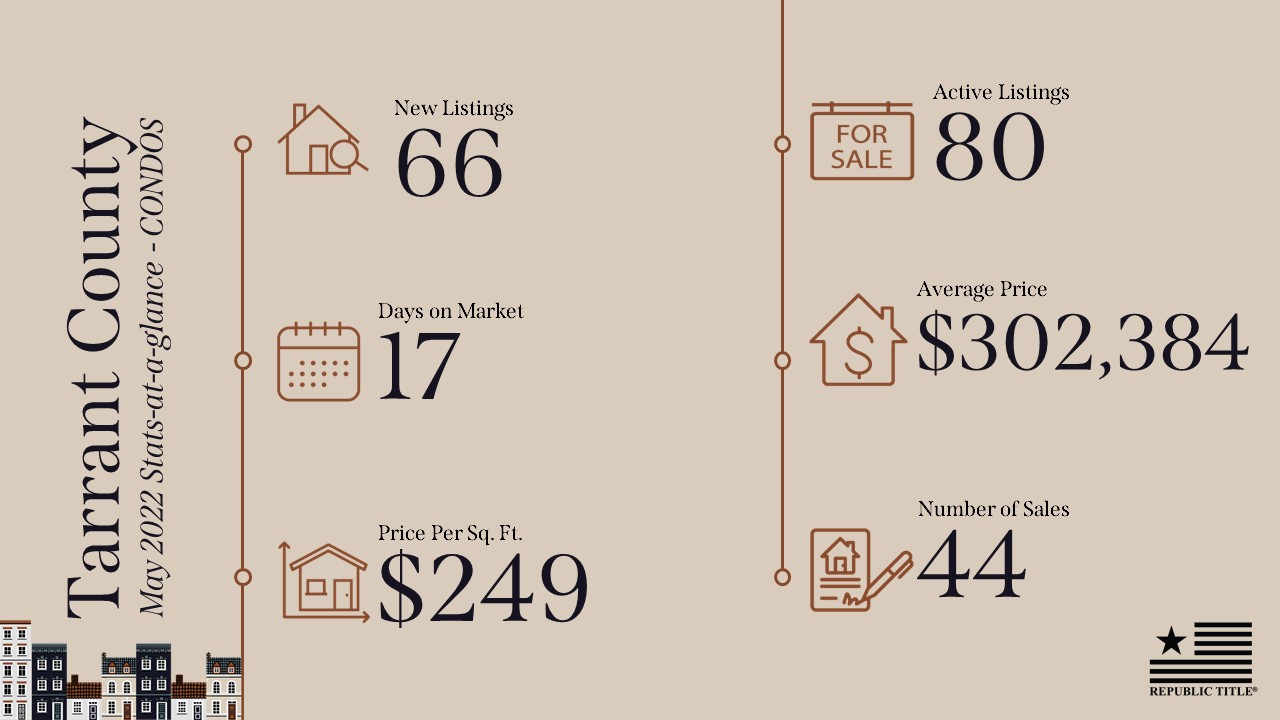
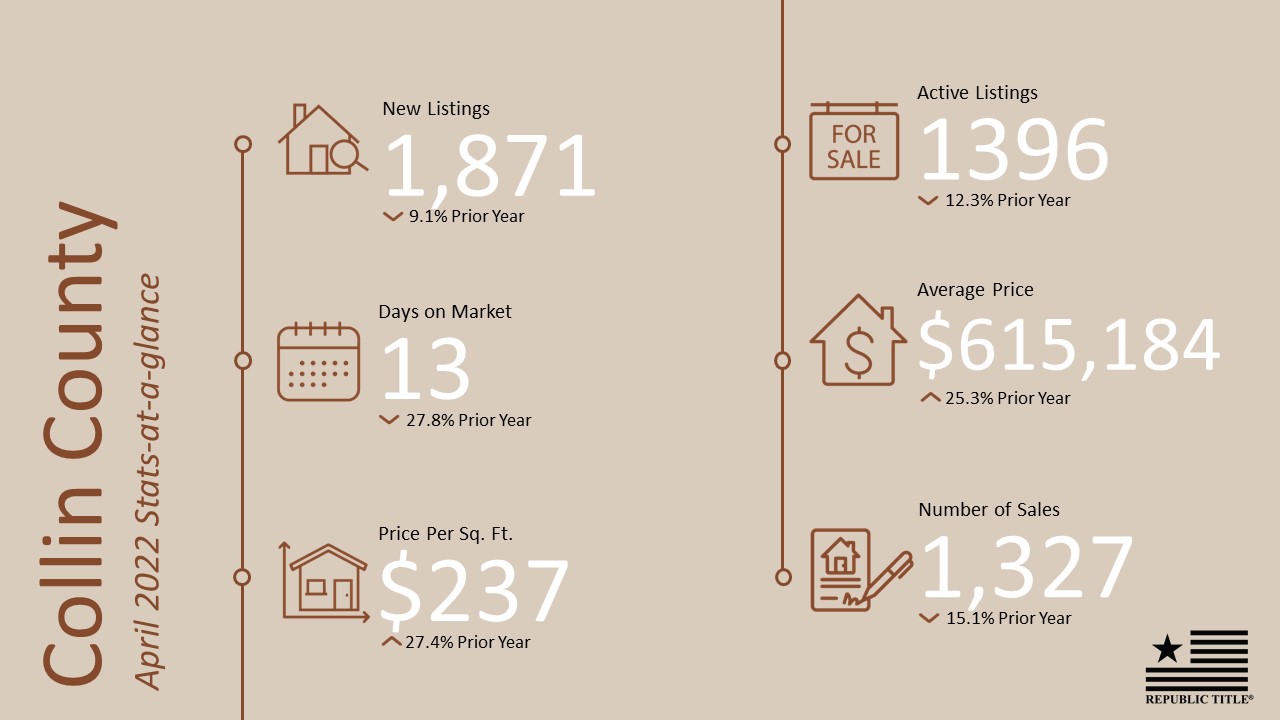
Inventory is increasing with new listings up in Collin, Dallas, Denton, and Tarrant Counties over April 2022. Average sales prices are up ranging from 14% in Dallas County to 26% in Rockwall County compared to May 2021. Average days on market across the five counties in North Texas was 18 days which is down in each county over 2021. According to the Dallas Business Journal, the DFW housing market had the largest increase in the close-to-list price ratio (average value of the sales price divided by the list price for each transaction) in the U.S. year-over-year with a close-to-list ratio of 104.7% compared to 98.4% in May 2021.
Our stats infographics include a year over year comparison and area highlights for single family homes broken down by county. We encourage you to share these infographics and video with your sphere.
A title insurance policy is an insurance policy that insures you against liens or other claims against your property. Unlike other types of insurance, you pay the premium one time and the policy generally insures you for as long as you own the property. In Texas, Title Insurance rates are regulated by the Texas Department of Insurance and the rate is based on the amount of coverage provided by the policy. There are two basic types of title insurance, an owner’s title policy and a loan title policy. Most financial lenders require a loan title policy as security for their investment in your property just as they require homeowners insurance or other types of coverage for their protection. Owner’s title insurance lets the new homeowner feel safe and confident there are no other claims as to the ownership of the insured property. Among other matters, it ensures access to the property, gives the homeowner the right to occupy the property, and provides indefeasible title.
For more information, go to Blog for videos like this and other helpful information. Blog | REPUBLIC TITLE
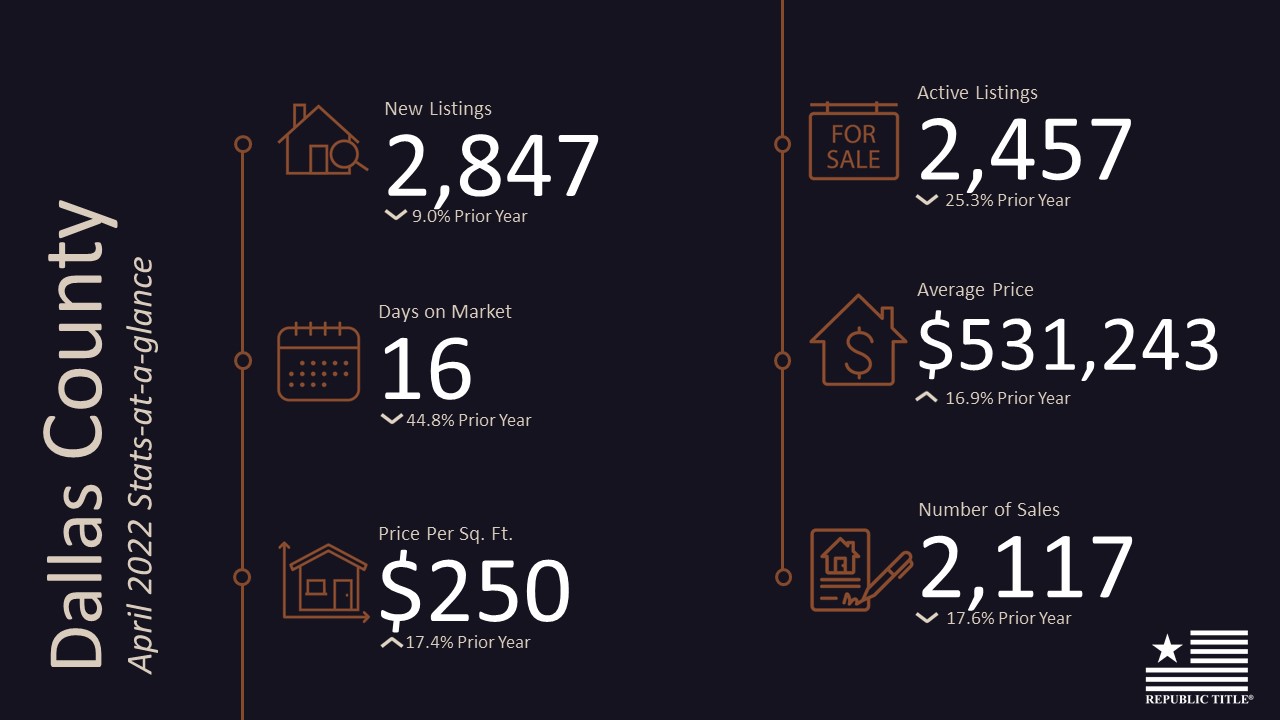
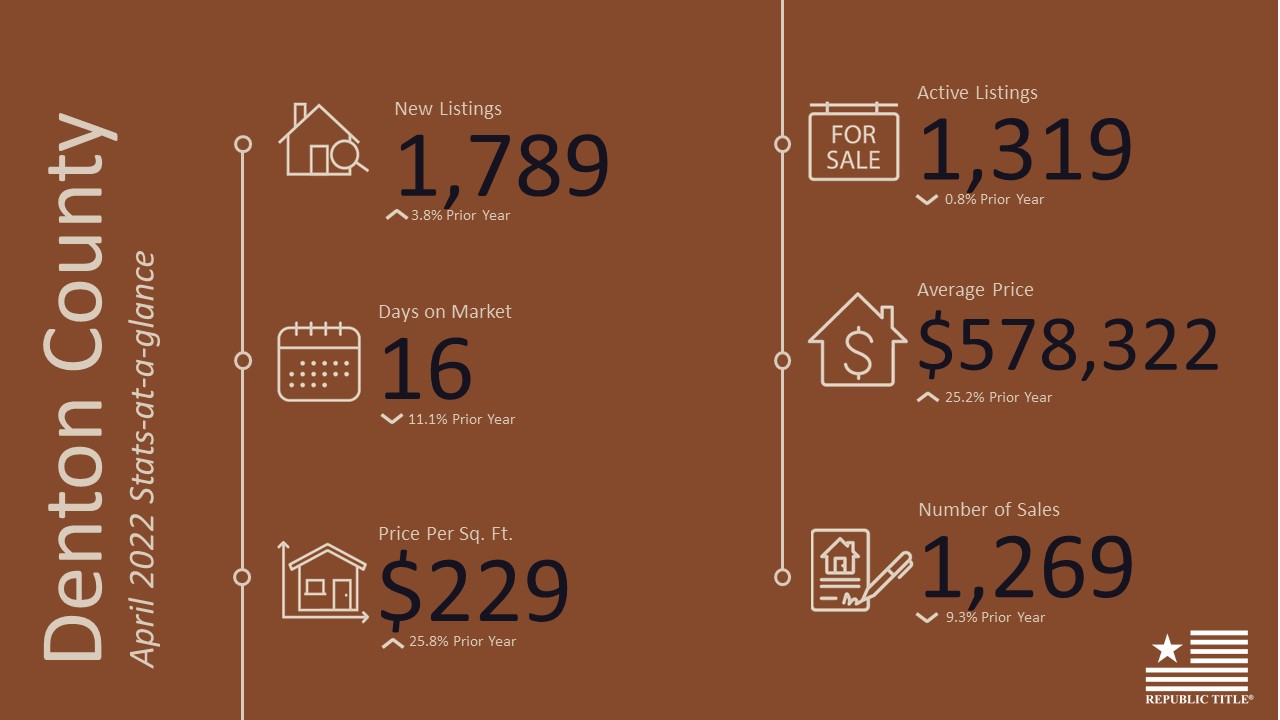
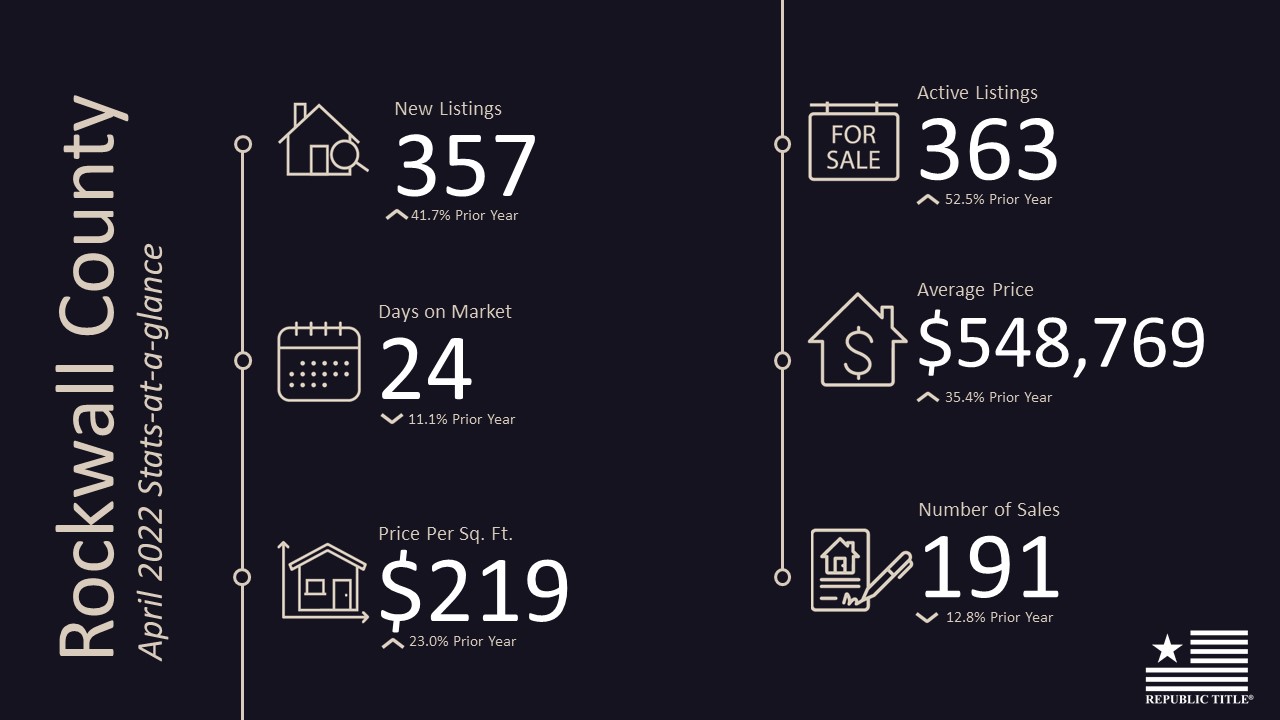
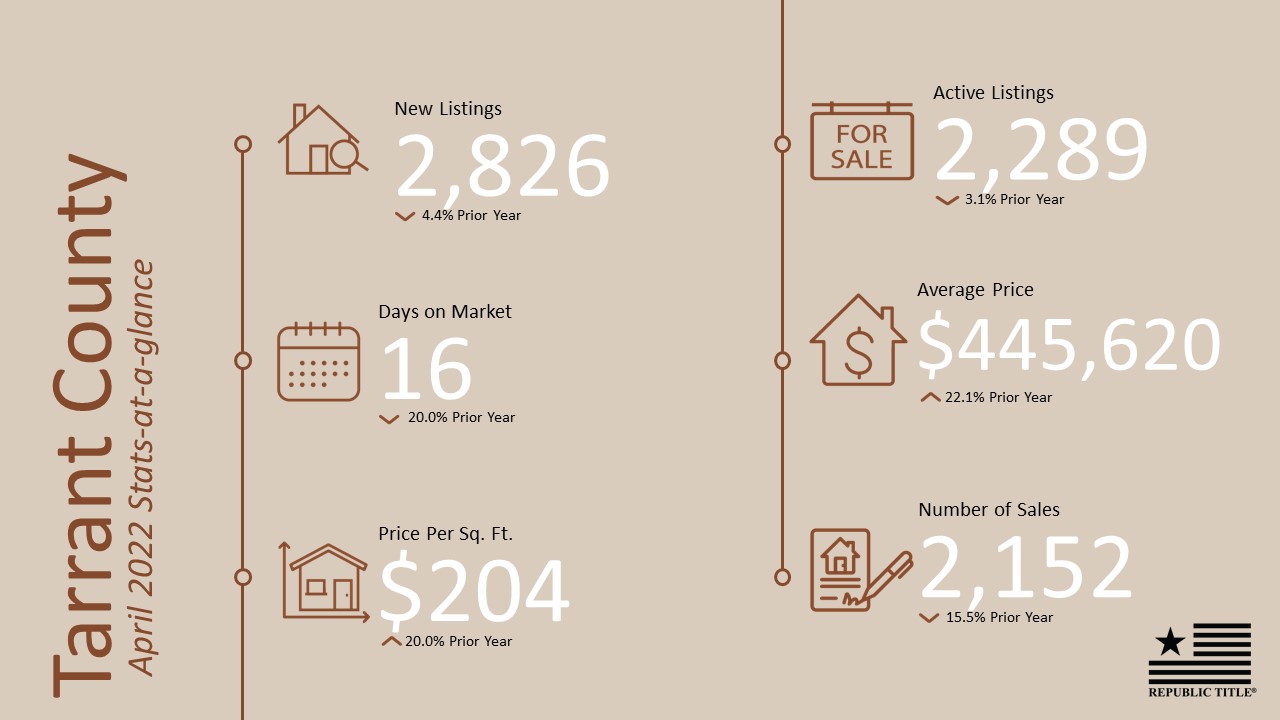
The housing market in North Texas continues to be hot! New listings are up consistently in all five counties over March 2022 as the Spring market continues to heat up. Despite higher mortgage rates, demand remains strong in North Texas. Average sales prices are up ranging from 16% in Dallas County to 35% in Rockwall County compared to April 2021.
Our stats infographics include a year over year comparison and area highlights for single family homes broken down by county. We encourage you to share these infographics and video with your sphere.