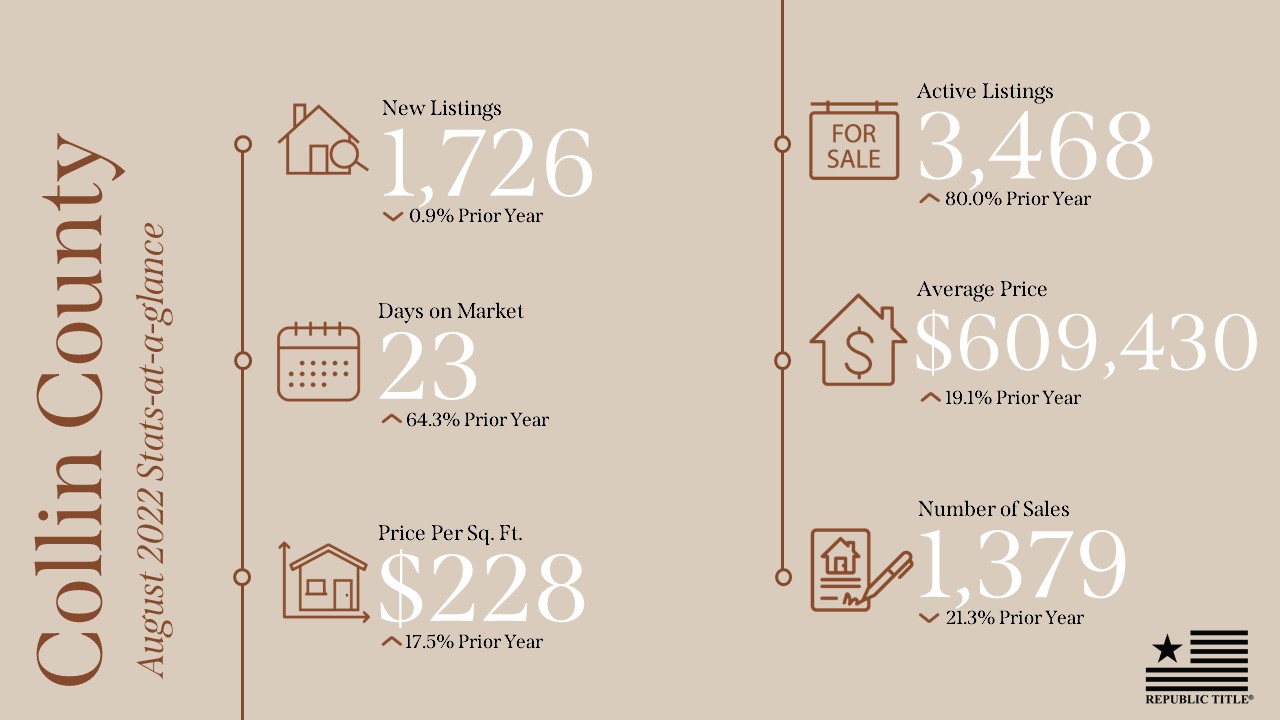
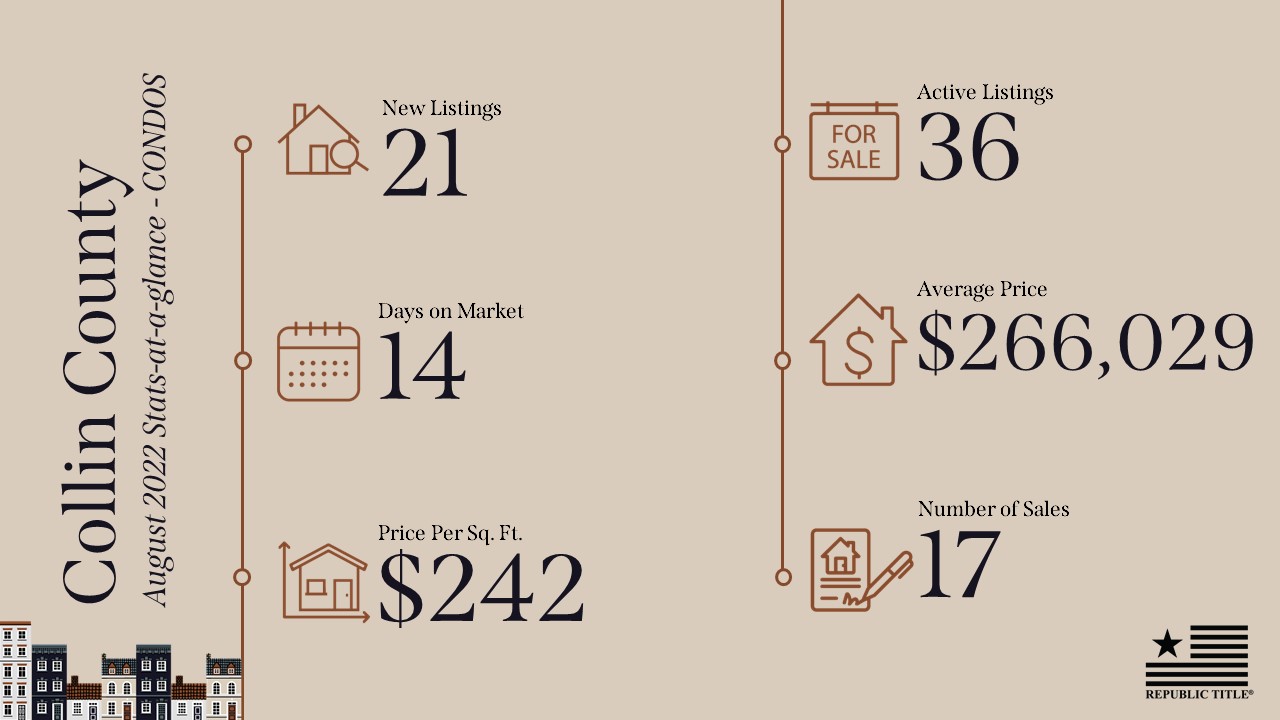
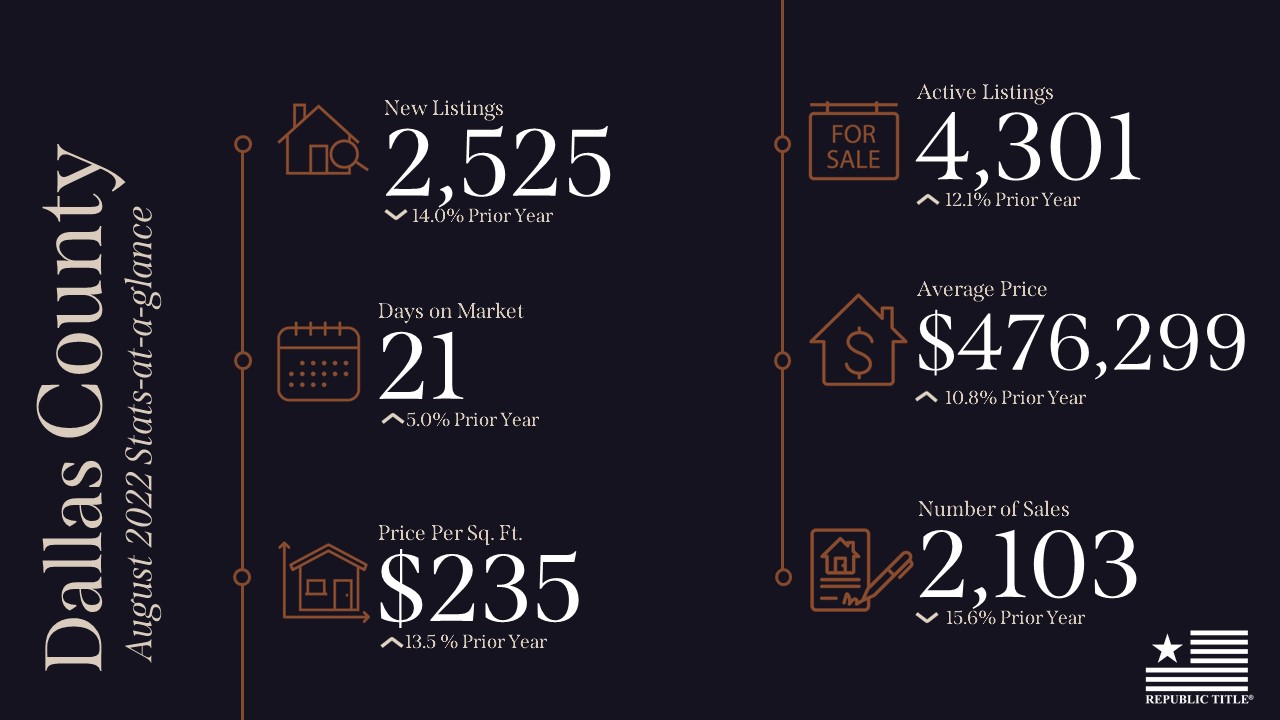
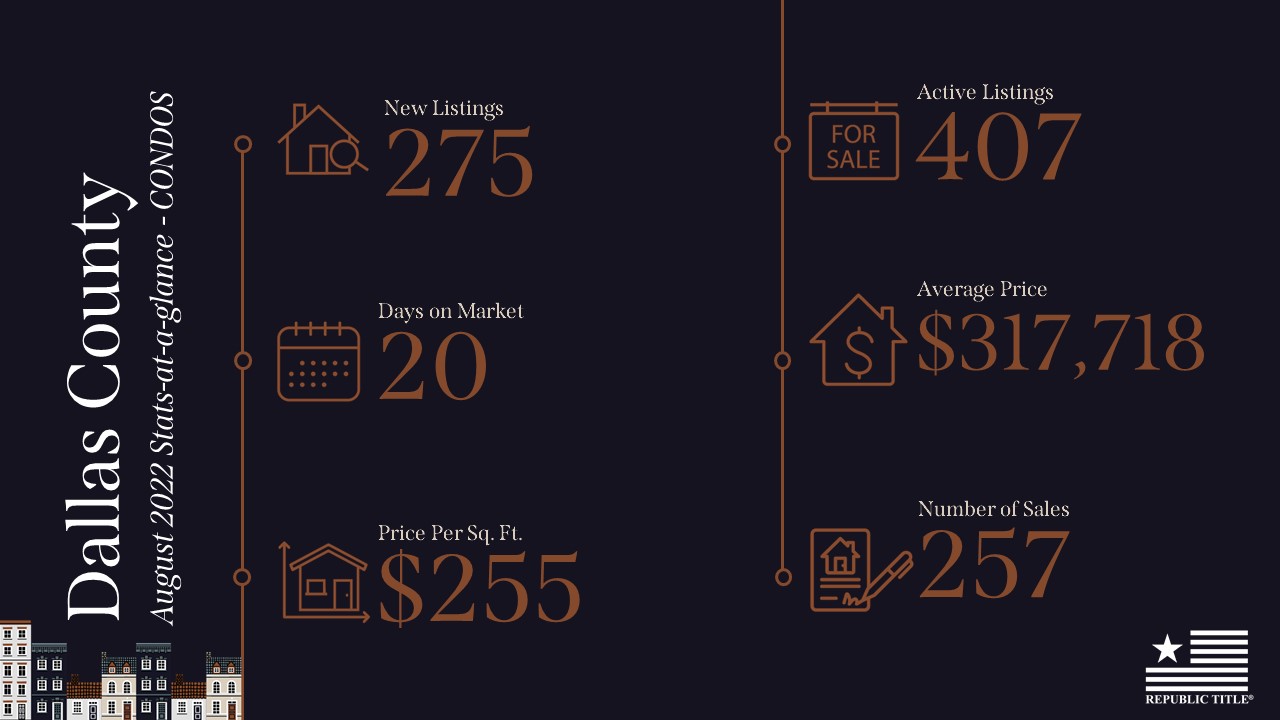
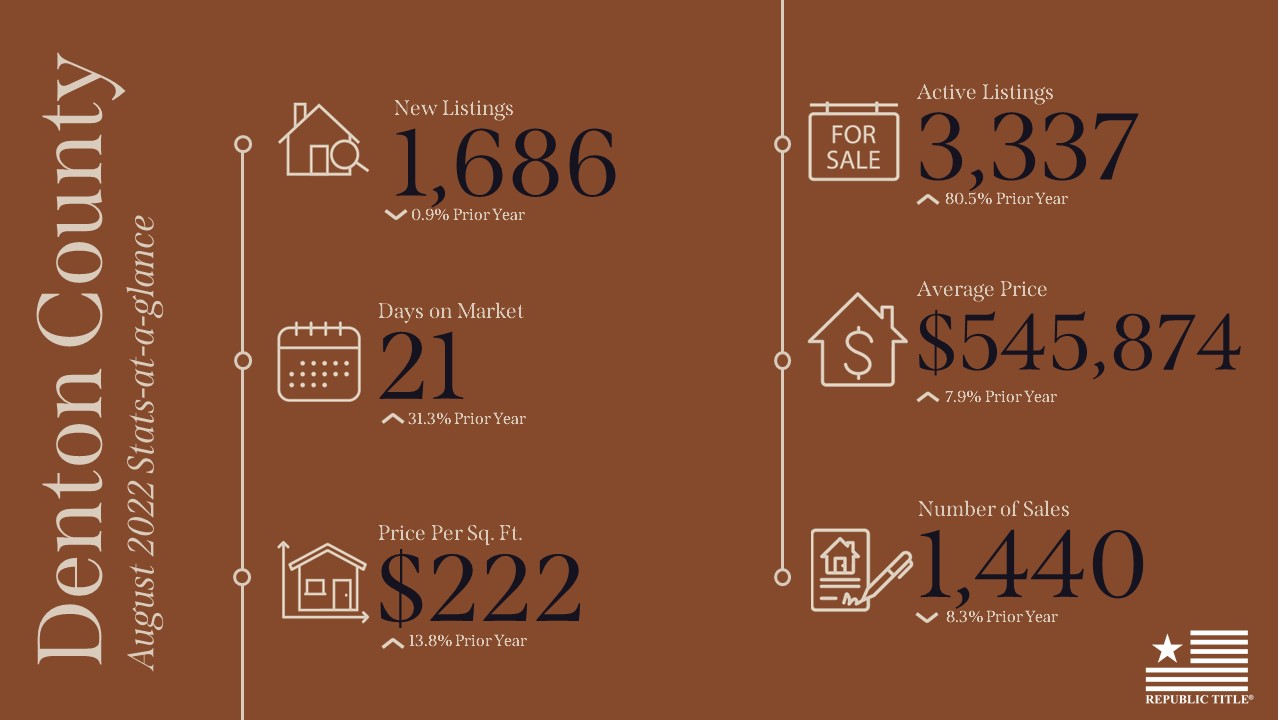
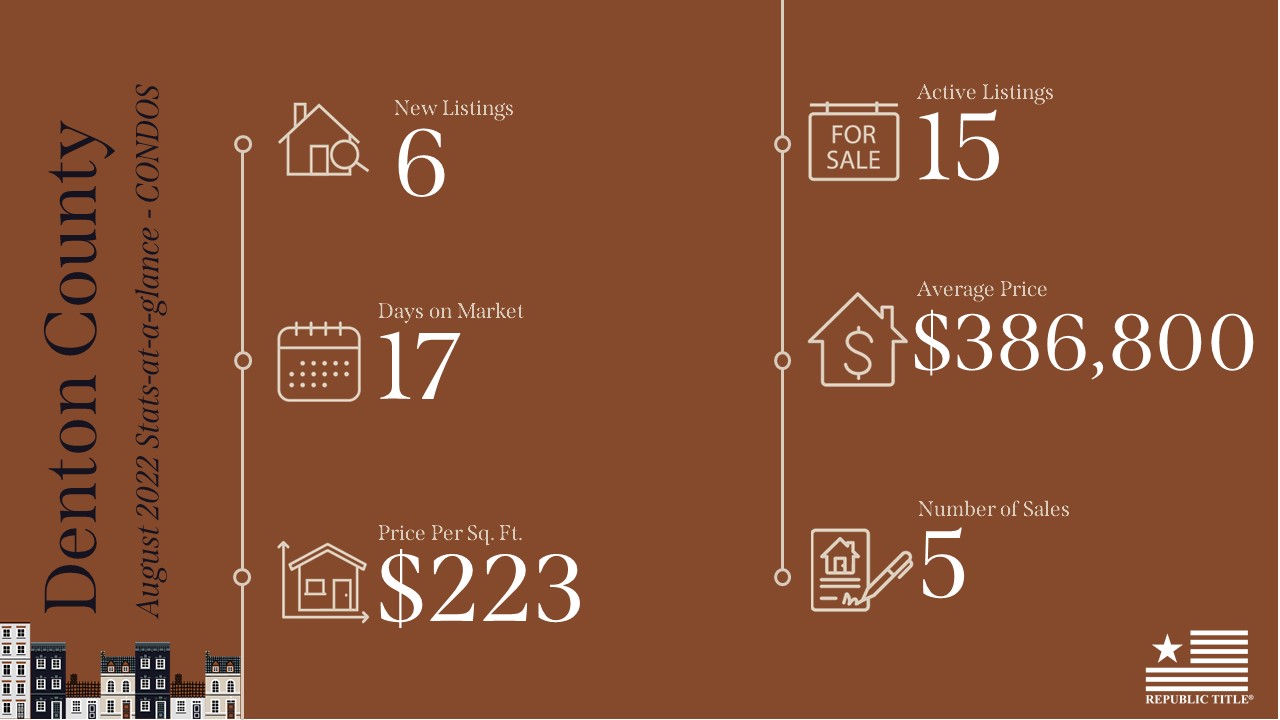
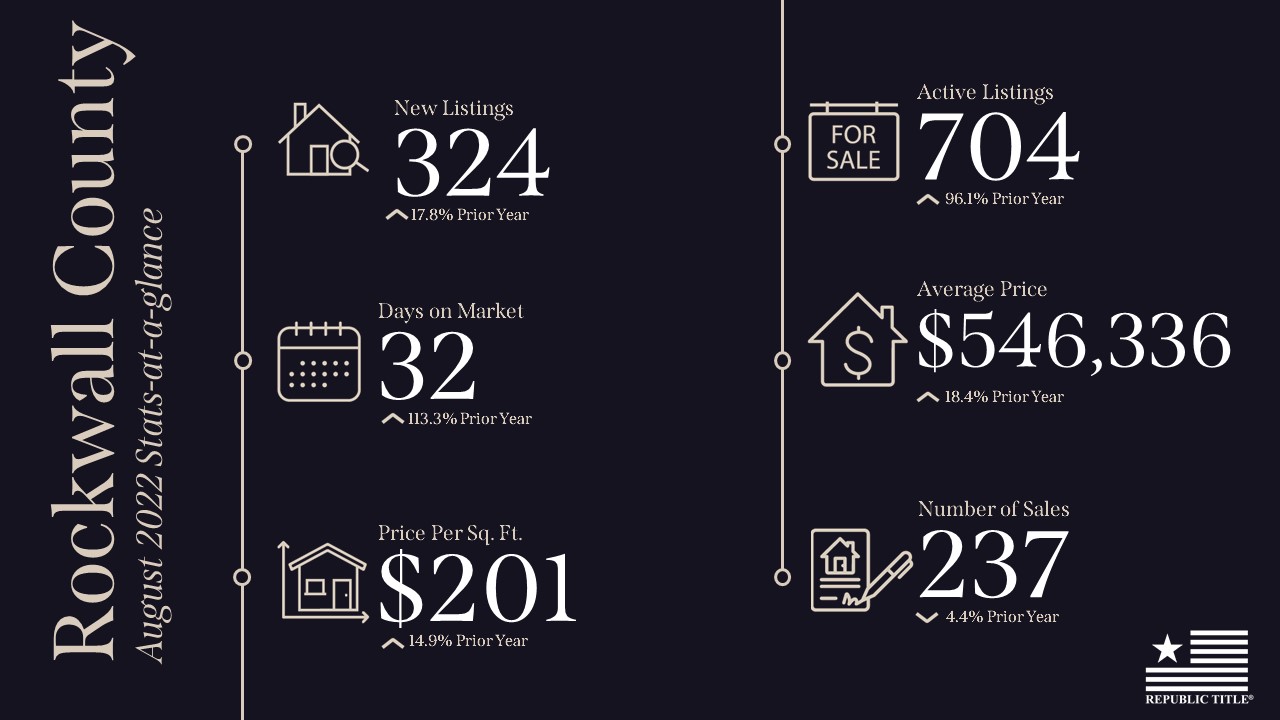
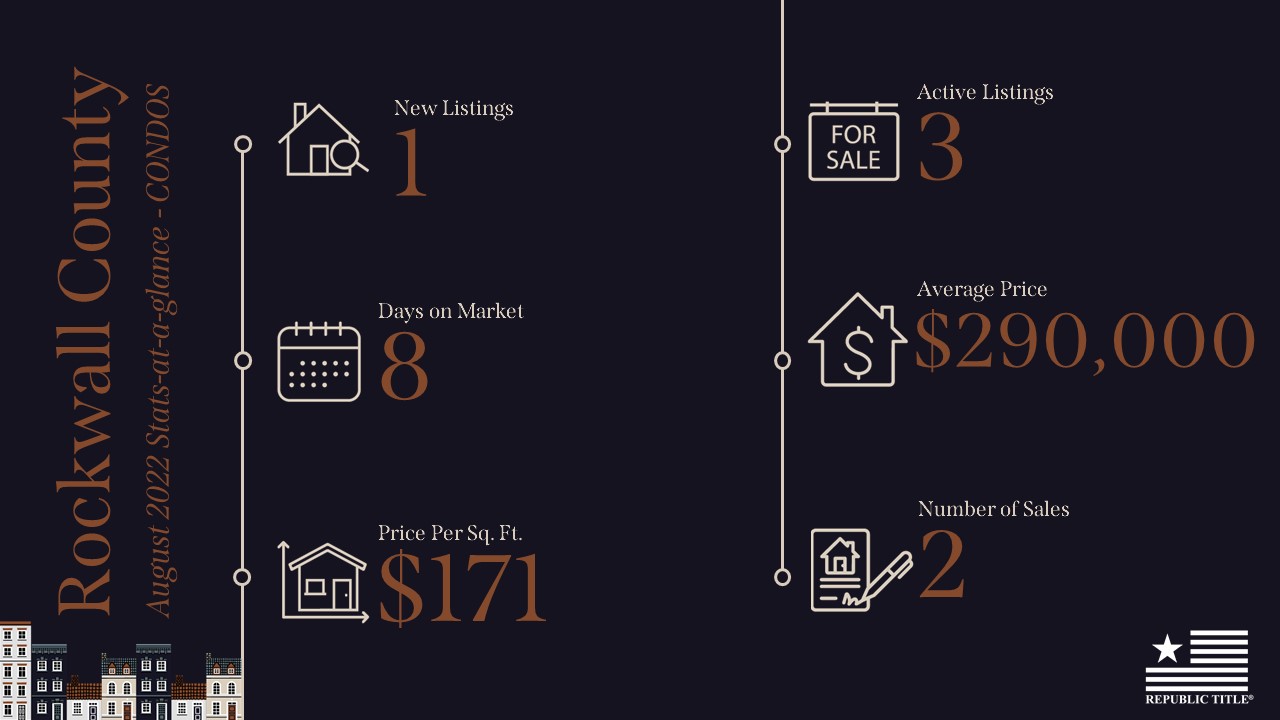
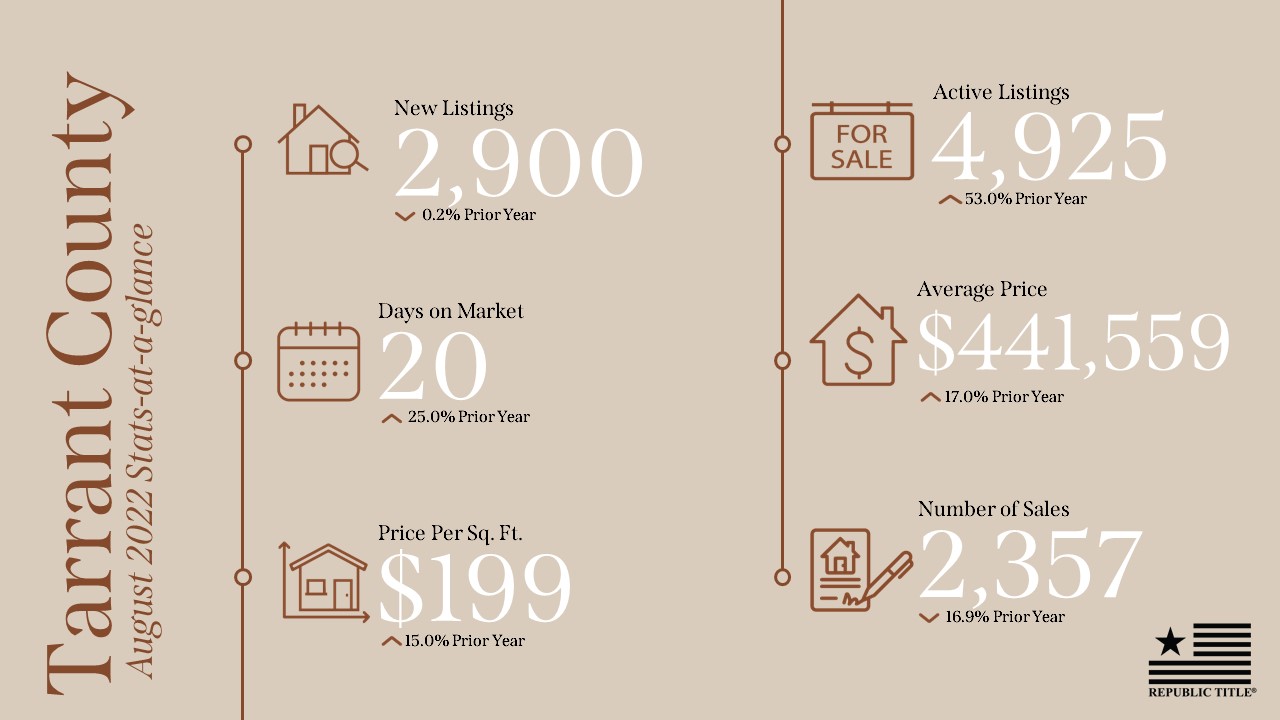
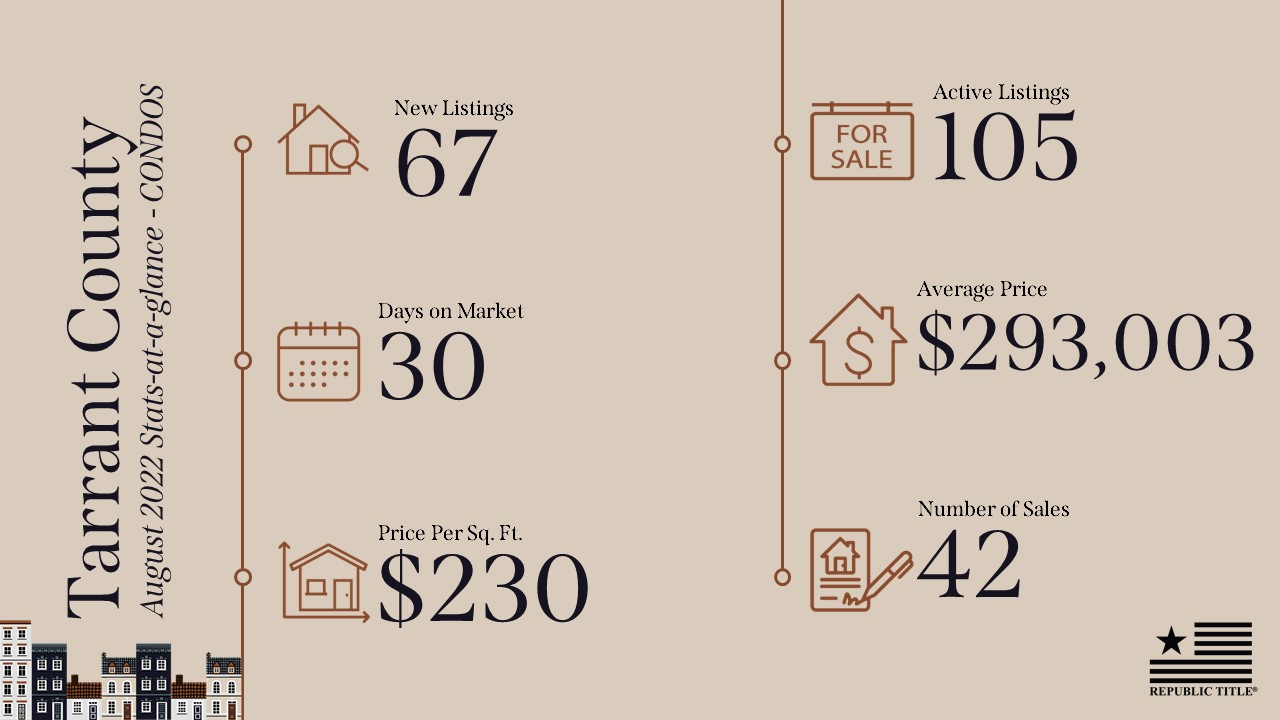
August 2022 Stats are IN! Here are the highlights! In Collin County New listings are slightly down, while Active listings are up quite a bit from last year. The days on market, average sales price and price per square foot are also up as we are all aware, with the actual number of sales down about 21% from 2021. In Dallas County, the new listings are also down slightly with Active listings up with similar percentages to Collin County. The days on market, average sales price and price per square foot are also up in Dallas with the number of sales down about 15% from last year. The statistics are about the same in Denton and Rockwall counites as you can see. In summary, while the market is definitely slower than 2021, we are still experiencing a shortage of homes for sale in the entire metroplex which makes it a great time be in the business in North Texas! Happy sharing and selling!
Our stats infographics include a year over year comparison and area highlights for single family homes broken down by county. We encourage you to share these infographics and video with your sphere.