
Aggressive central bank policy continues to drag down the housing market, stalling the previously hot streak of housing sales. The housing sector continues to show signs of easing as housing inventories recover and home prices depreciate. Amid a statewide retreat in construction permits, the elevated demand for construction suggests many prospective homebuyers might be putting off their big-item purchases. Sales of homes below $300,000, an attractive market for first-time buyers and younger households, diminished more than sales of higher-priced homes.
Supply1
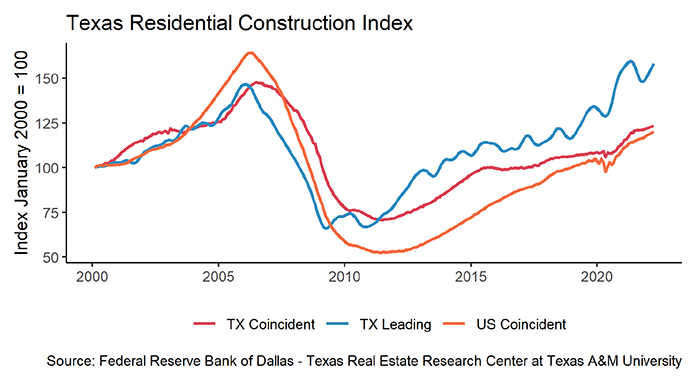
Texas’ single-family construction permits marked the largest monthly decrease since April 2020, sliding 16.1 percent month over month (MOM). Permits for building construction and renovation fell in all four major metros, but contractions were most significant in Houston and San Antonio, falling at 19.9 percent and 12.7 percent MOM, respectively. Amid the drop, DFW (3,626 permits) surpassed Houston (3,471 permits) as the metropolitan area with the most construction permits. The last time DFW surpassed Houston on the national permit list was one-and-a-half years ago. On the other hand, permits between Austin (1,626) and San Antonio (781) continued the 1:2 ratio. While the single-family sector shrank to 11,900 permits, Texas’ multifamily sector rose to an historic high with 12,500. The growth was heavily concentrated on permits for apartment buildings, doubling the year-ago level.
Lumber producer price index (PPI) balanced at the year-ago value, and the July value was four-fifths of March’s record-high metric. Despite the recent lumber price deduction, material prices are still soaring compared with historical prices. Additionally, rampant mortgage rate increases suppressed the South’s total housing starts to a rate of 710,000 units. Single-family housing starts, which account for the biggest share of homebuilding, plunged to 511,000 units. Correspondingly, single-family private construction values tumbled to a two-year low, withdrawing 13.2 percent MOM. All major metros reported double-digit negative year-to-date (YTD) growths.
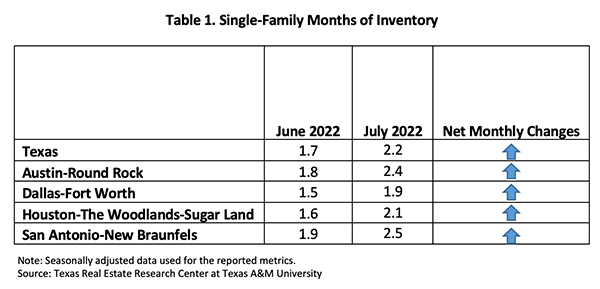
While homebuilding is expected to continue decelerating, the state’s current supply is starting to accumulate. Active listings rose more than 17,000 units since May. This loosening up of housing availability indicates a break-through after the abnormally low inventories of the past two years. As a result, Texas’ housing supply, which has been below two months of inventory (MOI), recovered to 2.2 MOI. The Texas Real Estate Research Center considers six to 6.5 months of inventory a balanced market. San Antonio led the pack with 2.5 MOI, and Dallas remained the tightest with 1.9 MOI (Table 1).
Demand
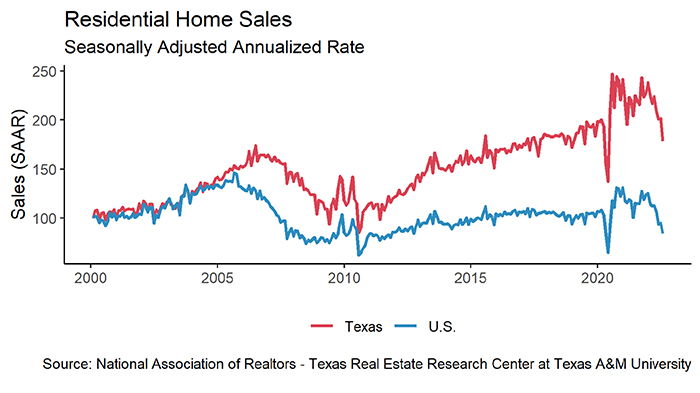
Record home prices and rapidly rising mortgage rates continued to discourage buyers. While summer is normally peak season, July’s total housing sales sank according to the Texas Real Estate Research Center’s Data Relevance Program. The state’s sales volume lost over 3,000 deals, falling to a seasonally adjusted rate of 28,121 closed sales. Sales in all major metros declined under falling demand. Austin and Houston’s closed sales took the biggest hits, each dipping almost 16 percent MOM, while DFW and San Antonio each shrank close to 8 percent. While every prospective homebuyer has to confront financial challenges, affordability most adversely impacted first-time buyers, resulting in a significant shrinkage in sales of homes below $300,000.
Texas’ average days on market (DOM) remained low at 34 days, suggesting a persistent imbalance between sellers and buyers’ bargaining power. Homes sold quickest in Austin and Dallas, leaving the market in 22 days, while Houston and San Antonio’s DOM hovered around 30 days. When DOM is differentiated based on the home market, the DOM for existing homes is conspicuously lower than that of new homes. Existing homes are still in a tight housing market.
Categorized by price cohorts, homes priced in the $300K and $400K cohorts sold fastest, typically in 28 days. Meanwhile, homes priced at more than $750K had interestingly shorter listing periods than those priced at less than $300K.
Prices
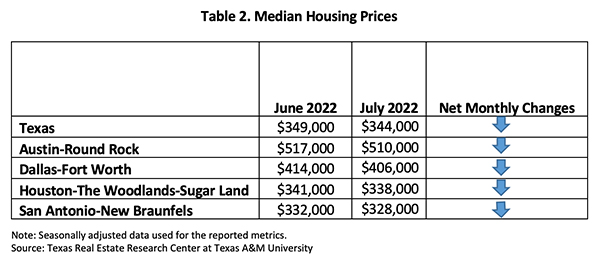
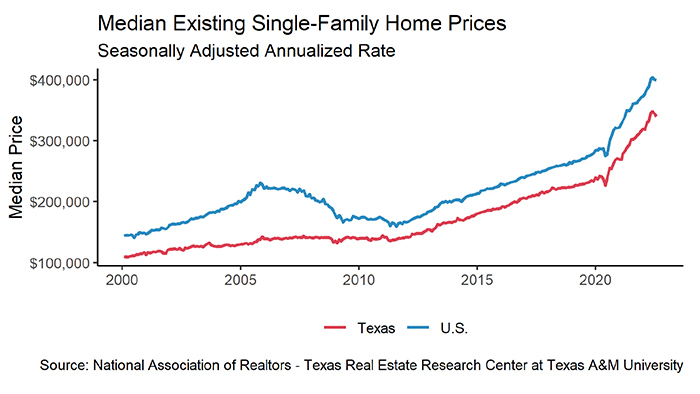
In July, the Texas’ median home price fell $5,000 to $344,000. Prices dropped in all metros (Table 2). Austin ($510,000) and DFW ($406,000) fell $7,000 and $8,000 in a month, respectively. Meanwhile, Houston ($338,000) dropped $3,000, and San Antonio ($328,000) dropped $4,000. Amid the statewide downturn, Austin prices had the steepest decline, falling $33,000 in three months. Housing prices are under correction, but they remain much elevated from a year ago, accelerating 13.2 percent year over year (YOY).
The Federal Reserve is expected to impose more forceful monetary policies in the second half of the year to combat inflation. The ten-year U.S. Treasury bond yield retreated to 2.9 percent2, while the two-year counterpart continued to march upward. The spread between the ten-year and the two-year bond yields entered the negative territory for the first time since 2008, indicating the market’s economic uncertainties about the near future. The Federal Home Loan Mortgage Corporation’s 30-year fixed-rate, which for years hovered around 3 percent, elevated to 5.52 percent. The last time the mortgage rate was this high was 2008. For more information on the effect of mortgage interest rates on purchase affordability, see “How Higher Interest Rates Affect Homebuying.”
The Texas Repeat Sales Home Price Index, which accounts for compositional price effects, corroborated the trend of slowing price growth, as the index shrank from increasing 20.4 percent YOY in January to increasing 14.9 percent YOY. Falling prices pulled the state YOY growth down by 55 basis points in the last seven months. Austin fell from the fastest appreciating metro to second, behind San Antonio’s yearly growths.
Household Pulse Survey
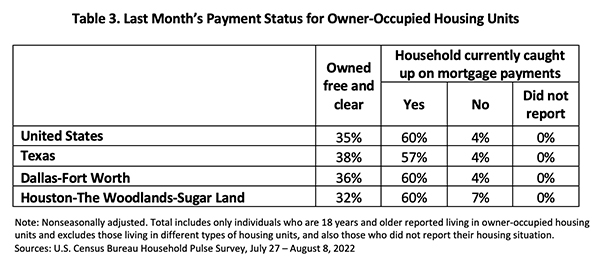
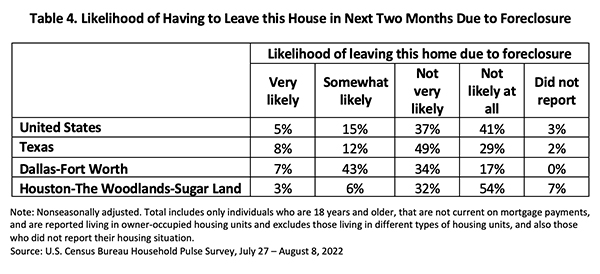
Homeowners who just closed a deal were likely to start off in good financial standing. According to the U.S. Census Bureau’s Household Pulse Survey, in spite of rising mortgage rates, the share of Texas homeowners caught up on mortgage payments improved 60 basis points YOY in July, and the share of people who were behind shrank to 4 percent (Table 3). Houston owners’ bolstered ability to pay their mortgage increased the owned free/clear homes ratio to the state average. On the other hand, when asked about the future payments, fewer Texas homeowners were confident they would not face foreclosure. The proportion of delinquent individuals at risk of foreclosure shot up 80 basis points to 8 percent (Table 4).
_________________
1 All measurements are calculated using seasonally adjusted data, and percentage changes are calculated month over month, unless stated otherwise.
2 Bond and mortgage interest rates are nonseasonally adjusted. Loan-to-value ratios, debt-to-income ratios, and the credit score component are also nonseasonally adjusted.
Source – Joshua Roberson and Weiling Yan (September 14, 2022)
https://www.recenter.tamu.edu/articles/technical-report/Texas-Housing-Insight