

January home sales increased month over month (MOM), but it was the slowest start since January 2017, a far cry from January levels from both 2021 and 2022. Other housing metrics, such as median price and inventory, may be showing early signs of stabilizing with only minor changes in recent months compared with the major swings experienced during the pandemic.
Supply1
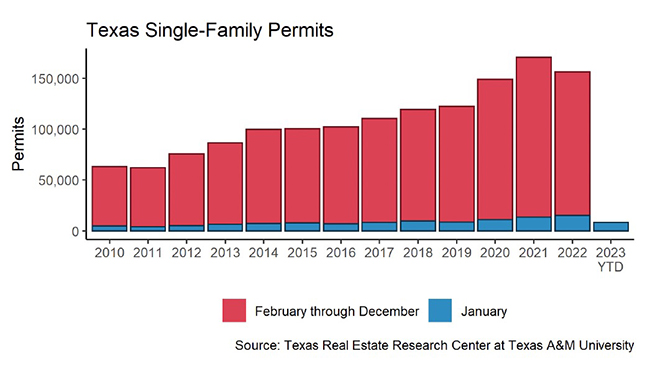
Single-family construction permits had been sliding down in demand since March 2022. January 2023’s permit level fell 6.9 percent MOM to 8,897 permits. The other two months during the past three years that monthly permits dipped below 9,000 were during the initial pandemic shock in April and May 2020. Construction permits fell in all major metros except Austin. While housing demand in Houston (2,842 permits) was mostly flat, Dallas (2,249 permits) dropped more than 15 percent MOM. Austin’s monthly construction demand (1,082 permits) rebounded 10 percent, issuing twice as many permits as San Antonio (481 permits).
Texas single-family construction starts have likewise plummeted since March 2022 but started 2023 with a positive month in January with 9,090 units. Although construction starts rebounded in every major metro, the January metric was the lowest level reported in Texas since 2016, suggesting a meek outlook for the housing industry.
The state’s total single-family starts value diminished from $3.8 billion in January 2022 to $2.2 billion in 2023. Houston and Dallas continue to account for more than half of the states total, coming in at 27.5 percent and 26.1 percent, respectively. Further pressing the point home that housing activity is down from the previous year, Austin and San Antonio had their construction values nearly cut in half in the first month of 2023.
The rebound in active listings had been aggressive since March 2022. However, the acceleration slowed in the past two months as the metric fell flat at a seasonally adjusted rate of 91,000 units. Compared with the first half of 2022 when inventory was 50 percent short of pre-pandemic levels, housing inventory was only 4.5 percent short in January. Active listings in Austin have more than tripled from a year ago, reaching 8,500 units. Amid the recent flattening, months of inventory (MOI) dipped for the first time in the past eight months. The MOI for the four major metros ranged from 2.5 months to 3.4 months. While Dallas, Austin, and San Antonio all either hovered back or beyond pre-pandemic levels, Houston’s housing supplies still needed more homes to restock.
Demand
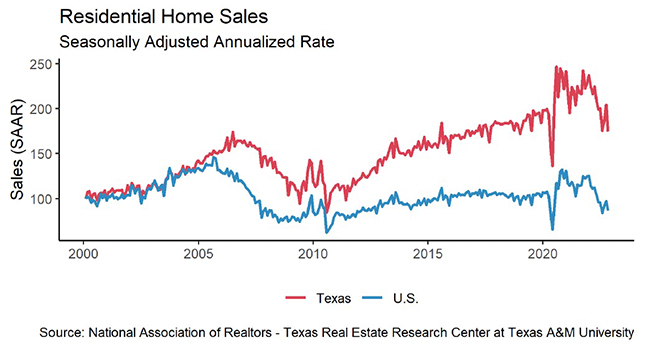
Total home sales inched up 3.4 percent MOM to a seasonally adjusted rate of 27,475 sales. This uptick marked the largest MOM jump since the second half of 2022. Sales in Austin and Houston rebounded greatly, with the former metro surpassing San Antonio’s sales volume and the latter surpassing Dallas’ (Table 1). While the housing market opened robustly in 2023, Texas’ sales still diminished by over 20 percent compared with last year’s January metric.
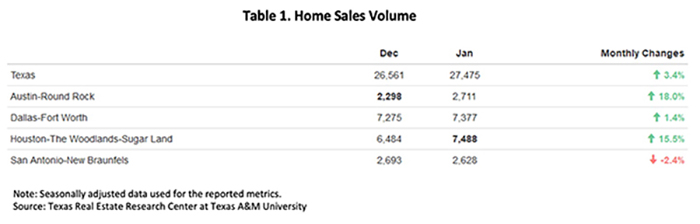
Sales grew across all price cohorts. While homes below $300K still make up 40 percent of the market, this sector’s sales volume rebounded least at 0.5 percent MOM. The remaining price cohorts ascended moderately at a low-single-digit growth, but homes above $750K grew at an impressive rate of 21.6 percent MOM, accounting for almost 9 percent of the market.
With sales activity picking up, the Texas’ average days on market (DOM) continued to climb but at a slower pace of 54 days. Compared with the five-year average of 59 days before 2020, this is still converging to historic norms; and it is tilting toward a weaker market that favors buyers. Quadrupling since March 2022, Austin posted a first dip in DOM—balancing at 61 days.
Across all price cohorts except one, DOM rose to a range of 50 to 58 days, a three-day average increase across all the cohorts. The $400K-$500K housing sector’s DOM declined by 5.8 days over the previous month. Meanwhile, homes priced over $750K had a 55 DOM, one day higher than the $300K-$400K cohort.
Compared with a surge to 69 percent in 3Q2020 during the pandemic frenzy, Texas’ homeownership rate had been cooling, hovering around 63.6 percent in 2022. At the metropolitan level, the Dallas-Fort Worth (DFW) area was lowest at 56 percent, while Houston was highest at 67 percent. Austin and San Antonio were at 65 and 60 percent, respectively.
Prices
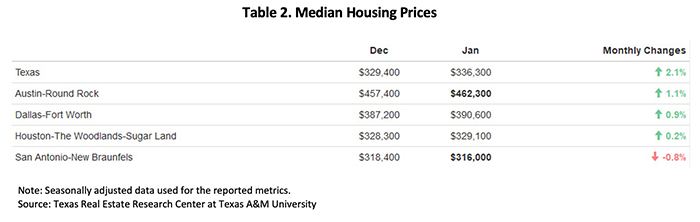
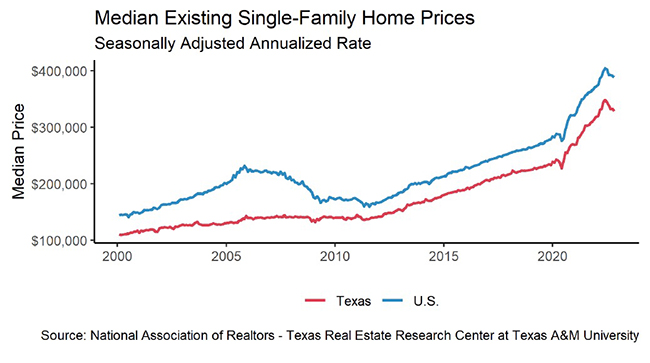
Texas’ median home prices started off the new year with a strengthened housing market. The 2.1 percent MOM rebound was the largest monthly gain since April of last year. All metros posted positive price growth except for San Antonio (Table 2). Median price per square foot (PSF) corroborated with the trend, as San Antonio’s price PSF dropped 1.6 percent MOM to $168.8.
The ten-year U.S. Treasury bond yield continued its four-month decline, reaching 3.5 percent2 in January 2023, while the two-year counterpart decreased to 4.2 percent. The spread between the ten- and two-year bond yields continued to widen for the seventh month straight. The negative spread indicated persistent market uncertainties, and the ten-year bond yield was still far below 2007’s peak of 5.1 percent. The Federal Home Loan Mortgage Corporation’s 30-year fixed-rate moderated slightly this month to 6.3 percent, down 0.1 percent from December.
Rapidly rising mortgage rates have continued to pester the housing market over the past year. The Texas Repeat Sales Home Price Index accounts for compositional price effects and provides a better measure of changes in single-family home values. The January metric was essentially the same as the month before. However, January’s index value of 220 was still 3.9 percent higher than the year before. The same trend also affected the major metros as growth rates shrank from double to single digits, except in Austin, which had a net loss in home values.
_________________
1 All measurements are calculated using seasonally adjusted data, and percentage changes are calculated month over month, unless stated otherwise.
2 Bond and mortgage interest rates are nonseasonally adjusted.
Source – Joshua Roberson, Weiling Yan, and John Shaunfield (March 20, 2023)
https://www.recenter.tamu.edu/articles/technical-report/Texas-Housing-Insight