Texas-Housing-Insight-March-2023

Texas Housing Insight March 2023 Summary

Construction had a great March as it made monumental leaps over February. Meanwhile, active listings dropped as sales continued to rise. Days on market (DOM) increased for yet another month, conflating with the fact that demand is slowing though still trending upward. However, too few existing homes are being put on the market to fill the void. Interest rates’ continued climb and an uncertain economic future were likely contributing factors to possible buyers holding onto their current homes. These factors continue to point to a cooling housing market.

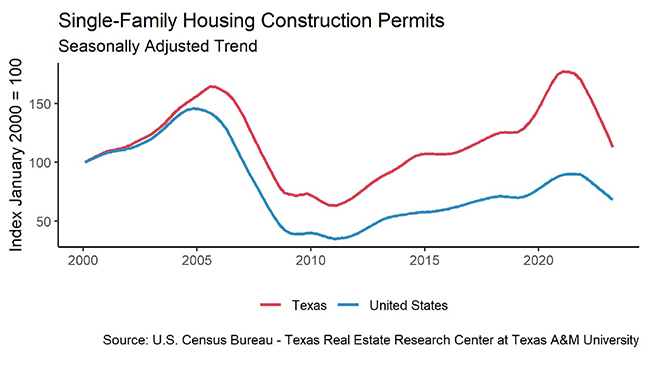
Supply* Recedes as Construction Skyrockets

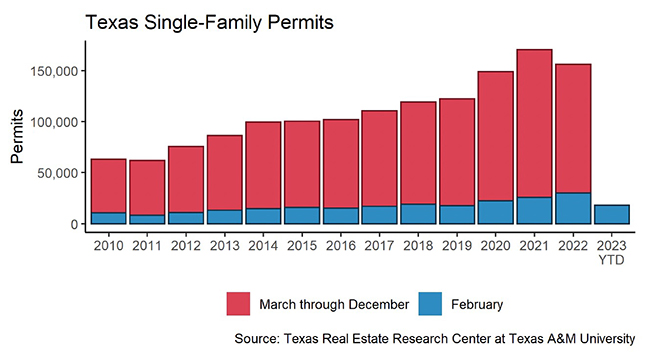
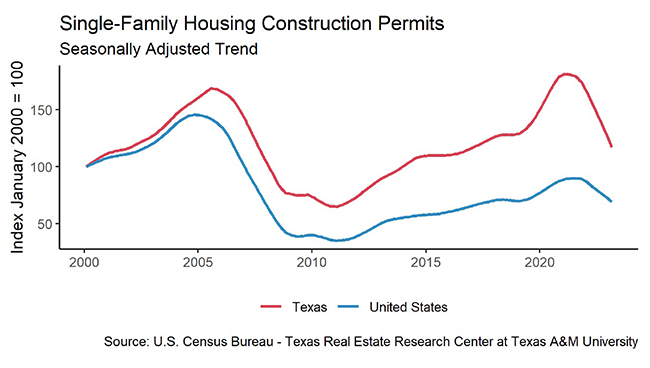
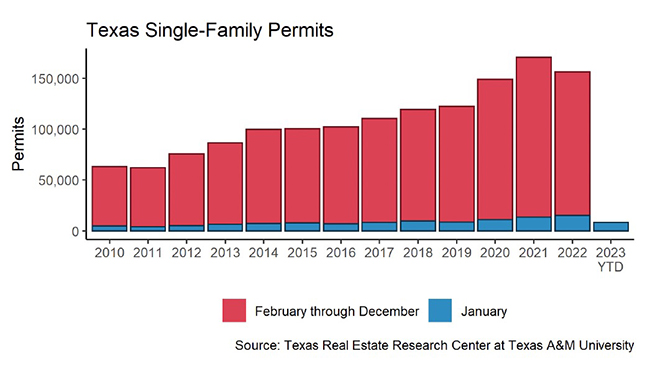
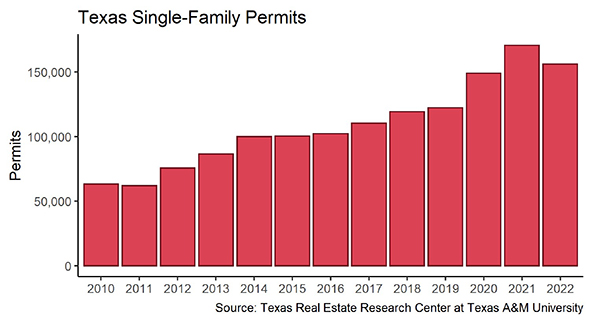
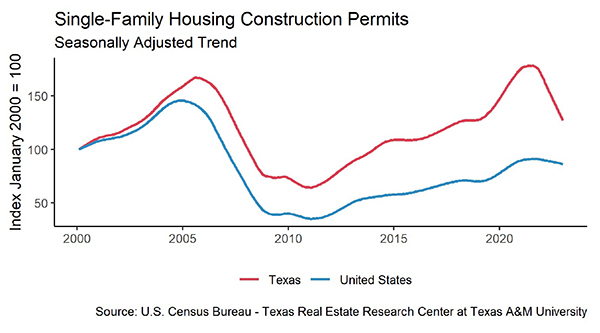
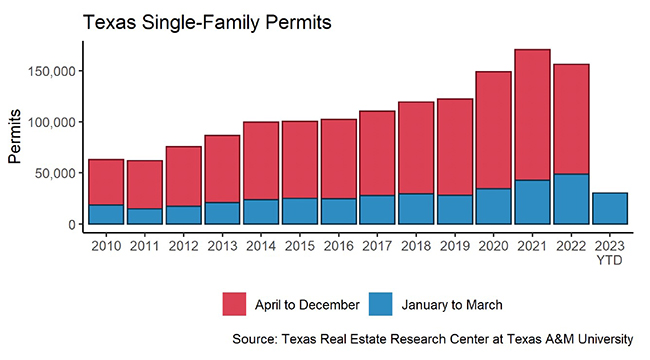
Single-family construction permits have continued increasing since February with 12,431 issued in March, a 23 percent month-over-month (MOM) improvement. All four major metros contributed to the statewide rise, as they all had positive gains for the month. Houston continued to lead the other metros with a 21.5 percent increase (4,616 permits) over last month’s already impressive growth. San Antonio replaced Austin as the metro with the lowest growth at 2.3 percent (605 permits).

Single-family construction starts recorded a strong count in March at 11,478. While nowhere near 2021 and 2022 levels, they are comparable to 2019, which was a strong year and a positive sign for the rest of 2023.  Construction generally hits a seasonal low in December and peaks in March or June.

The state’s total single-family starts value reached $7.1 billion in March, down from $12 billion in March 2022. Houston and Dallas-Fort Worth continue to account for over half of the state’s values, holding a combined 55 percent of the Texas market. Austin and San Antonio remained on par with previous years’ market percentage shares.

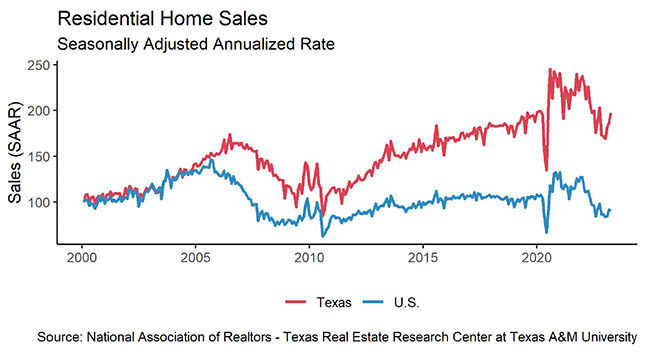
Demand Trends Upward as Sales Remain Strong

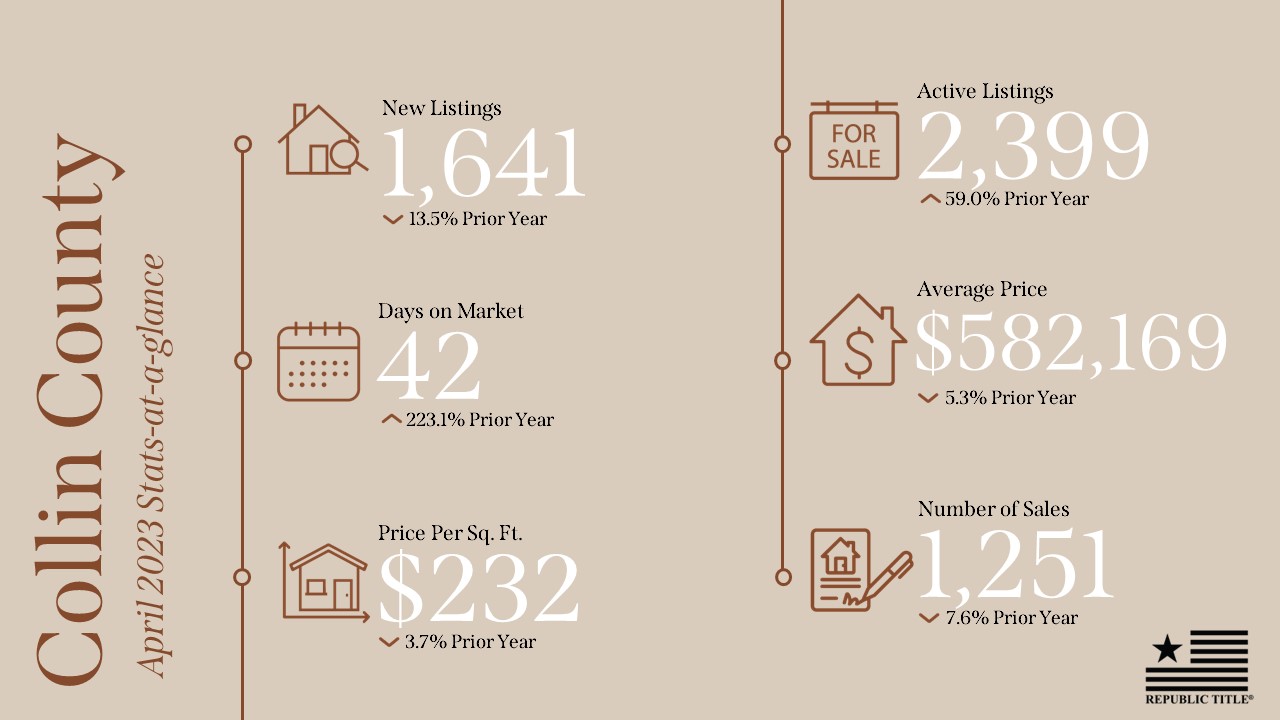
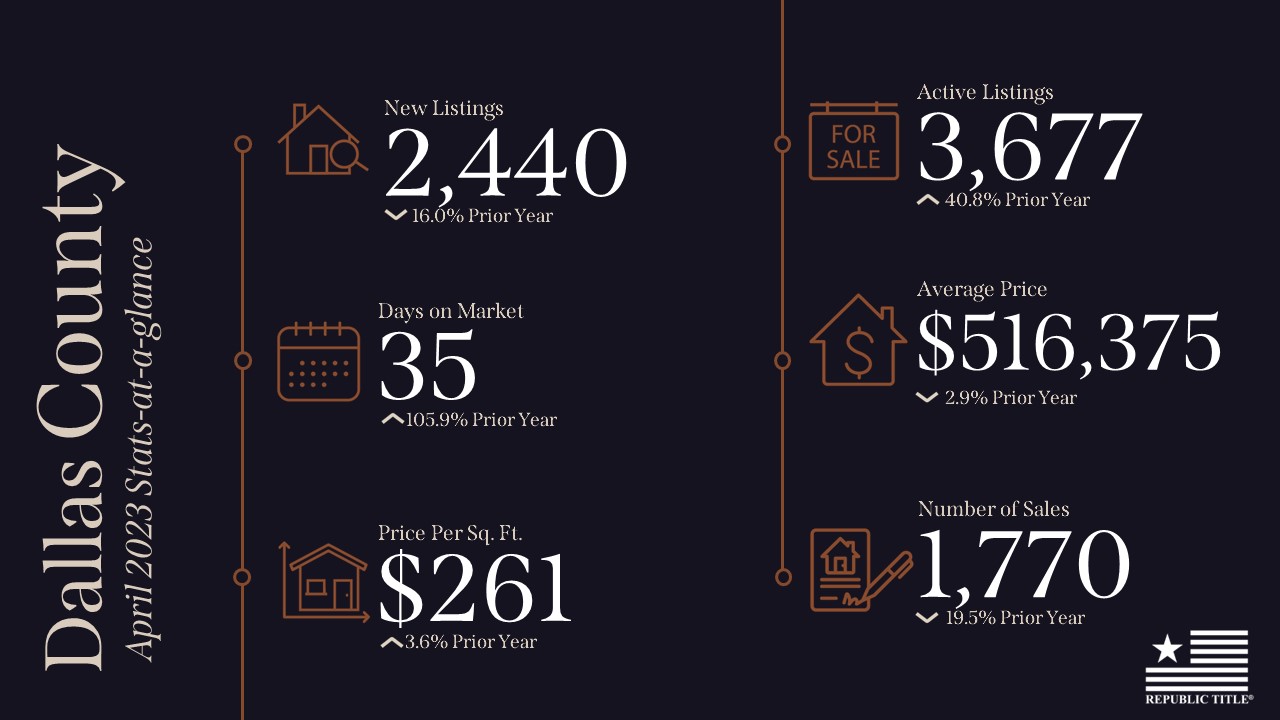
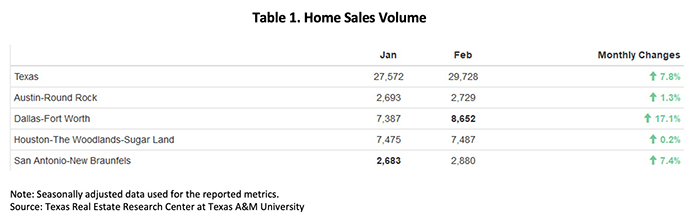
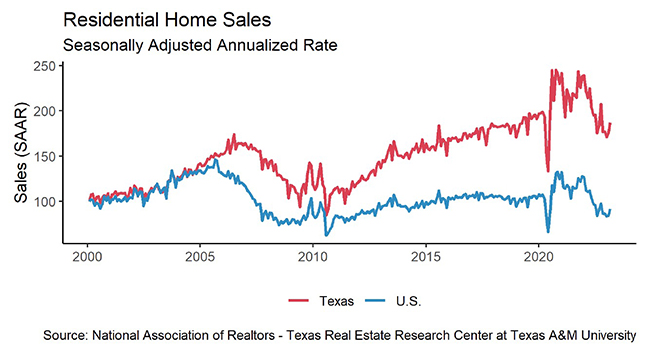
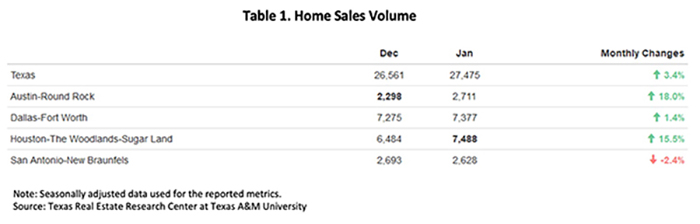
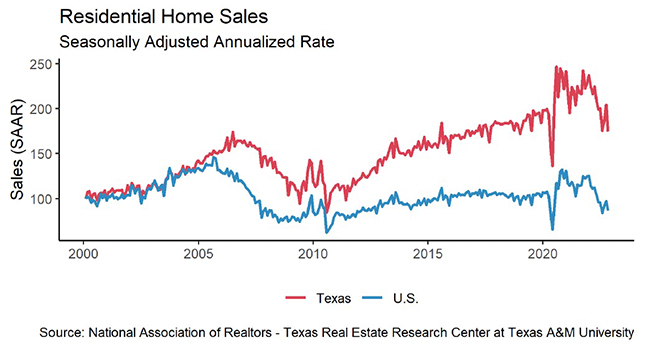
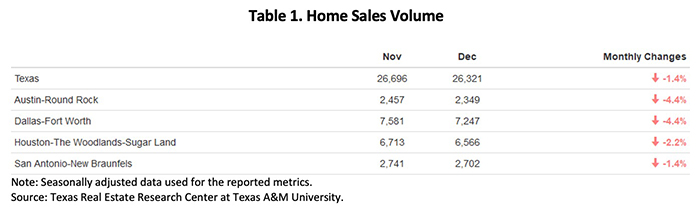
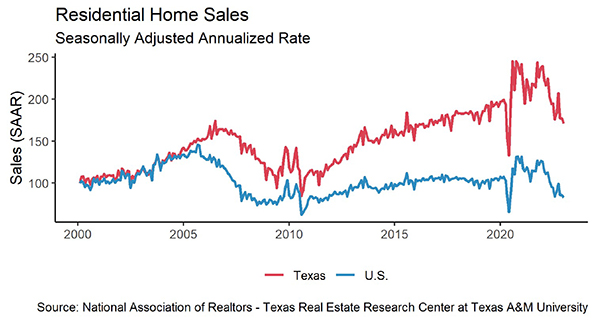
Housing demand started the year off strong with three consecutive months of seasonally adjusted sales growth. Total home sales gained 2.2 percent MOM reaching 30,610 (Table 1). Three of the four major metros have risen in monthly home sales, with Dallas being the only to have a drop, moving 97 fewer homes than the previous month. Houston was the metro with the largest monthly increase in March, reaching a 9.6 percent improvement. Austin and San Antonio lagged Houston and Dallas with sales of 2,738 and 3,103, respectively.  

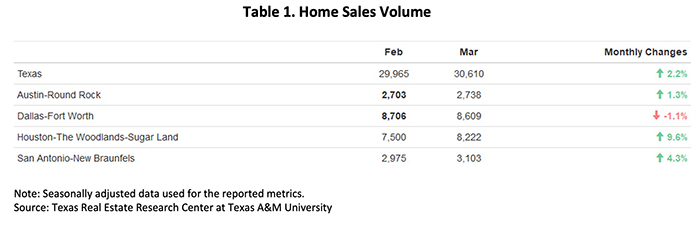
As the metro with the most sales in Texas, Dallas had sales volumes that were consistent with 2022 across price cohorts. However, transactions for homes on the two tails—below $200K and above $750K—both shrank significantly. Transactions in the upper tail dropped to 805 units in March, falling more than 15 percent year-over-year.

Texas’ average DOM steadily advanced to 57 days. Compared with the five-year average of 59 days before 2020, the housing market is fast approaching historic norms. Houston’s homes seemed to be in the hottest market, reporting the lowest DOM level of 51.4 days. Austin’s DOM record kept inching up, marking 72.7 days this month, the longest market time since 2013. This is a major swing from the intense market conditions from just a year ago.

Amid the overall trend of continuously growing house inventories, active listings had their first major dip since March 2022. The 8 percent drop brought the count of available homes in Texas down to 83,497 units. While Austin ticked up 4.5 percent, Dallas dropped marginally. Due to March’s robust sales volumes in Houston and San Antonio, these two metros had a hard time quickly restocking. As a result, they had significant reductions of 8.5 percent and 11.3 percent, respectively. Despite the drop in housing inventories, months of inventory (MOI) resumed an upward trend at three months. The trend was largely sustained by Austin’s increasing MOI.

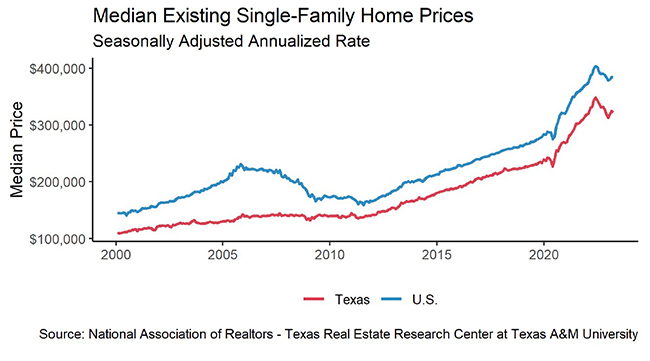
Prices Make Minimal Gains as Long-Term Rates Rise 

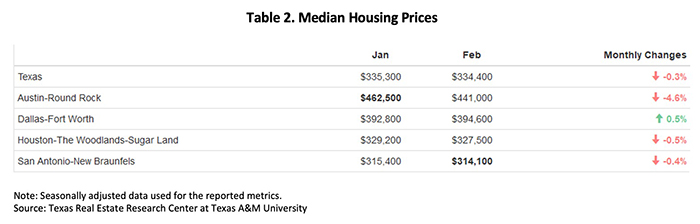
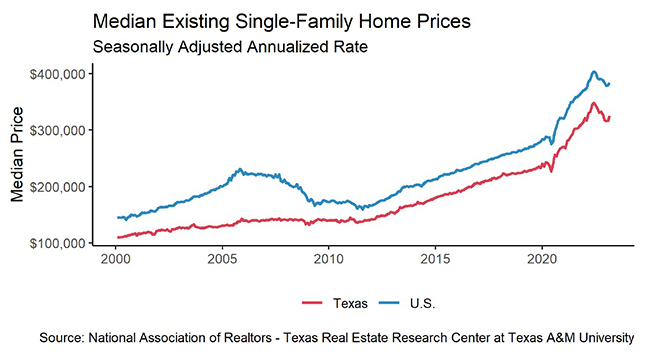
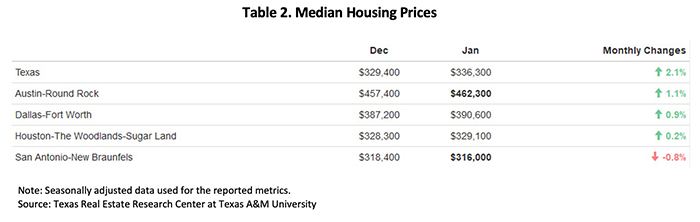
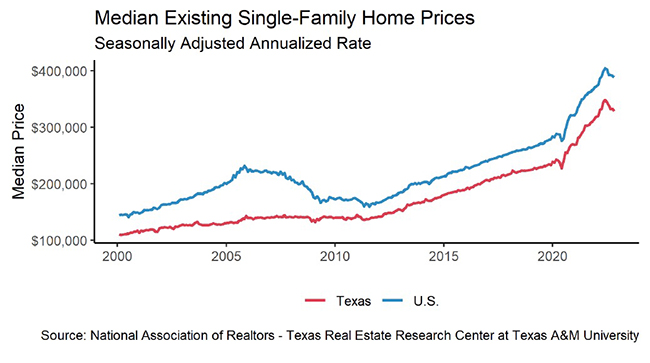
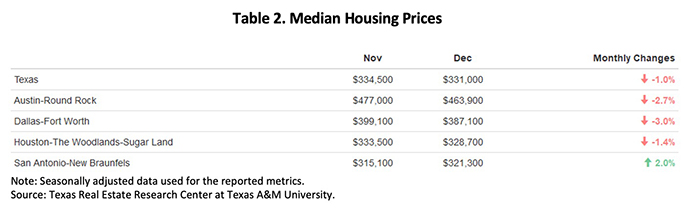
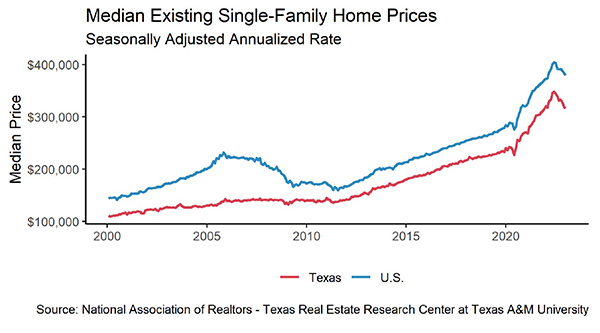
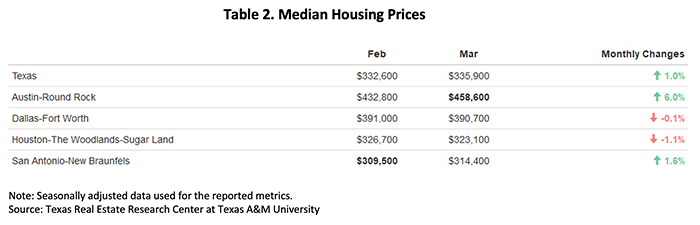
Texas’ median home price inched up 1 percent MOM, and the price was mainly unchanged from a year ago (Table 2). Austin had the greatest rebound of 6 percent since the price correction started in May 2022. Despite the recent improvement, Austin’s median price still fell $70K short of 2022’s market price, diminishing 15 percent. Other than Austin, the remaining three metros did not post drastic changes. Relatively, Houston’s and San Antonio’s housing prices were the most stable among the four major metros, with March prices staying in a reasonable range from the local markets’ peaks.

The ten-year U.S. Treasury bond yield dipped nine basis points MOM to reach 3.6 percent. The Federal Home Loan Mortgage Corporation’s 30-year fixed-rate reversed course as it climbed to 6.5 percent, the first increase since October 2022. 

Though mortgage rates remain high, sales have trended upward and continued through March. The Texas Repeat Sales Home Price Index accounts for compositional price effects and provides a better measure of changes in single-family home values. Texas’ index gained 1.9 percent MOM. Houston was the only metro whose index remained constant, while the four other major metros all had modest increases over February. These modest rises indicate price normalization.

_________________

* All measurements are calculated using seasonally adjusted data, and percentage changes are calculated month over month, unless stated otherwise.

Source – Joshua Roberson, Weiling Yan, and John Shaunfield (May 26, 2023)

https://www.recenter.tamu.edu/articles/technical-report/Texas-Housing-Insight

Slide1

April 2023 DFW Area Real Estate Stats

In April, active listings have increased across all counties compared to last year. However, the demand is outpacing supply, and we need more inventory to meet the growing needs of homebuyers. Excitingly, the average price is slightly down from last year across our area, offering potential savings for home seekers. Moreover, days on market have decreased since last month, signaling a strengthening market and a sense of urgency for those looking to buy or sell.

Our stats infographics include a year over year comparison and area highlights for single family homes broken down by county. We encourage you to share these infographics and video with your sphere.

For more stats information, pdfs and graphics of our stats including detailed information by county, visit the Resources section on our website at DFW Area Real Estate Statistics | Republic Title of Texas.

For the full report from the Texas A&M Real Estate Research Center, click here. For NTREIS County reports click here.

Texas-Housing-Insight-February-2023

Texas Housing Insight February 2023 Summary

February’s housing market shows 2023 has returned to normal seasonal trends, something not experienced since 2019. Housing sales are back on trend with increases for the month, as are construction starts and permits. Rebounding to pre-pandemic levels means sales and construction activity are still decreased compared with the previous two years. This is likely due to inflated mortgage rates and high inflation. Days on market (DOM) increased across all major metros as inventory rose because of deflated demand. All of these factors point to a cooling housing market and a return to form.

Supply* Rises as Inventory Gains Ground

Single-family construction permits reversed their course for February, gaining significant ground with a 17 percent increase month over month (MOM). All four major metros contributed to the statewide rise, as they all had positive gains for February. Houston led the way with a 33 percent increase over last month (3,793 permits), while Austin lagged the rest with a 0.7 percent gain (1,160 permits).

Construction generally hits a seasonal low in December, and peaks in March or June. Single-family construction starts are following this trend with a seasonally adjusted MOM increase of almost 2 percent. December’s low point reached levels not seen since 2015, due in large part to the drastic increase in mortgage rates. March starts, around 9,200 according to Dodge Data & Analytics, pale in comparison to the previous two March levels, which were record-breaking peaks at the time.

The state’s total single-family starts value reached $4.3 billion in February, down from $7.5 billion in February 2022. Houston and Dallas-Fort Worth (DFW) are responsible for more than half of that. Houston continues to account for the largest portion of Texas’ construction values with 29 percent of the market share. DFW accounts for 25 percent.  Austin and San Antonio remained on par with previous years’ market percentage shares.

February’s active listings continued their upward trend since March 2022 after having slowed in the past two months, when the metric fell to 91,000 units after seasonal adjustment. Although, these levels are still lower than pre-pandemic listing levels. Additionally, despite the small dip last month, months of inventory (MOI) returned to an upward trend as inventory levels reached three months. Austin’s MOI fell to just below three months. Dallas followed a similar trend, with MOI dropping to 2.2 months. Meanwhile, Houston and San Antonio bolstered the state with increases, raising the overall months of inventory.

Demand Increases as Sales and Prices Jump

Housing demand started the new year with an upward trend, as sales volume expanded for two consecutive months. Total home sales had a strong boost of 7.8 percent MOM, doubling last month’s 3.7 percent growth. Sales gained more than 2,000 transactions in a month, marching upward to a seasonally adjusted rate of 29,728 closings. Austin and Houston, the two metros that had their great rebound in January, stayed flat this month (Table 1). Meanwhile, Dallas and San Antonio spiked up. Dallas’ 17.1 percent growth brought more than 1,200 additional homes under contract in February.

Sales across all price cohorts continued to follow their normal seasonal cycle with sales increasing through all price cohorts. Homes in the $300K-$400K range remain at the epicenter of the market, making up 28 percent of Texas sales. This constitutes a 2 percent increase in market share for this price cohort over February 2022. DFW increased its market share by a similar 2 percent this month in the same cohort, as the other metros stayed on course with YOY market shares. Despite sales activity picking up, Texas’ average DOM steadily advanced four days in 2023 to 56 days. Compared with the five-year average of 59 days before 2020, the housing market is fast approaching historic norms. Austin posted a ten-year record of 71 days this month, the longest market time since 2013. This is a major swing from the intense market conditions from just a year ago.

Austin homes’ time on market uniformly lengthened across all price cohorts, while other metros had mixed trends. Among the homes valued above $400K, Austin’s DOM ranged from 57 to 69 days, at least ten days longer than the corresponding cohort in the DFW market. Houston homes in the $750K and above price cohort were in a hot market, staying on market only one day longer than homes below $200K.

Prices Flatten as Rates Remain High 

Texas’ median home price mostly stayed flat from the previous month, and only 0.6 percent higher than a year ago (Table 2). However, home prices did fall in Austin with 4.6 percent MOM and 12.2 percent YOY decreases. Dallas and San Antonio still saw low-single-digit price growth from a year ago.

The ten-year U.S. Treasury bond yield reversed the dwindling trend and marched upward 22 basis points to 3.8 percent. The Federal Home Loan Mortgage Corporation’s 30-year fixed-rate saw the fourth consecutive moderation since November, falling to 6.3 percent.

High mortgage rates have discouraged many homebuyers, driving demand down over the past year. The Texas Repeat Sales Home Price Index accounts for compositional price effects and provides a better measure of changes in single-family home values. Texas’ index gained 3.1 percent MOM. Austin stood out with an 8 percent YOY decrease. The other four metros had minor single-digit YOY increases, indicating possible price normalization.

_________________

* All measurements are calculated using seasonally adjusted data, and percentage changes are calculated month over month, unless stated otherwise.

Source – Joshua Roberson, Weiling Yan, and John Shaunfield (April 19, 2023)

https://www.recenter.tamu.edu/articles/technical-report/Texas-Housing-Insight

March 2023

March 2023 DFW Area Real Estate Stats

March 2023 stats are in and we have the numbers! The North Dallas real estate market is seeing some interesting trends! Active listings in Collin, Denton, and Rockwall counties are up over 50% from last year, while the price per square foot has fallen across all counties. This means there are more options available for homebuyers looking to make a move in 2023. Interestingly enough, the list prices have fallen ever so slightly in all counties except Rockwall. Does this signal a shift to a more buyer-friendly market? Inventory will be the deciding factor, so stay tuned for stats this summer to see!

Our stats infographics include a year over year comparison and area highlights for single family homes broken down by county. We encourage you to share these infographics and video with your sphere.

For more stats information, pdfs and graphics of our stats including detailed information by county, visit the Resources section on our website at DFW Area Real Estate Statistics | Republic Title of Texas.

For the full report from the Texas A&M Real Estate Research Center, click here. For NTREIS County reports click here.

Texas-Housing-Insight-January-2023

Texas Housing Insight January 2023 Summary

January home sales increased month over month (MOM), but it was the slowest start since January 2017, a far cry from January levels from both 2021 and 2022. Other housing metrics, such as median price and inventory, may be showing early signs of stabilizing with only minor changes in recent months compared with the major swings experienced during the pandemic.

Supply1

Single-family construction permits had been sliding down in demand since March 2022. January 2023’s permit level fell 6.9 percent MOM to 8,897 permits. The other two months during the past three years that monthly permits dipped below 9,000 were during the initial pandemic shock in April and May 2020. Construction permits fell in all major metros except Austin. While housing demand in Houston (2,842 permits) was mostly flat, Dallas (2,249 permits) dropped more than 15 percent MOM. Austin’s monthly construction demand (1,082 permits) rebounded 10 percent, issuing twice as many permits as San Antonio (481 permits).

Texas single-family construction starts have likewise plummeted since March 2022 but started 2023 with a positive month in January with 9,090 units. Although construction starts rebounded in every major metro, the January metric was the lowest level reported in Texas since 2016, suggesting a meek outlook for the housing industry.

The state’s total single-family starts value diminished from $3.8 billion in January 2022 to $2.2 billion in 2023. Houston and Dallas continue to account for more than half of the states total, coming in at 27.5 percent and 26.1 percent, respectively. Further pressing the point home that housing activity is down from the previous year, Austin and San Antonio had their construction values nearly cut in half in the first month of 2023.

The rebound in active listings had been aggressive since March 2022. However, the acceleration slowed in the past two months as the metric fell flat at a seasonally adjusted rate of 91,000 units. Compared with the first half of 2022 when inventory was 50 percent short of pre-pandemic levels, housing inventory was only 4.5 percent short in January. Active listings in Austin have more than tripled from a year ago, reaching 8,500 units. Amid the recent flattening, months of inventory (MOI) dipped for the first time in the past eight months. The MOI for the four major metros ranged from 2.5 months to 3.4 months. While Dallas, Austin, and San Antonio all either hovered back or beyond pre-pandemic levels, Houston’s housing supplies still needed more homes to restock.

Demand

Total home sales inched up 3.4 percent MOM to a seasonally adjusted rate of 27,475 sales. This uptick marked the largest MOM jump since the second half of 2022. Sales in Austin and Houston rebounded greatly, with the former metro surpassing San Antonio’s sales volume and the latter surpassing Dallas’ (Table 1). While the housing market opened robustly in 2023, Texas’ sales still diminished by over 20 percent compared with last year’s January metric.

Sales grew across all price cohorts. While homes below $300K still make up 40 percent of the market, this sector’s sales volume rebounded least at 0.5 percent MOM. The remaining price cohorts ascended moderately at a low-single-digit growth, but homes above $750K grew at an impressive rate of 21.6 percent MOM, accounting for almost 9 percent of the market. 

With sales activity picking up, the Texas’ average days on market (DOM) continued to climb but at a slower pace of 54 days. Compared with the five-year average of 59 days before 2020, this is still converging to historic norms; and it is tilting toward a weaker market that favors buyers. Quadrupling since March 2022, Austin posted a first dip in DOM—balancing at 61 days.

Across all price cohorts except one, DOM rose to a range of 50 to 58 days, a three-day average increase across all the cohorts. The $400K-$500K housing sector’s DOM declined by 5.8 days over the previous month. Meanwhile, homes priced over $750K had a 55 DOM, one day higher than the $300K-$400K cohort.

Compared with a surge to 69 percent in 3Q2020 during the pandemic frenzy, Texas’ homeownership rate had been cooling, hovering around 63.6 percent in 2022. At the metropolitan level, the Dallas-Fort Worth (DFW) area was lowest at 56 percent, while Houston was highest at 67 percent. Austin and San Antonio were at 65 and 60 percent, respectively.

Prices

Texas’ median home prices started off the new year with a strengthened housing market. The 2.1 percent MOM rebound was the largest monthly gain since April of last year. All metros posted positive price growth except for San Antonio (Table 2). Median price per square foot (PSF) corroborated with the trend, as San Antonio’s price PSF dropped 1.6 percent MOM to $168.8.

The ten-year U.S. Treasury bond yield continued its four-month decline, reaching 3.5 percent2 in January 2023, while the two-year counterpart decreased to 4.2 percent. The spread between the ten- and two-year bond yields continued to widen for the seventh month straight. The negative spread indicated persistent market uncertainties, and the ten-year bond yield was still far below 2007’s peak of 5.1 percent. The Federal Home Loan Mortgage Corporation’s 30-year fixed-rate moderated slightly this month to 6.3 percent, down 0.1 percent from December.

Rapidly rising mortgage rates have continued to pester the housing market over the past year. The Texas Repeat Sales Home Price Index accounts for compositional price effects and provides a better measure of changes in single-family home values. The January metric was essentially the same as the month before. However, January’s index value of 220 was still 3.9 percent higher than the year before. The same trend also affected the major metros as growth rates shrank from double to single digits, except in Austin, which had a net loss in home values.

_________________

1 All measurements are calculated using seasonally adjusted data, and percentage changes are calculated month over month, unless stated otherwise.

2 Bond and mortgage interest rates are nonseasonally adjusted. 

Source – Joshua Roberson, Weiling Yan, and John Shaunfield (March 20, 2023)

https://www.recenter.tamu.edu/articles/technical-report/Texas-Housing-Insight

Slide1

February 2023 DFW Area Real Estate Stats

Attention home buyers and sellers! The February real estate stats are in and it’s important to stay informed. Active listings are up in every county compared to last year, providing more choices for home buyers. However, days on market are also up in every county, indicating a more competitive market for sellers. In Dallas County, new listings are down 7.4% from last year, but Collin County and Denton County are seeing an increase in new listings. It’s a unique moment in the housing market, so stay informed before making any decisions!

Our stats infographics include a year over year comparison and area highlights for single family homes broken down by county. We encourage you to share these infographics and video with your sphere.

For more stats information, pdfs and graphics of our stats including detailed information by county, visit the Resources section on our website at DFW Area Real Estate Statistics | Republic Title of Texas.

For the full report from the Texas A&M Real Estate Research Center, click here. For NTREIS County reports click here.

Slide1

January 2023 DFW Area Real Estate Stats

January 2023 stats are in!

In January 2023, new listings are up in all North Texas counties that we report on over December 2022 so the much-needed inventory is coming to market.

Active listings are up across the board compared to this time last year ranging from 71% increase in Dallas County to 195% increase in Denton County. Compared to January 2022, average sales price has increased in each county except Denton which was down slightly.

Dallas is expected to be the top buyer’s market in the nation by year-end 2023 so all eyes are on the Spring selling season!

Our stats infographics include a year over year comparison and area highlights for single family homes broken down by county. We encourage you to share these infographics and video with your sphere.

For more stats information, pdfs and graphics of our stats including detailed information by county, visit the Resources section on our website at DFW Area Real Estate Statistics | Republic Title of Texas.

For the full report from the Texas A&M Real Estate Research Center, click here. For NTREIS County reports click here.

Texas-Housing-Insight-December2022

Texas Housing Insight December 2022 Summary

Housing was one of the primary contributors to inflation in 2022. The pandemic-induced housing frenzy officially ended when the Federal Reserve began raising interest rates in June in an attempt to curb inflation. Since then, mortgage rates and the possibility of a recession sidelined many potential buyers. Demand in Texas plummeted as annual housing sales fell more than 10 percent. Supplies started returning to pre-pandemic levels. Amid 2022’s drastic changes, many housing indicators improved as homebuilders and buyers quickly adapted.

Supply1

Homebuilders initiated fewer building projects than they did before the pandemic. Year-end single-family construction permits had a net loss of 8.4 percent year-over-year (YOY), shrinking from 170,557 permits to 156,189 permits in 2022. Monthly permits were flat in December, with fewer than 10,000 permits issued. Construction permits fell in all major metros. While housing demand in Dallas (2,786 permits) was mostly flat, Houston (2,886 permits)—the metro with the most construction permits in the nation—dipped 10 percent month-over-month (MOM). The gap between Austin’s (982 permits) and San Antonio’s (592 permits) housing expansion narrowed, as Austin’s monthly construction demand fell below 1,000 monthly permits for the first time since 2016.

Construction generally slows during the winter, and Texas’ single-family construction starts plummeted 33.5 percent from December 2021 to 10,203 units, corroborating a slowdown in the housing industry when accounting for the winter slump. According to Zonda, quarterly construction starts continued the fall from 3Q2022 in Texas’ four major metros except for Dallas-Fort Worth (DFW). While DFW’s construction starts rebounded 26.4 percent quarter-over-quarter (QOQ) and surpassed pre-pandemic levels, the remaining three metros fell short of 4Q2019 levels.

The state’s total single-family starts value diminished from $44.5 billion in 2021 to $38.4 billion. Houston and Dallas together contributed more than half of the state’s total at 29.6 percent and 26.6 percent, respectively. Austin’s market share was double that of San Antonio at 12.8 percent.

Active listings were flat at a seasonally adjusted rate of 91,600 units. Compared with the five-year average of 94,800 units before the pandemic, housing inventory was only 4.5 percent away from returning to the pre-pandemic volume. A year prior, inventory fell 50 percent short of pre-pandemic levels. Active listings in Austin fell 7 percent from November’s peak to 8,400 units, the first monthly dip since March 2022. This modest decline suggests Austin’s housing market may have returned to the traditional ebbs and flows seen before covid. Amid the recent slowdown, statewide months of inventory (MOI) ticked up to three months. The MOI for the four major metros ranged from 2.6 months to 3.4 months. While Dallas, Austin, and San Antonio inventories returned to pre-pandemic levels, Houston’s inventory was still below. 

Demand

Nearly 30 percent of total home sales vanished from December 2021 to December 2022.  In the past 12 months, sales volume sank from 37,200 to 26,300 closed listings. On a yearly basis, Houston lost the most in terms of both percentage and total volume, losing close to 35 percent and 3,500 units. On a monthly basis, Austin and Dallas lost the most in terms of YOY percent decline at 4.4 percent (Table 1).

Rising mortgage rates affect home sales disproportionately across price cohorts. For example, when the housing frenzy started to cool in the first half of the year, the affordable home market (homes below $300K) was hit first, beginning a streak of quarterly declines. Next, as the Fed’s interest rates became more aggressive in the second half of the year, the higher-end home market (homes above $750K) was hit worst, shrinking in a downward trend twice as fast as the affordable home market’s declining rate. Thus, affordable housing was hit first by rising mortgage rates with pricier homes following suit later in the year. 

With sales activity slowing, homes are sitting on the market longer. Texas’ average days on market (DOM) rose to 52. Compared with the five-year average of 59 days before 2020, the latest DOM metric suggests the housing market is quickly approaching historic norms. Annually, Austin’s DOM rose most aggressively, jumping from 19 days to 67 days. Constrained by diminishing sales, Houston had the most moderate DOM rebound, rising from 32 to 51 days.

Before the pandemic, the state’s DOM ranged from 55 days to 83 days. Now, DOM ranged from 48 days to 59 days. The relatively truncated DOM interval implies the housing market still has room to improve. Another metric that signals the housing market can be more relaxed is DOM for pricier homes. Typically, the most expensive homes sit on the market the longest. However, DOM for homes priced over $750K was 50 days—shorter than homes in the $400K-$500K price cohort.

Prices

Texas’ median home price peaked in May at $349,900 and has since been falling. Despite the price correction in the second half of the year, the state’s median price still rose 3.7 percent compared with a year ago. Homes in the Austin metro were most volatile, as the median price fell more than $78,000 from its peak, settling at a seasonally adjusted rate at $463,900 (Table 2). Austin was also the only metro area that reported a net loss YOY, while Dallas, Houston, and San Antonio reported YOY growth between 4.4 and 6.1 percent.

Median home price for new construction was over 15 percent higher than existing homes.

The ten-year U.S. Treasury bond yield dropped 27 basis points to 3.6 percent2 in December, while the two-year counterpart was at 4.3 percent. The spread between the ten- and two-year bond yields continued to widen. The negative spread indicated persistent market uncertainties, and ten-year bond yield was still far below 2007’s peak of 5.1 percent. The Federal Home Loan Mortgage Corporation’s 30-year fixed-rate moderated slightly this month to 6.4 percent, dropping from an all-time high of 6.9 percent in October.

Rapidly rising mortgage rates hit home prices hard over the past 12 months. The Texas Repeat Sales Home Price Index accounts for compositional price effects and provides a better measure of changes in single-family home values. Compared with December 2021’s 20.1 percent YOY increase, Texas’ index accelerated 5.5 percent YOY in December 2022, indicating price normalization. The same trend also affected the major metros as growth rates shrank from double- to single-digits, except in Austin, which had a net loss in home values.

According to the Texas Housing Affordability Index (THAI), purchase affordability decreased to 1.1 in 4Q2022, indicating median family income was 10 percent more than the required income to buy the median-priced home. This metric was down 35 basis points from 1.45 in 4Q2021, and it suggested that despite slowing home price appreciation, households faced more financial burden to buy a home due to the higher mortgage rate. For more information on how higher interest rates affect homebuying, read “How Higher Interest Rates Affect Homebuying.” 

_________________

1 All measurements are calculated using seasonally adjusted data, and percentage changes are calculated month over month, unless stated otherwise.

2 Bond and mortgage interest rates are nonseasonally adjusted. 

Source – Joshua Roberson and Weiling Yan (February 14, 2023)

https://www.recenter.tamu.edu/articles/technical-report/Texas-Housing-Insight

Slide1

2022 DFW Real Estate Year-End Stats at a Glance

Our second annual stats report of the DFW real estate market is here!

We’ve taken our monthly stats-at-a-glance reports from January through December of 2022, totaled, averaged, and compared the data to the numbers from 2021.  The result is an annual report of the DFW real estate market in 2022.  

For more stats information, pdfs and graphics of our stats including detailed information by MLS area and condo stats, visit the Resources section on our website at DFW Area Real Estate Statistics | Republic Title of Texas.

December 2022 Stats

December 2022 DFW Area Real Estate Stats

December 2022 Stats are IN!  Collin county shows an increase in all categories except number of sales compared to December of ’22.  Dallas County’s new listings for December were down 22% compared to last year, but active listings were up considerably from where they were a year ago. The average sales price was even down slightly at 1.4% as were the actual number of sales which is in line with the overall market.

In Denton County, the story is the same with new listing down and active listings up along with the average sales price and price per square foot. In Rockwall the numbers reflect generally the same situation.  As we begin 2023 however, the number of listings coming on the market looks strong and it appears that we are still in very good shape in the Metroplex! Happy Selling!

Our stats infographics include a year over year comparison and area highlights for single family homes broken down by county. We encourage you to share these infographics and video with your sphere.

For more stats information, pdfs and graphics of our stats including detailed information by county, visit the Resources section on our website at DFW Area Real Estate Statistics | Republic Title of Texas.

For the full report from the Texas A&M Real Estate Research Center, click here. For NTREIS County reports click here.