Slide1

October 2023 DFW Real Estate Stats

October Stats are in! In Collin, Dallas, Denton, Tarrant and Rockwall Counties, new Listings, active listing counts, days on market, average sales prices are up a few percentage points from last year. Closed sales across the counties, with the exception of Collin County with 1122 sales in October are down a few percentage points from 2022. Good news for Buyers who have more choices as we move into the winter! Also please note that we have included condominium statistics for all counties. Happy Thanksgiving from all your friends at Republic Title!

In this ever-evolving real estate landscape, understanding local market trends is essential. Whether you’re buying, selling, or investing, our team is here to provide expert guidance tailored to your needs.

Our stats infographics include a year over year comparison and area highlights for single family homes broken down by county. We encourage you to share these infographics and video with your sphere.

For more stats information, pdfs and graphics of our stats including detailed information by county, visit the Resources section on our website at DFW Area Real Estate Statistics | Republic Title of Texas.

For the full report from the Texas A&M Real Estate Research Center, click here. For NTREIS County reports click here.

Slide1

September 2023 DFW Real Estate Stats

In September 2023, active listings varied across counties. Collin County witnessed a 10% decline, Denton County experienced a 10% decrease, while Dallas County and Tarrant County saw increases of almost 4% and 3.7% respectively. Rockwall County noted a 4.5% reduction in active listings.

Regarding closed price per square foot, Collin County saw an increase of 2.3%, Dallas County experienced a 3% rise, Denton County remained flat, and Rockwall County and Tarrant County witnessed decreases of 3.6% and 1.1% respectively. Average days on Market are still up across the board over 2022 with Rockwall County having the largest increase of 97% increase.

In this ever-evolving real estate landscape, understanding local market trends is essential. Whether you’re buying, selling, or investing, our team is here to provide expert guidance tailored to your needs.

Our stats infographics include a year over year comparison and area highlights for single family homes broken down by county. We encourage you to share these infographics and video with your sphere.

For more stats information, pdfs and graphics of our stats including detailed information by county, visit the Resources section on our website at DFW Area Real Estate Statistics | Republic Title of Texas.

For the full report from the Texas A&M Real Estate Research Center, click here. For NTREIS County reports click here.

Texas-Housing-Insight-August-2023

Texas Housing Insight August 2023

August was a positive month for Texas’ residential real estate industry. Despite persistently high interest rates, total home sales picked up 9.5 percent on the consumer side, and construction permits accelerated by 5.3 percent on the supplier side. Amid the growth, the median price slipped for the first time after seven consecutive upticks. While the price drop seemed noteworthy, it was moderate at $800 and may reflect a balanced market. With many sellers stuck with pandemic-era low rates and many buyers struggling to keep up with rising costs, the housing market does not signal any significant volatility anytime soon.

Rebounded Home Sales Speed up Market Time by Two Days

Amid a slowdown in the real estate industry, Texas’ total home sales improved from last month’s three-year low after reaching over 27,000 transactions in August. The sales activity picked up at an impressive rate of 9.5 percent month-over-month (MOM), albeit the activity level was still 8 percent lower than last year’s reading. Sales ticked up uniformly this month in all four major metros, growing between 0.8 percent to 9.7 percent (Table 1).

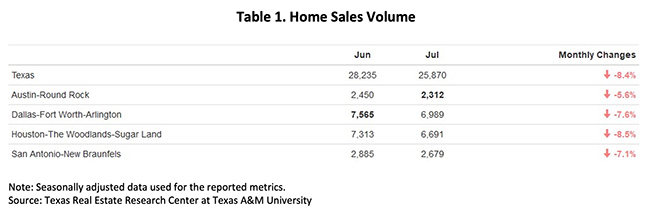
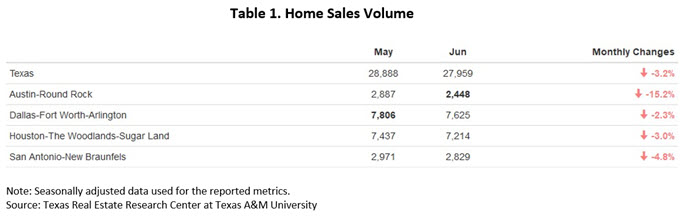
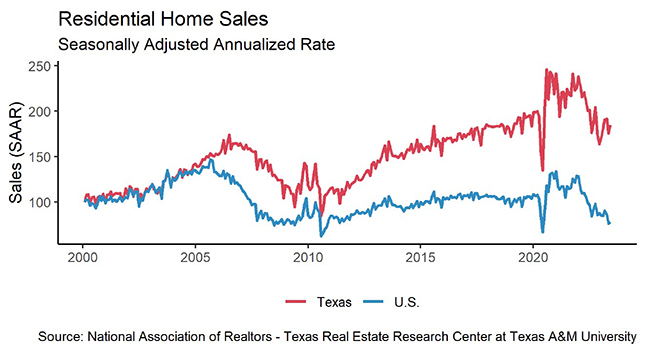
Reduced home sales were mostly reflected by constrained sales of existing homes, while the new construction market hiked in demand. Sales for new construction grew by 20 percent in a year. Correspondingly, the market share of new construction sales climbed five percentage points to 21.7 percent. This indicates that for every five closed listings, one will be a new home. Both demand and supply factors contributed to the increasing trend for new homes. The shortage of existing homes is due to current owners’ reluctance to give up their homes in exchange for a higher-cost home.

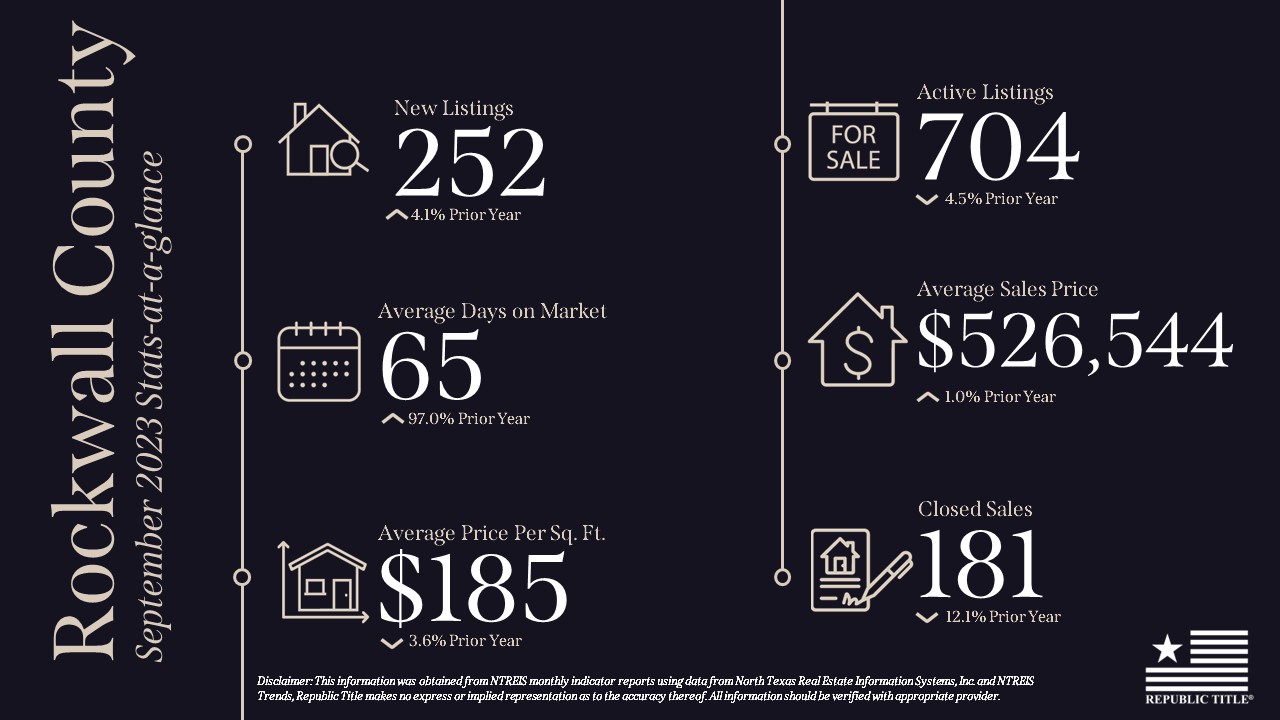
After balancing at 57 days for two months, the state’s average days on market (DOM) dropped to 55 days, deviating from the steep rebounding trend that lasted for over a year. For the past six months, readings fluctuated between 55 days and 59 days. That small range suggests the housing market may be stabilizing. Among the major metros, Austin (69 days) and San Antonio (66 days) reported a longer-than-average DOM, while Dallas and Houston had DOM figures of 47 days and 48 days, respectively.

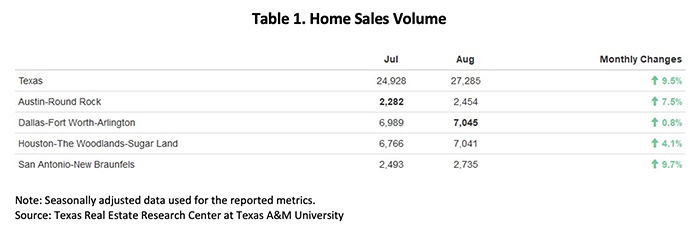
Housing supplies are stocking up, as active listings have trended upward since February, and the accumulation speed is accelerating. In August, the number of homes available for sales rose 5.9 percent, reaching 90,750 listings. The four major metros posted monthly gains between 4.4 percent and 5.2 percent, with Dallas leading the pack. The state’s new listings rose 5.7 percent to 40,620 units, with Austin contributing a double-digit jump and an increase of 642 units. Despite the rise in active listings, months of inventory (MOI) had a marginal loss to 3.2 months due to recouped home sales.

High Mortgage Rates Push Down Loan Applications by One Fifth

Since the Fed initiated the series of interest rates hikes, both treasury rates and mortgage rates have increased accordingly. The ten-year U.S. Treasury Bond yield has had an average yield of 3.8 percent in 2023, up from 3 percent in 2022 and 1.5 percent in 2021. The expectation of further rate hikes pushed the bond yield to a new high since the Great Recession in 2008 at 4.2 percent.

Elevated by the bond yield, the Federal Home Loan Mortgage Corporation’s 30-year fixed-rate inched up to 7.1 percent, up 23 basis points. The inflated mortgage rate is expected to further raise the cost of homeownership and decrease mortgage applications. Under the pressure of high mortgage rates, mortgage loan applications have fallen in 2023 with the annual high in January. In the past eight months, the Mortgage Bankers Association reported a volume index drop of over 20 percent. 

Momentum for Housing Inventories Might Be Forthcoming

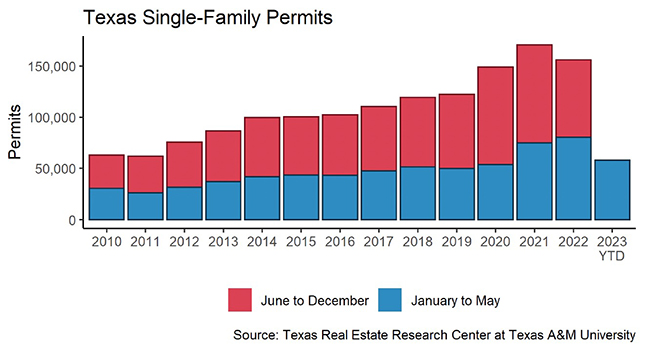
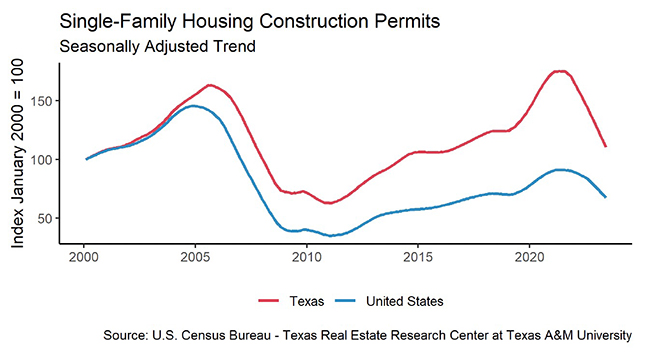
Texas’ single-family construction permits rose 5.3 percent MOM to 13,160 issuances. This rise highlights August as the second month this year with more than 13,000 houses approved for construction. All four major metros reported growing demand except for San Antonio (630 permits), falling 16.4 percent MOM. Of the other three metros, Houston led with close to 4,500 permits, accounting for a third of the state’s total permits for future homebuilding. Dallas followed with 3,980 permits. Austin (1,717 permits), which had drastic construction slowdown with last year’s price correction, finally jumped out of the lows, reporting impressive rebounds with a double-digit growth rate.

Construction starts grew alongside construction permits. After five consecutive months of growth, single-family construction starts in Texas inched up to 11,950 units. Both Dallas and Houston led with over 3,300 houses breaking ground, surpassing the combined total of other metros outside the “Big Four.” Home project starts in Austin (1,810 starts) and San Antonio (810 starts) surpassed the typical 2:1 ratio.

The state’s total single-family starts value reached $21.2 billion, up from $18.8 billion in July. While the current starts value fell short of the peak during the 2020-22 pandemic frenzy, it mirrored the construction activity levels observed in 2019. Notably, Houston and Dallas remain pivotal players, contributing to more than half of the state’s construction activity values. Dallas’ market share rose to 27.6 percent, closely trailing Houston’s 27.7 percent share.

Price Gains Pause for the First Time This Year

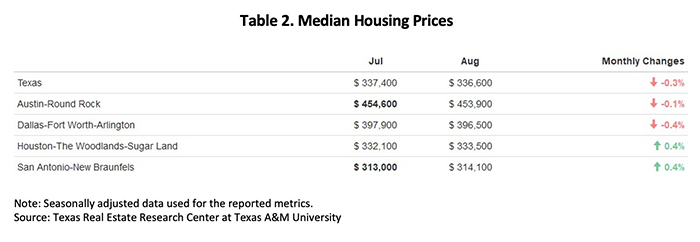
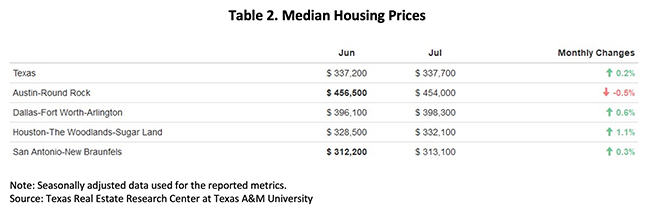
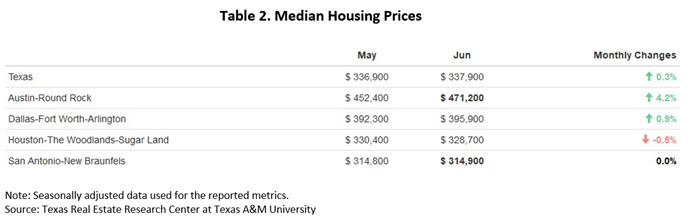
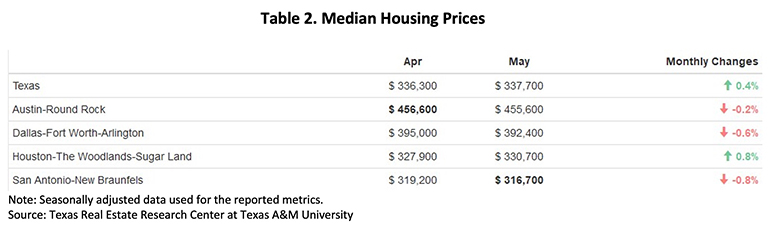
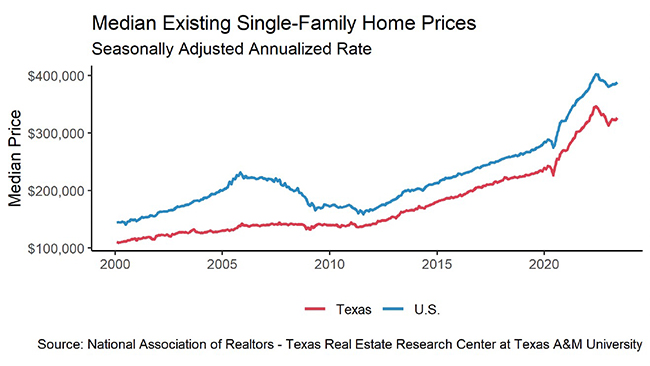
This year’s steady price gains took a pause in August as Texas‘ median home price dipped. Despite the 0.3 percent MOM decrease, the seasonally adjusted price at $336,600 was still at a higher standing than the June reading. The state’s housing market signaled no large volatility, as the Big Four metros reported monthly changes of less than 0.5 percent. At the metro level, Austin’s median price remained elevated at $454,000, while Dallas followed with $396,500 (Table 2).

After reaching record prices last year, the four major metros have split into two groups with their price directions. Dallas and Houston—the two largest housing markets—had been regaining some strength in their median prices, inching up 2.4 percent and 1.8 percent year to date (YTD), respectively. Meanwhile, Austin and San Antonio had not yet geared up for a new price momentum, falling behind 0.6 percent and 0.3 percent YTD, respectively.

The Texas Repeat Sales Home Price Index (Dec 2004=100) peaked in July and stayed relatively stable in August. After suffering major price corrections earlier in the year, home price growth has gradually grown back to rates comparable to the peaks from last year.

Source – Joshua Roberson, Weiling Yan, and Koby McMeans (October 13, 2023)

https://www.recenter.tamu.edu/articles/technical-report/Texas-Housing-Insight

Slide1

August 2023 DFW Real Estate Stats

The North Texas real estate market in August 2023 continues to present intriguing dynamics. Here’s the latest data:

Average Days on Market:

  • Average days on market up across the board with Collin County up 47.8%, Dallas County up 33.3%, Denton County up 81%, Tarrant County up 70% and…Rockwall County: Surging over 2022 with an increase of 109%

Closed Sales Year Over Year:

  • Across all counties: Down, indicating a challenging market

Average Sales Prices:

  • Dallas County: On the rise by a remarkable increase of 16% , with an average sales price of $550,540
  • Collin County: Down slightly (2.2%), with an average sales price of $594,537

In this ever-evolving real estate landscape, understanding local market trends is essential. Whether you’re buying, selling, or investing, our team is here to provide expert guidance tailored to your needs.

Our stats infographics include a year over year comparison and area highlights for single family homes broken down by county. We encourage you to share these infographics and video with your sphere.

For more stats information, pdfs and graphics of our stats including detailed information by county, visit the Resources section on our website at DFW Area Real Estate Statistics | Republic Title of Texas.

For the full report from the Texas A&M Real Estate Research Center, click here. For NTREIS County reports click here.

Texas-Housing-Insight-July-2023

Texas Housing Insight July 2023 Summary

The persistent rise in mortgage rates continued to exert a cooling effect on the housing market. Texas’ home sales experienced an 8.4 percent year-over-year decline in July. Despite this diminished home demand, the scarcity of existing home sales contributed to a 2.1 percent increase in the state’s median price in 2023, leaving the index for shelter the greatest driver behind the escalating living costs. While existing home sales declined, residential construction starts continued to climb. At the same time, permits have fallen for several consecutive months, signaling a possible decline in starts in the near future.

Housing Market for New Construction in High Demand

More prospective buyers are dissuaded from making a home purchase in today’s high-interest environment, leading to a drop in sales. Compared with last month’s reading at 28,000 and July 2020’s record high at 38,400 transactions, Texas’ total home sales fell below 26,000 transactions this month. Monthly sales volume contracted 8.4 percent month over month (MOM) and 32 percent in three years (Table 1).

Despite the reduced housing demand, the market share of new construction sales ballooned. Within a year, the share of new construction sales rose from 15.2 percent to more than 20 percent, indicating every five closed listings is now a new home. Both demand and supply factors contributed to the increasing trend for new homes. The shortage of existing homes is due to current owners’ reluctance to give up their current homes. For more information on Austin’s new construction, read “Austin Home Price Illusion” at https://www.recenter.tamu.edu/articles/tierra-grande/Austin-Home-Price-Illusion-2378.

Texas’ average days on market (DOM) stayed at 56 days for the second straight month, deviating from the steep rebounding trend that lasted for over a year. The current reading is merely three days short of the five-year average before 2020, which stood at 59 days. The consistent reading suggests that the housing market may have reached a state of equilibrium. Among the major metros, Austin and San Antonio reported a longer-than-average DOM of 69 days, while Dallas and Houston had DOM figures of 46 days and 49 days, respectively.

The number of active listings rose to 2.3 percent, reaching just above 85,000 listings. All four of the major metros posted positive monthly gains with Dallas accounting for the largest gain at 5.7 percent MOM while Houston remained at last month’s level with a 0.4 percent MOM game. Conversely, the state’s new listings dipped by 12.7 percent to 36,880 units, with Dallas contributing significantly to this double-digit decline by registering a decrease of 1,800 units in July. Amid the rise in active listings, months of inventory (MOI) had a marginal gain to 3.3 months.

Since the Fed hiked interest rates by another quarter point, both treasury rates and mortgage rates increased in July. The ten-year U.S. Treasury Bond yield grew 15 basis points, reaching 3.9 percent. Likewise, the Federal Home Loan Mortgage Corporation’s 30-year fixed-rate increased to 6.8 percent, up 13 basis points. The inflated mortgage rate is expected to further raise the cost of home ownership and decrease mortgage applications.

Single-Family Permit Levels Continue to Drop

Texas’ single-family construction permits shrank to 12,240 applications in July after seasonal adjustment, marking a 3 percent MOM decrease. Houston’s (4,070 permits) contribution to the monthly shrinkage was prominent, as permits plummeted 17.8 percent MOM. Although Austin (1,380 permits) reported the largest rebound of 34.3 percent MOM, the gain was not enough to cover half of Houston’s loss. Dallas (3,540 permits) and San Antonio (760 permits) maintained their activity levels like June.

Construction starts had not yet reflected the decline in construction permits. After three consecutive growths, single-family construction starts in Texas balanced at 11,450 units. Both Dallas and Houston led with over 3,200 houses breaking ground, surpassing the combined total of other metros outside the “Big Four.” The ratio between home projects in Austin (1,580 starts) and San Antonio (810 starts) remained at approximately 2:1.

The state’s total single-family starts value reached $18.8 billion, up from $15.9 billion in June. While the current starts value fell short of the peak during the pandemic frenzy in 2020-22, it aligned with construction activity levels observed in 2019. Notably, Houston and Dallas remain pivotal players, contributing to more than half of the state’s construction activity values. Dallas’ market share rose to 27.6 percent, closely trailing Houston’s 27.7 percent share.

Steady and Modest Price Gains Amid Sales Decline

The low supply of homes had supported price gains, and the steady uptick in Texas’ median home prices, including both new and existing homes, moderated from 0.4 percent in the first five months to 0.2 percent in June and July. Three of the Big Four metros reported monthly changes of less than 1 percent, indicating price stability for the state’s housing market. Austin’s median price remained more elevated than all other metros at $454,000 (Table 2). Dallas followed with $398,300.

Amid Austin’s recent price volatility, this metro was still approximately 10 percent below last year’s $507,400 median price. Meanwhile, the state along with the other major metros narrowed the gap to 1 percent, down from 5 percent in June. These changes indicate the real estate industry has nearly reached a full recovery from the price correction observed in the second half of 2022.

Since the dip from July to December 2022, the Texas Repeat Sales Home Price Index (Dec 2004=100) had reverted to the trend. Though the acceleration slowed to 0.7 percent YOY, the index balanced at 229.4, beating June 2022’s record-high reading when the annual increase was at an astonishing rate of 16.5 percent YOY. The elevated index corroborates a rebound in home price appreciation in 2023.

Despite the challenge of high mortgage rates and reduced housing demand, the market share of new construction sales surged. Within a year, the share of new construction sales rose from 16.3 percent to more than 20 percent, indicating every five closed listings is a new home. Both demand and supply factors contributed to the increasing trend for new homes. The shortage of existing homes is due to current owners’ reluctance to give up their current homes, while the state’s consistent home demand, fueled by a growing population, is spurring new construction orders.

Texas’ average days on market (DOM) stayed at 56 for the second straight month, deviating from the steep rebounding trend observed for over a year. The current reading is merely three days short of the five-year average before 2020, which stood at 59 days. The consistent reading suggests that the housing market may have reached a state of equilibrium. Among the major metros, Austin and San Antonio both reported a DOM of 71 days, while Dallas and Houston had DOM figures of 52 days and 49 days, respectively.

Steady and Modest Price Gains Amid Sales Volatility

Texas’ median home prices continued to show its strength by increasing 0.3 percent to $337,900 (Table 2). Austin recorded the largest monthly gain of 4.2 percent, reaching a price peak in the past nine months. The remaining three metros recorded changes of less than 1 percent.

Despite Austin’s price hike in June, this metro was still close to 10 percent below last year’s record high, facing the largest price gap. Meanwhile, Dallas, Houston, and San Antonio had less than 5 percent to bridge. These price drops indicate the real estate industry still has room to recover from the price correction observed in the second half of 2022.

The Texas Repeat Sales Home Price Index, which accounts for compositional price effects and provides a better measure of change in single-family home values, showed a slight advance of 0.3 percent MOM and 0.1 percent YOY. Houston had the highest annual appreciation with 1.6 percent YOY increase, while Austin remained balanced with no YOY changes.

Mortgage rates typically follow Treasury rates, and both increased in June. The ten-year U.S. Treasury Bond yield grew 18 basis points, reaching 3.8 percent. Likewise, the Federal Home Loan Mortgage Corporation’s 30-year fixed-rate increased moderately to 6.7 percent, up 28 basis points. With the Fed resuming their increasing of interest rates in July, both the bond and the mortgage rates also grew.

Source – Joshua Roberson, Weiling Yan, and Koby McMeans (September 7, 2023)

https://www.recenter.tamu.edu/articles/technical-report/Texas-Housing-Insight

Slide1

July 2023 DFW Real Estate Stats

July 2023 brought distinct trends to the real estate markets of Collin, Dallas, Denton, Rockwall, and Tarrant Counties. Collin and Dallas Counties experienced an 18% decrease in new listings, coupled with increased days on the market (63% and 65% respectively).

While average sales prices surged in Dallas County (8%), Collin County witnessed a 5% rise in price per square foot, offset by slight decreases in average sales price and number of sales. Denton County faced a significant 24% decline in new listings, accompanied by a notable 119% increase in days on the market.

Although average sales prices and price per square foot increased (2% and 4% respectively), sales decreased by 7%. Rockwall County encountered reduced new listings (13%) and an extended period on the market (68%). While active listings rose (4%), average sales prices dropped by 11.5% and the number of sales decreased by 14%. Tarrant County saw a 23% decline in new listings and a substantial 113% rise in days on the market. Active listings decreased by 2.6%, average sales prices dipped by 1.3%, and the price per square foot increased by 2.5%, resulting in a significant 12.7% reduction in the number of sales.

Our stats infographics include a year over year comparison and area highlights for single family homes broken down by county. We encourage you to share these infographics and video with your sphere.

For more stats information, pdfs and graphics of our stats including detailed information by county, visit the Resources section on our website at DFW Area Real Estate Statistics | Republic Title of Texas.

For the full report from the Texas A&M Real Estate Research Center, click here. For NTREIS County reports click here.

Texas-Housing-Insight-June-2023

Texas Housing Insight June 2023 Summary

Contrary to investors’ fears, the “housing bubble” did not burst. Instead, a harmonious decline in both supply and demand has struck a balance, resulting in a boost to the housing median price. Throughout the first half of 2023, Texas’ median price has consistently shown a 0.3-0.4 percent growth every month. Due to current owners’ reluctance to sell their existing property, the demand for new construction has significantly increased. This preference shift led to a swift climb in the market share of new construction, which surpassed 20 percent in June. 

Active Listings  Rebound for First Time in Eight Months

The number of active listings rose for the first time since November 2022, reaching 82,064 units after a 3.9 percent month-over-month (MOM) growth. However, none of the Big Four metros recorded a positive monthly gain. The boost of available homes primarily came from the smaller housing markets, such as El Paso, Killeen, Midland, and Texarkana. The number of new listings increased by 6.7 percent to 40,800 units, accounting for half of active listings. All major metros bucked the trend of acceleration with growth ranging from 3.3 percent to 8.9 percentCorrespondingly, months of inventory (MOI) had a marginal gain of 0.1 months.

Regarding the upcoming inventories, Texas’ single-family construction permits had their second decline in three months, dropping by 2 percent in June. While the number of permit applications has significantly shrunk from the frenzy of applications during the pandemic, permit issuance seems to be returning to the ten-year trend before the pandemic.

At the metro level, Houston had the largest demand for permits with 4,500 issuances in June, maintaining the same level as in May. Dallas and Austin both had a mid-single-digit reduction, falling to 3,480 and 1,040 units, respectively. In contrast, San Antonio’s permit demand was rising this year, jumping from 500 units in January to 840 units in June. Permit demand remains significant in the Texas housing market.

Despite the fall in permits, single-family construction starts rose for the third consecutive month to 11,240 units. Both Dallas and Houston had more than 3,500 houses break ground, surpassing the combined total of other metros outside the “Big Four.” While the number of home projects in Austin (1,540 starts) outpaced San Antonio (804 starts), the gap has gradually narrowed as permit demand accelerated in San Antonio. The overall trend indicates a positive momentum in the Texas single-family construction market.

The state’s total single-family starts value reached $15.9 billion year-to-date (YTD), indicating a decline from $23.2 billion recorded in 2022. Houston and Dallas continue to account for more than half of the state’s construction activity values. Dallas’ share of the Texas market rose to 27.5 percent, coming close to Houston’s share of 28 percent. 

Housing Market for New Construction Is Booming

As mortgage rates remain elevated, homebuyer demand has decreased, leading to a drop in Texas’ total home sales, which fell below 28,000 transactions in June (Table 1). This represented a decline of 3.2 percent MOM and 11.8 percent year over year (YOY). Among the four major metros that reported fewer monthly sales, Austin declined the most with a double-digit reduction.


Despite the challenge of high mortgage rates and reduced housing demand, the market share of new construction sales surged. Within a year, the share of new construction sales rose from 16.3 percent to more than 20 percent, indicating every five closed listings is a new home. Both demand and supply factors contributed to the increasing trend for new homes. The shortage of existing homes is due to current owners’ reluctance to give up their current homes, while the state’s consistent home demand, fueled by a growing population, is spurring new construction orders.

Texas’ average days on market (DOM) stayed at 56 for the second straight month, deviating from the steep rebounding trend observed for over a year. The current reading is merely three days short of the five-year average before 2020, which stood at 59 days. The consistent reading suggests that the housing market may have reached a state of equilibrium. Among the major metros, Austin and San Antonio both reported a DOM of 71 days, while Dallas and Houston had DOM figures of 52 days and 49 days, respectively.

Steady and Modest Price Gains Amid Sales Volatility

Texas’ median home prices continued to show its strength by increasing 0.3 percent to $337,900 (Table 2). Austin recorded the largest monthly gain of 4.2 percent, reaching a price peak in the past nine months. The remaining three metros recorded changes of less than 1 percent.

Despite Austin’s price hike in June, this metro was still close to 10 percent below last year’s record high, facing the largest price gap. Meanwhile, Dallas, Houston, and San Antonio had less than 5 percent to bridge. These price drops indicate the real estate industry still has room to recover from the price correction observed in the second half of 2022.

The Texas Repeat Sales Home Price Index, which accounts for compositional price effects and provides a better measure of change in single-family home values, showed a slight advance of 0.3 percent MOM and 0.1 percent YOY. Houston had the highest annual appreciation with 1.6 percent YOY increase, while Austin remained balanced with no YOY changes.

Mortgage rates typically follow Treasury rates, and both increased in June. The ten-year U.S. Treasury Bond yield grew 18 basis points, reaching 3.8 percent. Likewise, the Federal Home Loan Mortgage Corporation’s 30-year fixed-rate increased moderately to 6.7 percent, up 28 basis points. With the Fed resuming their increasing of interest rates in July, both the bond and the mortgage rates also grew.

____________________
* All measurements are calculated using seasonally adjusted data, and percentage changes are calculated month over month, unless stated otherwise.

Source – Joshua Roberson, Weiling Yan, and Koby McMeans (August 15, 2023)

https://www.recenter.tamu.edu/articles/technical-report/Texas-Housing-Insight

Slide1

June 2023 DFW Area Real Estate Stats

The Dallas real estate market has seen fluctuations in different counties, as of the latest available data. In Collin County, new listings have declined by 21.5%, with closed sales down by 3.7%, and the median sales price experiencing a 5.1% decrease. Similarly, Dallas County has witnessed a decline of 19.3% in new listings, a significant drop of 12.1% in closed sales, and a minor decrease of 0.8% in the median sales price.

Denton County, on the other hand, has experienced a decrease of 19.7% in new listings, while closed sales have surprisingly increased by 1.2%. However, the median sales price in Denton County has still seen a downturn of 1.2%. Tarrant County has seen the steepest decline in new listings at 22.6%, coupled with a significant drop of 10.2% in closed sales and a median sales price decrease of 4.3%. Lastly, Rockwall County has experienced a substantial decline of 25.2% in new listings, a notable drop of 19.5% in closed sales, and a 2.2% decrease in the median sales price.

Overall, these statistics indicate varying trends in the Dallas real estate market, with some counties witnessing significant declines in both new listings and closed sales, while others show mixed results. The changes in median sales prices are also noteworthy, showcasing the complexities and challenges the local real estate market is currently facing. As the market continues to evolve, it will be essential for potential buyers and sellers to stay informed with the most up-to-date data and trends from Realtor professionals to make informed decisions in this dynamic environment.

Our stats infographics include a year over year comparison and area highlights for single family homes broken down by county. We encourage you to share these infographics and video with your sphere.

For more stats information, pdfs and graphics of our stats including detailed information by county, visit the Resources section on our website at DFW Area Real Estate Statistics | Republic Title of Texas.

For the full report from the Texas A&M Real Estate Research Center, click here. For NTREIS County reports click here.

Texas-Housing-Insight-May-2023

Texas Housing Insight May 2023 Summary

Texas had an uptick in home sales in May. At the same time the level of active listings continued to drop, resulting in shorter market times to sell and price growth. The market time shrunk for the first time since March 2022, now standing at 56 days. The median price has steadily increased by 0.4 percent each month this year but is still $15,000 short of the record high level from a year ago.

Supply* Recedes after the Two-Year Boom

Single-family construction permits moderately declined less than one percent from the previous month to 12,305 units. Dallas and Houston both showed massive changes with Dallas declining by 13.3 percent to 3,159 permits, while Houston surpassed its 2022 building permits by 5.8 percent to 4,546 permits. The issuance difference ballooned quickly from 136 permits in April to more than 1,300 permits in May. Austin and San Antonio moderately changed with Austin rising by 4.3 percent to 1,068 units, while San Antonio decreased by 8.8 percent to 684 units. The split between the four major metros was the cause for Texas’ moderate decrease in May.

Single-family construction starts rose for the second month to 10,725 units in May. Despite the recent rebound, the number of construction starts shrank more than 20 percent compared with a year ago. Dallas recorded the only increase this month in the Texas Triangle with a 6.2 percent increase to 7,258 units. Construction generally hits a seasonal low in winter and peaks in spring or summer.

The state’s total single-family starts value reached $12.8 billion in May, a decline from $19.7 billion recorded in 2022. Investment value contracted in all four major metros, with Houston suffering the largest loss. The energy hub had a substantial 39.1 percent decrease in single-family starts value from January to May compared with the previous year. This was equivalent to a net loss of $2.3 billion worth of real estate investment. While the housing market underwent a cooldown, the rental market displayed Texans’ consistent need for extra space. Multifamily starts value inched up by 3.1 percent year-to-date (YTD), and Dallas and Houston—the two most populated metros—contributed mostly to the growth.

The number of active listings continued its downward trajectory, reaching 79,278 units, representing a decrease of just over 1 percent from the previous month. The big four metros recorded the largest drops in listings while the rest of Texas counteracted their decrease that kept the statewide change at only a slight decrease from April 2023. The number of new listings increased just over 2 percent to 37,812 units, with Houston accounting for the only increase. Months of Inventory (MOI) dipped to 2.6 months. This trend is in large part due to Dallas and Houston’s MOI decreasing by 8 percent and 19 percent, respectively.

Housing Market Sees Shortened Sale Time for First Time in 14 Months

Total home sales recovered half of the losses from April’s month-over-month (MOM) slump and expanded to 28,933 transactions, equivalent to a 5.3 percent MOM increase (Table 1). All four metropolitan areas experienced significant growth in sales volume. Austin showed the highest monthly elevation with a double-digit growth rate, catching up to San Antonio’s sales level with over 2,900 transactions. Houston had the second most impressive rate at 8.2 percent, bridging the gap between Dallas’ single-family transactions.

Sales in Houston rose across all price cohorts in May, with the most significant rises in the two tails—below $200,000 and above $750,000—both of which rose over 20 percent. However, compared with May 2022, sales for all price cohorts decreased, especially for homes priced over $300,000.

Texas’ average days on market (DOM) retreated for the first time since March 2022, falling three days to 56, straying away from the historical norms rate that it was approaching. Compared with the five-year average of 59 days before 2020, the lack of available homes in the market is becoming more competitive for buyers as three out of the four major metros recorded a decrease in DOM. Dallas recorded the biggest drop to 51 DOM, over a 7 percent decrease from the previous month. Houston and San Antonio were the only two MSAs that did not record a downtick, as the readings balanced at 52 and 68 days, respectively.

Prices Make Steady, Small Gains Despite Volatility in Sales

Texas’ median home prices exhibited strength with consistent increases throughout the year. The price rose steadily by 0.4 percent every month since the beginning of 2023, progressing from $331,900 in January to $337,700 in May (Table 2).  Despite marginal downticks in Austin, Dallas, and San Antonio, growth in Houston along with the rest of the state maintained the state’s overall price growth.

Texas, as well as all four major metropolitan areas, experienced lower in median home prices compared with the previous year. Austin saw decreases of 15.3 percent, while Dallas, San Antonio, and Houston saw decreases of 5.9 percent, 4.4 percent, and 3 percent, respectively. These price drops indicate the real estate industry is still in the process of recovering from the price correction observed in the second half of 2022.

Because of the price correction, housing appreciation slowed. The Texas Repeat Sales Home Price Index accounts for compositional price effects and provides a better measure of change in single-family home values. The Texas index was mostly the same, gaining 0.1 percent year over year (YOY). The only metro with annual appreciation was Houston, which recorded a 1.5 percent YOY increase. Similar to the state’s median price trend, the four metros all recorded steady growth for the past five consecutive months.

Mortgage rates typically follow Treasury rates. The ten-year U.S. Treasury Bond yield grew 11 basis points MOM to reach 3.6 percent. Likewise, the Federal Home Loan Mortgage Corporation’s 30-year fixed-rate increased moderately to 6.43 percent, up nine basis points from April.

____________________
* All measurements are calculated using seasonally adjusted data, and percentage changes are calculated month over month, unless stated otherwise.

Source – Joshua Roberson, Weiling Yan, and Koby McMeans (July 11, 2023)

https://www.recenter.tamu.edu/articles/technical-report/Texas-Housing-Insight

Slide1

May 2023 DFW Area Real Estate Stats

Days on market have surged over 100% in each county we report on indicating that homes are selling far more slowly than they were in 2022. In Rockwall County, the average days on market is 62 days – that’s an increase of 226.3% over 2022. According to the Dallas Business Journal, Dallas-Fort Worth ranked fourth in the U.S. for the largest increase in days on market in May.  New listings are down across the board over 2022.  The demand for homes in North Texas is still robust and it remains a tough market for buyers. If you’re considering selling or know someone who is, now is the perfect moment to take advantage of the high demand!

Our stats infographics include a year over year comparison and area highlights for single family homes broken down by county. We encourage you to share these infographics and video with your sphere.

For more stats information, pdfs and graphics of our stats including detailed information by county, visit the Resources section on our website at DFW Area Real Estate Statistics | Republic Title of Texas.

For the full report from the Texas A&M Real Estate Research Center, click here. For NTREIS County reports click here.