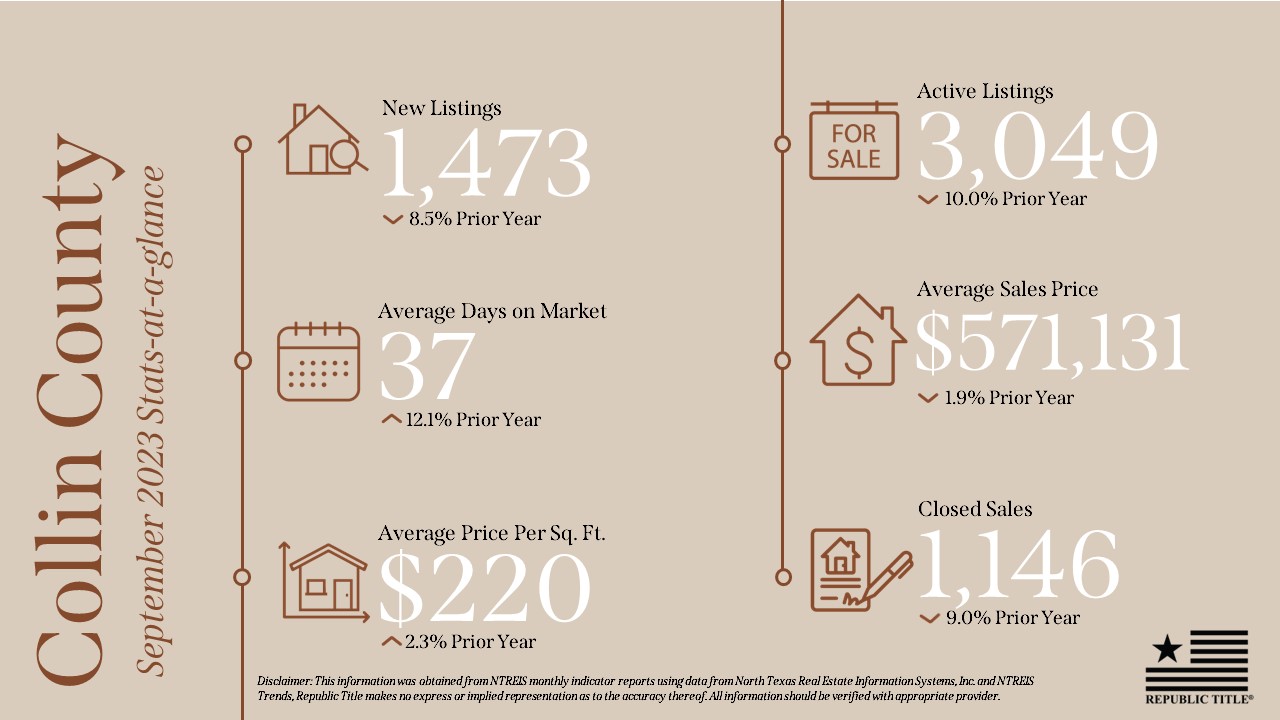
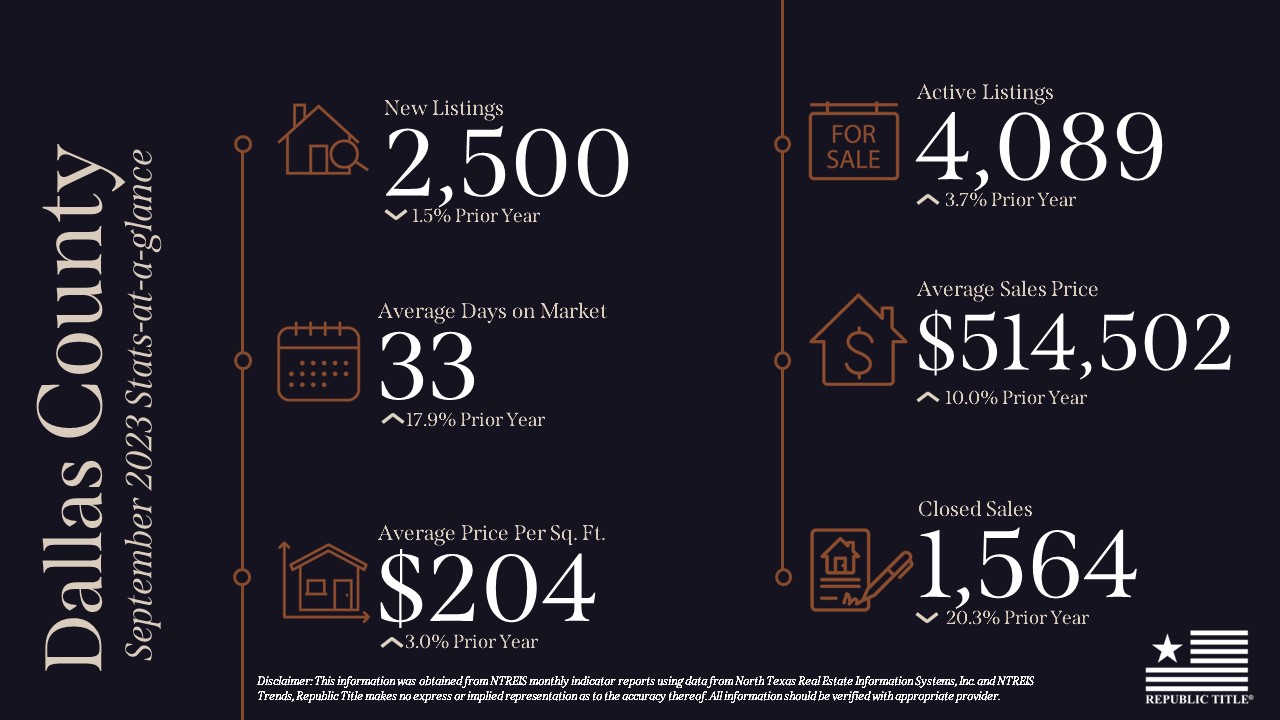
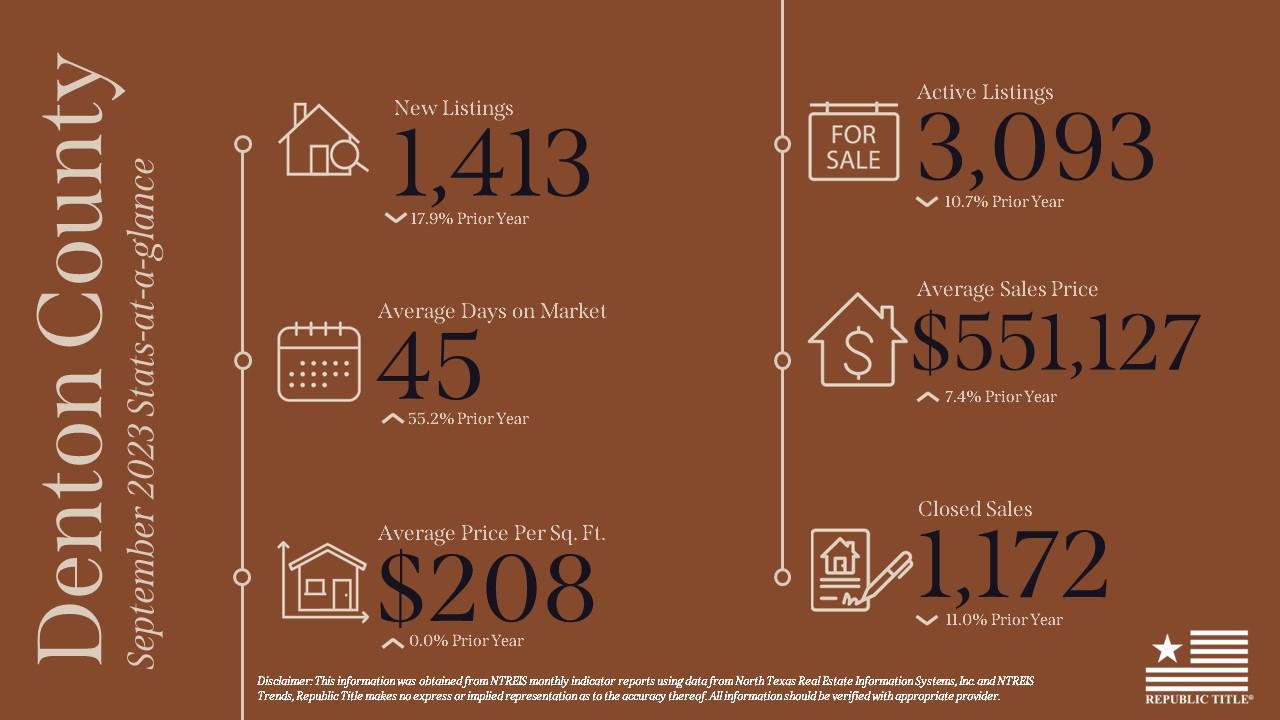
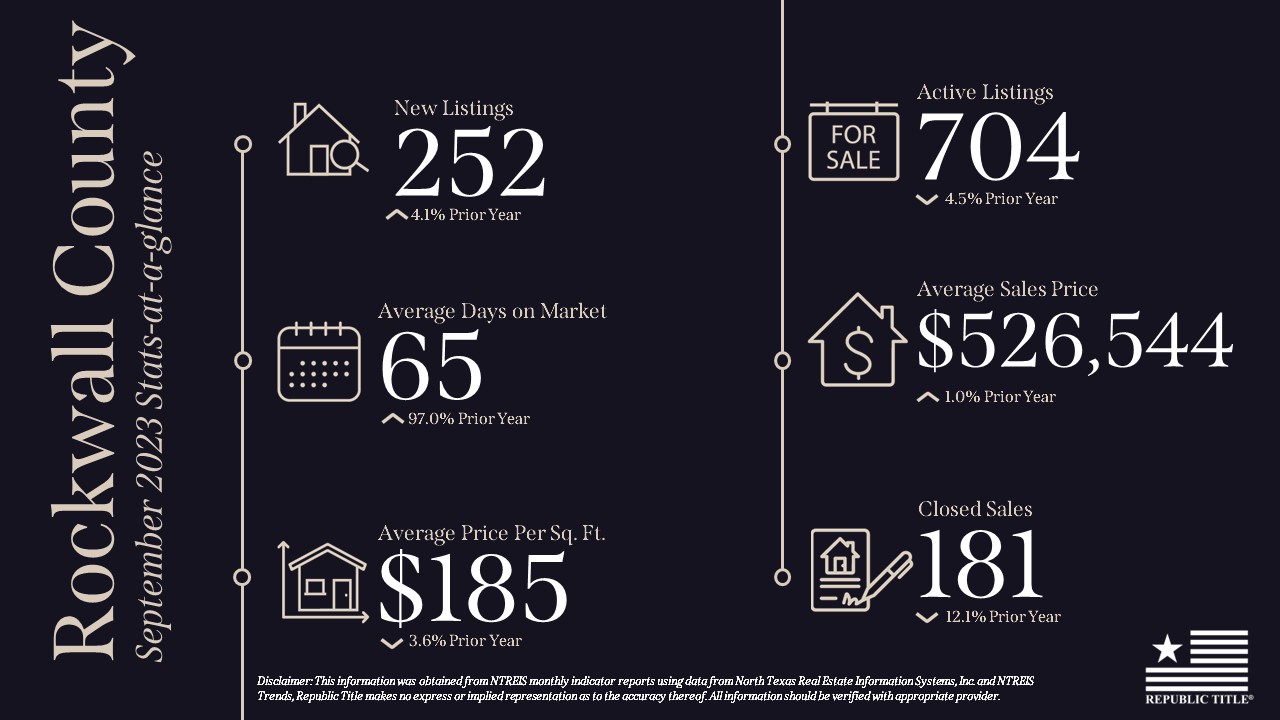
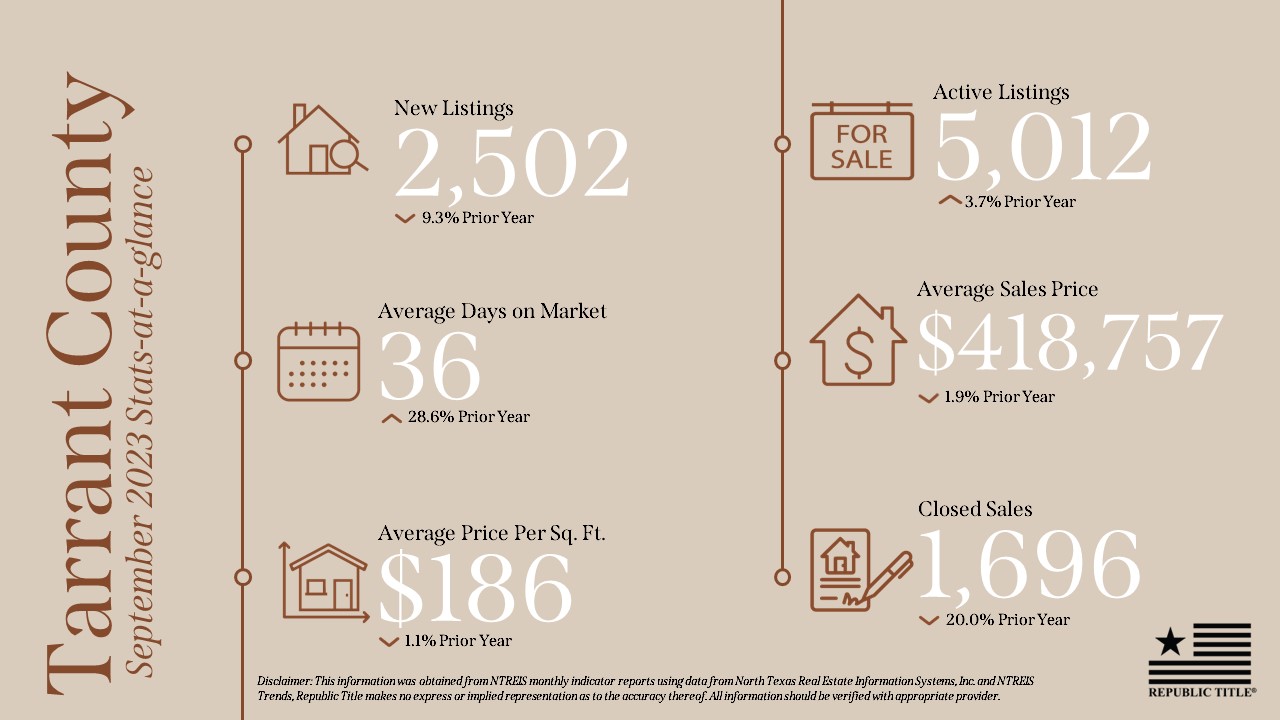
In September 2023, active listings varied across counties. Collin County witnessed a 10% decline, Denton County experienced a 10% decrease, while Dallas County and Tarrant County saw increases of almost 4% and 3.7% respectively. Rockwall County noted a 4.5% reduction in active listings.
Regarding closed price per square foot, Collin County saw an increase of 2.3%, Dallas County experienced a 3% rise, Denton County remained flat, and Rockwall County and Tarrant County witnessed decreases of 3.6% and 1.1% respectively. Average days on Market are still up across the board over 2022 with Rockwall County having the largest increase of 97% increase.
In this ever-evolving real estate landscape, understanding local market trends is essential. Whether you’re buying, selling, or investing, our team is here to provide expert guidance tailored to your needs.
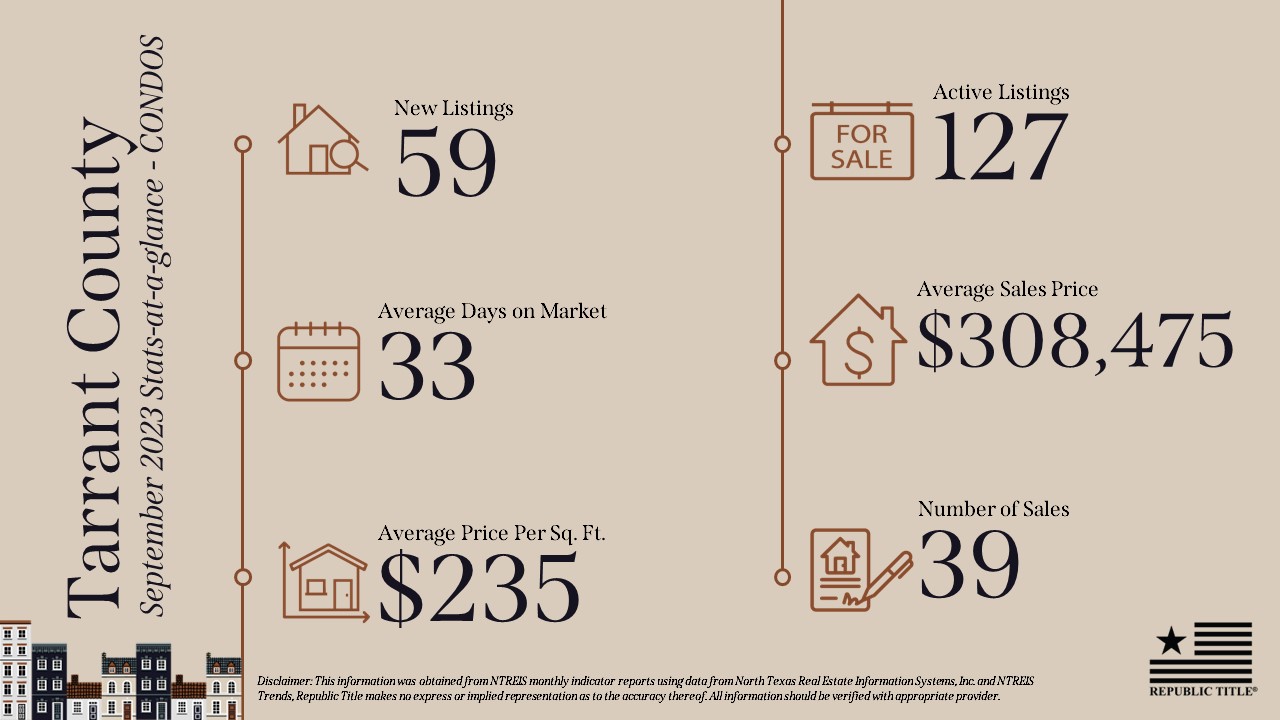
Our stats infographics include a year over year comparison and area highlights for single family homes broken down by county. We encourage you to share these infographics and video with your sphere.