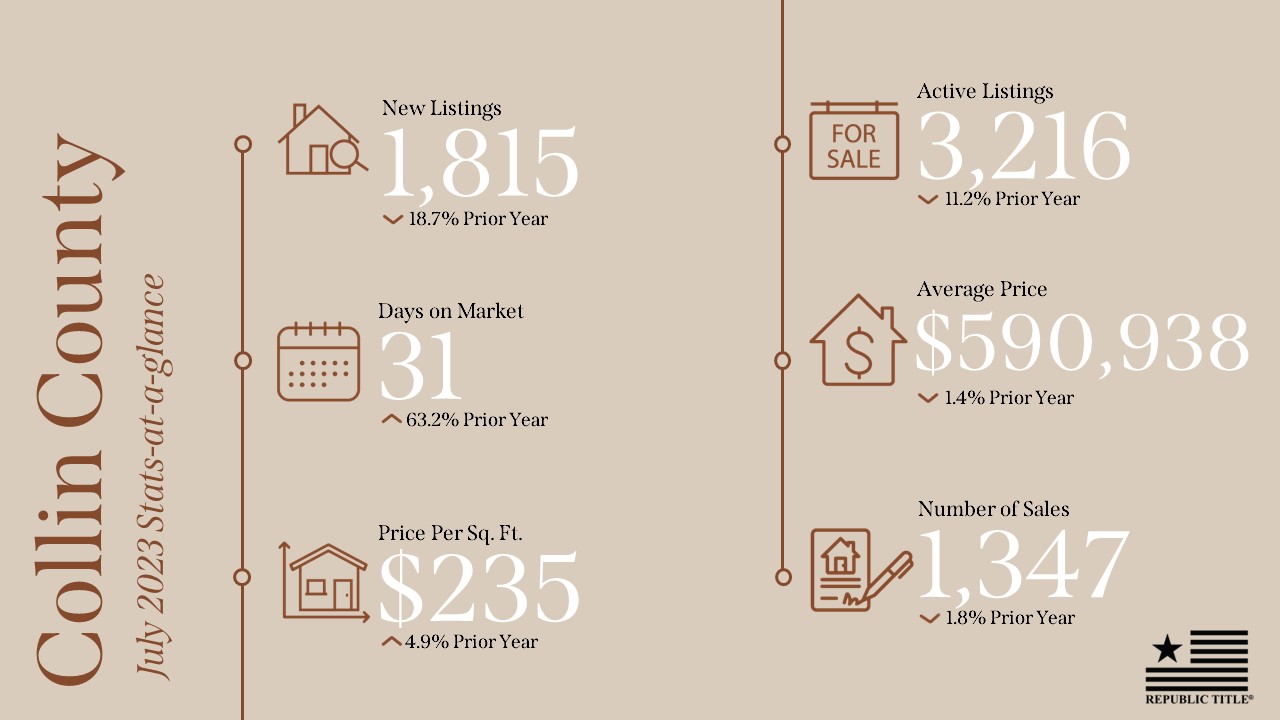
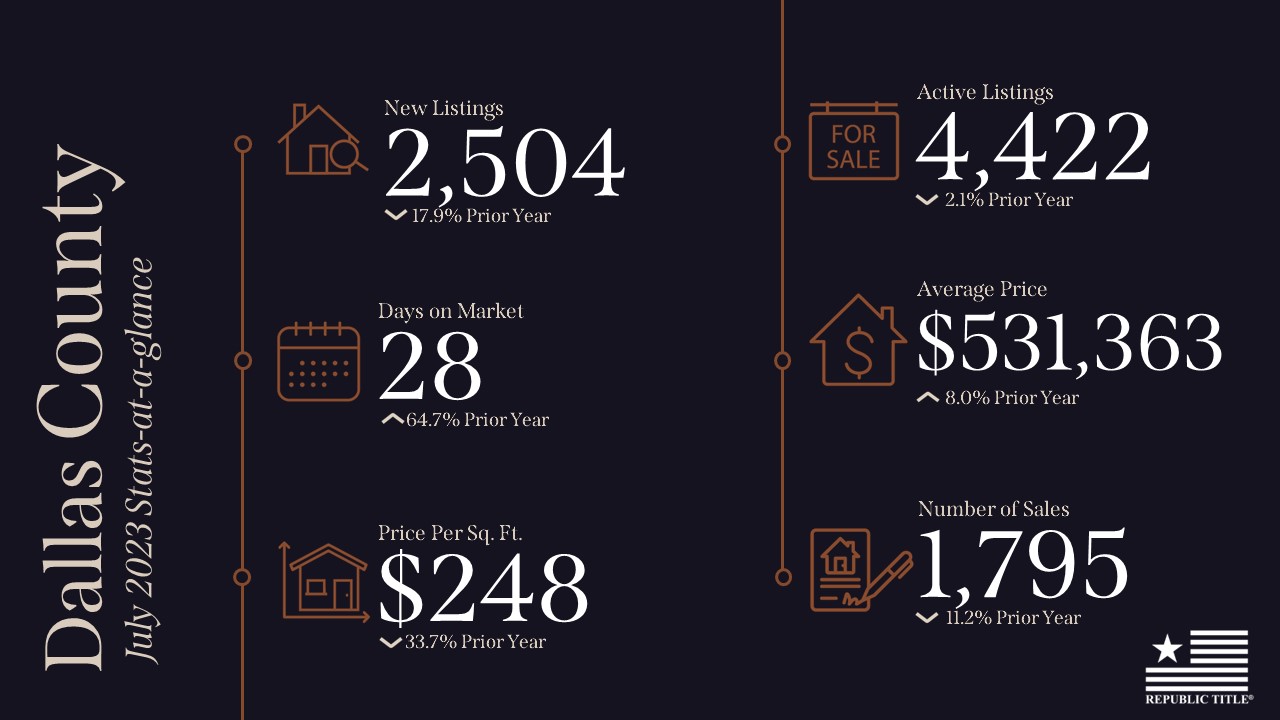
July 2023 brought distinct trends to the real estate markets of Collin, Dallas, Denton, Rockwall, and Tarrant Counties. Collin and Dallas Counties experienced an 18% decrease in new listings, coupled with increased days on the market (63% and 65% respectively).
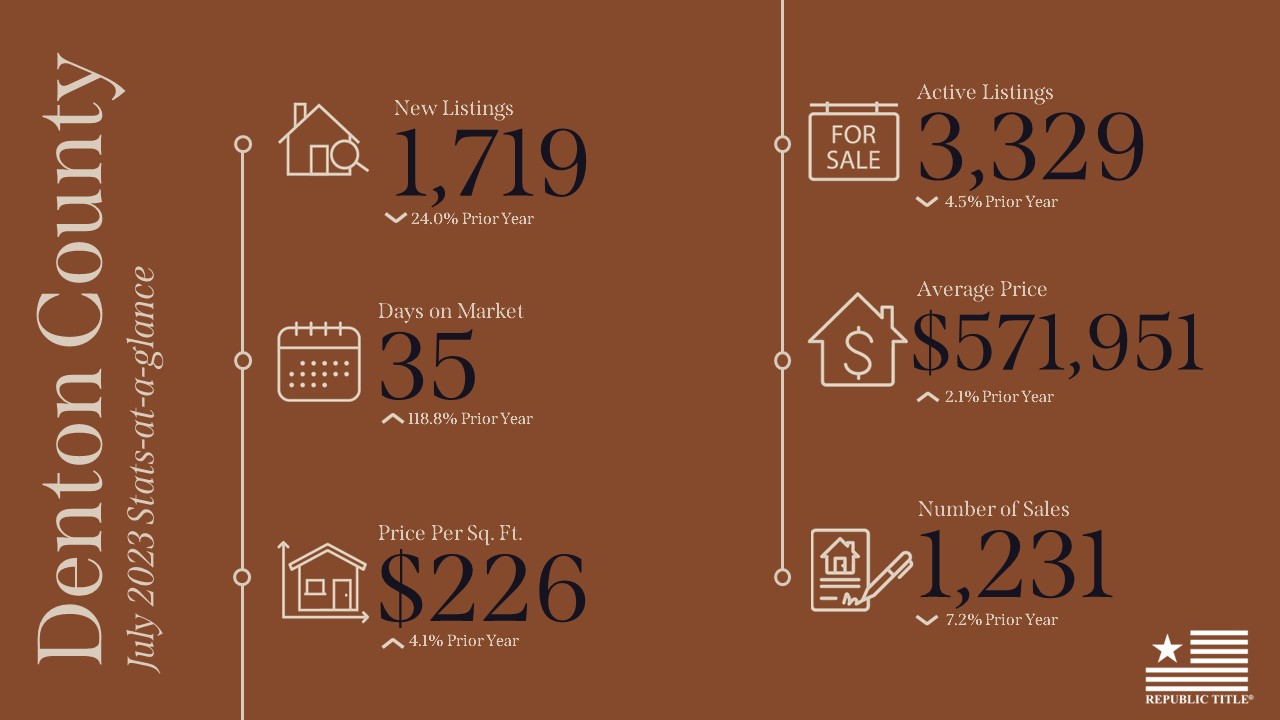
While average sales prices surged in Dallas County (8%), Collin County witnessed a 5% rise in price per square foot, offset by slight decreases in average sales price and number of sales. Denton County faced a significant 24% decline in new listings, accompanied by a notable 119% increase in days on the market.
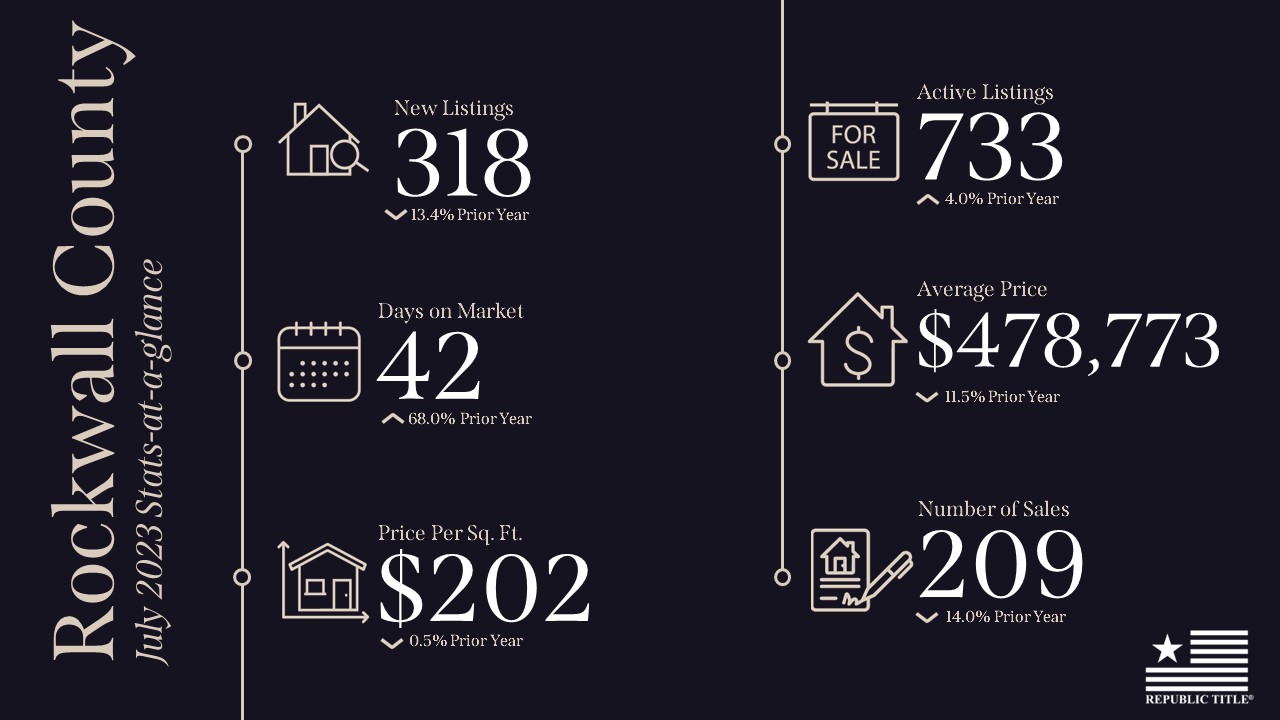
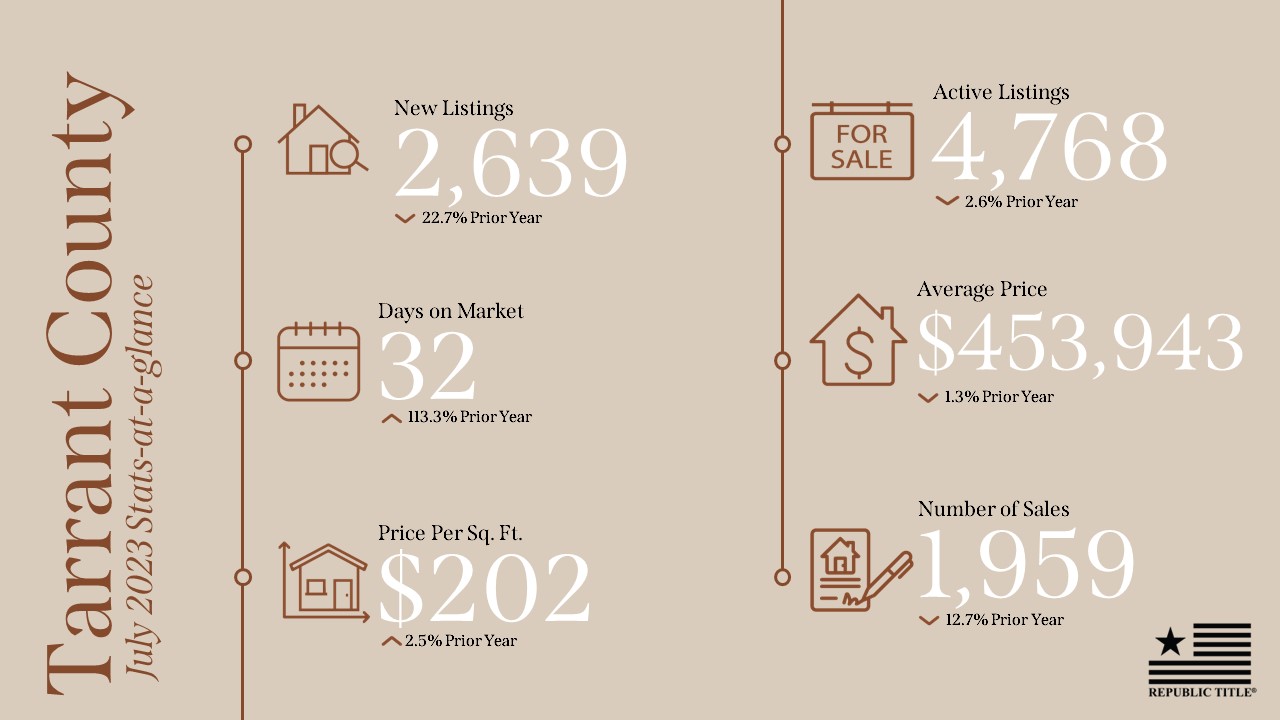
Although average sales prices and price per square foot increased (2% and 4% respectively), sales decreased by 7%. Rockwall County encountered reduced new listings (13%) and an extended period on the market (68%). While active listings rose (4%), average sales prices dropped by 11.5% and the number of sales decreased by 14%. Tarrant County saw a 23% decline in new listings and a substantial 113% rise in days on the market. Active listings decreased by 2.6%, average sales prices dipped by 1.3%, and the price per square foot increased by 2.5%, resulting in a significant 12.7% reduction in the number of sales.
Our stats infographics include a year over year comparison and area highlights for single family homes broken down by county. We encourage you to share these infographics and video with your sphere.