Texas housing sales slowed in October but trended upward amid continued supply constraints. Along with higher mortgage interest rates, double-digit home-price appreciation chipped away at housing affordability. Elevated demand persisted as homes averaged roughly one month on the market. On the supply side, single-family housing permits increased for the second consecutive month, but housing starts declined as lumber and other input material prices rose. The relatively low level of inventory available for sale is the greatest challenge to Texas’ housing market. The state’s diverse and expanding economy, favorable business policies, and steady population growth, however, support a favorable outlook.
Supply1
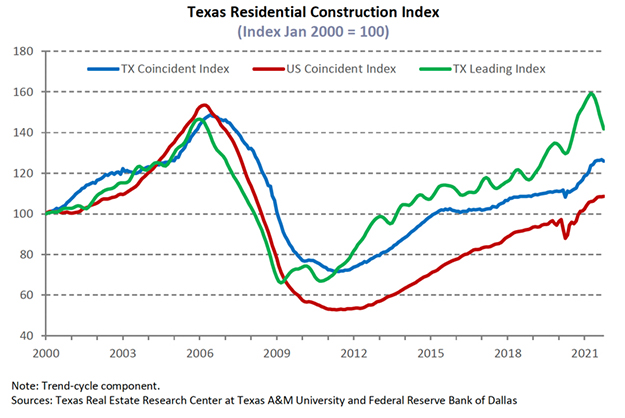
The Texas Residential Construction Cycle (Coincident) Index, which measures current construction activity, flattened nationally and within Texas due to decreased construction values despite employment and wage gains during October. The Texas Residential Construction Leading Index ticked down as weighted building permits decreased, signaling a potential slowdown in future activity. Among the major metros, weighted building permits and residential starts increased, except in Dallas-Fort Worth (DFW), where there was a decrease in both metrics. Inflationary pressures, however, tempered economic expectations and may slow construction activity in coming months.
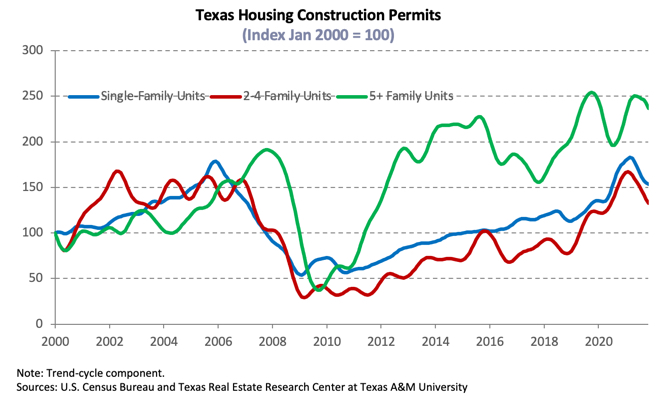
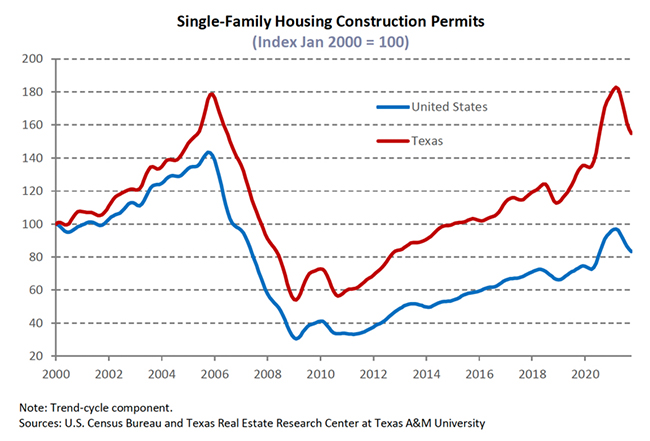
Single-family construction permits accelerated 4.5 percent in October, increasing for a second straight month. Houston topped the national list for seven consecutive months with 3,887 nonseasonally adjusted permits after registering a healthy seasonally adjusted increase. DFW ranked second on the national list and posted a double-digit monthly expansion to 3,523 permits. Meanwhile, Austin and San Antonio issued 1,480 and 872 permits, respectively. On the other hand, Texas’ multifamily sector registered incremental growth as issuance shifted from two-to-four units to five-or-more units. The metric ticked up just 0.7 percent on a monthly basis but elevated 12.3 percent year to date (YTD) relative to the same period last year.
Despite strengthening economic conditions and ample housing demand, total Texas housing starts declined as lumber prices increased 17.9 percent in October. Single-family private construction values, however, increased slightly in real terms, but the metric continued to trend downward in Texas’ major metros. The majority of the statewide growth was attributed to the elevation in Austin and DFW values.
Texas’ months of inventory (MOI) normalized at 1.6 months as sales activity and new listings slowed. A total MOI around six months is considered a balanced housing market. Supply remained relatively constant across all price cohorts except in the upper and lower extremes. For example, inventory tightened for homes priced less than $300,000 and for luxury homes (those priced more than $500,000), diminishing to 1.2 and 2.5 months, respectively.
Inventory in the major metros decreased slightly in October, except in Houston, where MOI flattened at 1.7 months. Supply remained the most constrained in Austin at 0.9 months, while San Antonio’s MOI lowered to 1.7 months. North Texas’ metric declined at the largest rate, falling to 1.1 and 1.2 months in Dallas and Fort Worth, respectively. Depleted inventory remains a major headwind to the health of Texas’ housing market.
Demand
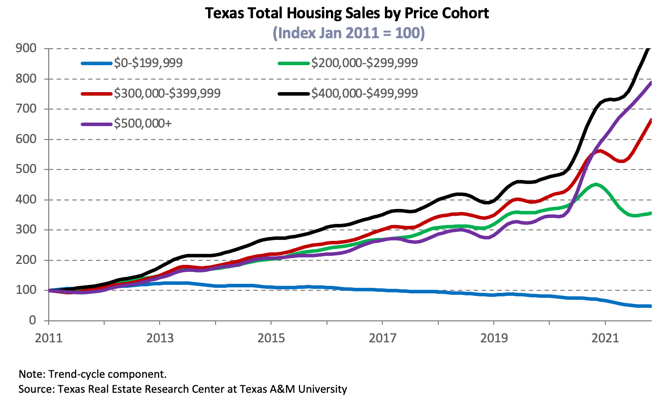
Total housing sales flattened in October, dipping 0.3 percent amid rising mortgage interest rates and dwindling inventory. The slowdown was attributed to historically low activity for homes priced less than $200,000. On the other hand, the number of homes sold priced between $400,000 and $499,999 reached an all-time high. Reduced transactions at the lower end of the price spectrum slightly outweighed the uptick in the higher price ranges.
Housing sales decreased in all metro areas except for in Dallas. San Antonio reflected statewide fluctuations across the price spectrum as total sales declined 1.5 percent. In Houston, the metric dropped 0.9 percent, while activity in Austin contracted 3.2 percent. Sales in North Texas slowed overall, decreasing 3.4 percent in Fort Worth. However, transactions in Dallas increased 1.9 percent due to strong gains for homes priced between $200,000 and $299,999.
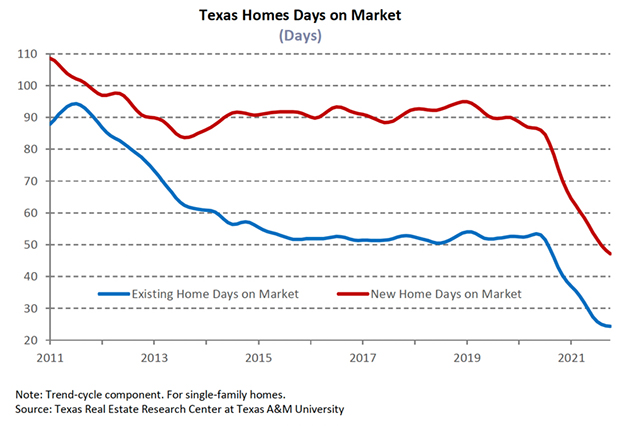
Texas’ average days on market (DOM) rose marginally to 32 days, confirming robust demand and attributing sales decrease to limited inventory. Austin’s DOM improved by one day, averaging 19 days, while North Texas’ metric also increased, selling after an average of 23 days in Fort Worth and 27 days in Dallas. San Antonio’s and Houston’s metrics registered narrow gains, matching the statewide average of 32 days in both metros.
With monetary policy possibly normalizing, starting with the Federal Reserve Bank’s tapering of bond purchases, economic growth forecasts for the coming years point to a slow return to the long-run structural trend as the initial and strongest stage of recovery likely reached its peak. It’s becoming clearer that inflation pressures will be permanent. The ten-year U.S. Treasury bond yield ticked up for the second consecutive month to 1.6 percent2, while the Federal Home Loan Mortgage Corporation’s 30-year fixed-rate elevated to 3.1 percent. The median mortgage rate for the typical Texas homebuyer remained constant at 3.1 percent for GSE loans in September3 and ticked down ten basis points to 2.9 percent for non-GSE loans. Although mortgage interest rates rose over the past two months, Texas home-purchase applications increased in October but fell 6.5 percent YTD. Meanwhile, refinance applications declined on a monthly basis and were down 24.6 percent since December 2020. Year-over-year (YOY) purchase and refinance applications diminished 9.8 and 10 percent, respectively, largely due to baseline effects after a surge of remodeling and refinancing in 2020. Increasing rates, lenders adding more requisites, and the shrinking pool of households able to refinance are likely impacting refinance activity as well. (For more information, see “Finding a Representative Interest Rate for the Typical Texas Mortgagee“.
In September, the median loan-to-value ratio (LTV) constituting the “typical“ Texas conventional-loan mortgage dropped from 87.8 a year earlier to 84.5. The debt-to-income ratio (DTI) elevated from 35.4 to 36.4, while the median credit score increased ten points to 749 over the same period. The LTV GSE borrowers decreased from 85.4 last September to 85.9; however, DTI grew from 35.4 to 36.4. Overall improved credit profiles reflected the fact that only the most qualified housing applicants were able to outbid their competition for their desired homes amid exceptionally tight inventories and robust demand.
Prices
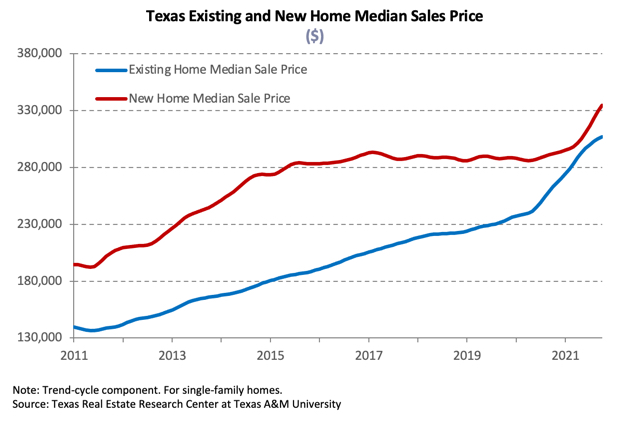
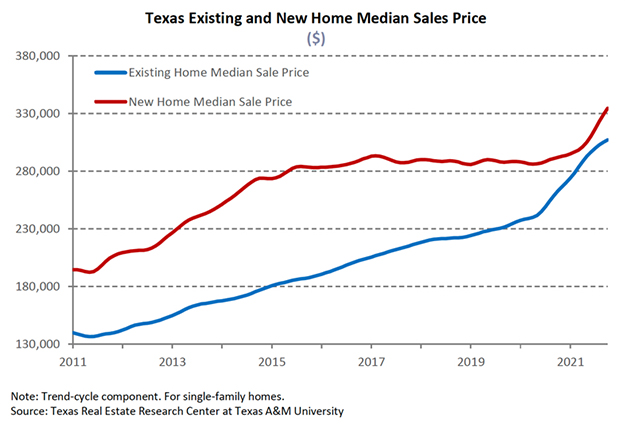
Average home prices were boosted by the ongoing shift in the composition of sales toward higher-priced homes due to constrained inventories at the lower end of the market. The Texas median home price rose for the tenth consecutive month, appreciating 1.4 percent on a monthly basis and 15.5 percent YOY to a record-breaking $312,700 in October. The share of luxury homes sold in Austin continued to expand, contributing to the 24.4 percent YOY surge in the median price ($453,600). The Dallas metric ($383,100) increased 17.6 percent, while annual price growth in Fort Worth ($319,600) shot up to 18.2 percent. Houston’s ($309,100) and San Antonio’s ($303,000) metrics elevated 15.1 and 18.4 percent, respectively.
The Texas Repeat Sales Home Price Index accounts for compositional price effects and provides a better measure of changes in single-family home values. Texas’ index corroborated significant home-price appreciation, accelerating 18.6 percent YOY. The repeat sales index also accelerated in the major metros, except in Austin and Houston, as annual price growth reached recent peaks. The metric dipped to 35.1 percent in Austin, followed by Dallas and Fort Worth with 24.1 and 22 percent home-price appreciation, respectively. San Antonio posted an 18.4 percent annual hike, while Houston’s index decelerated to 14.6 percent. Increasing home prices pressured housing affordability, particularly in an environment of low real wage growth.
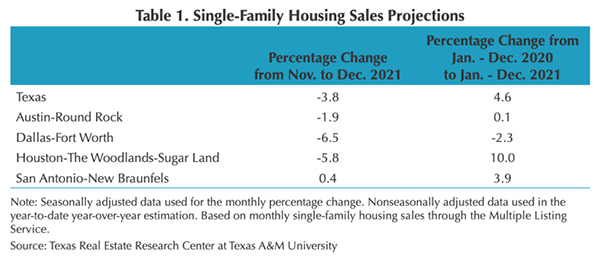
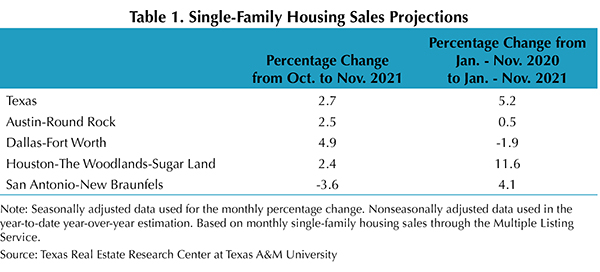
Single-Family Forecast
The Texas Real Estate Research Center projected single-family housing sales using monthly pending listings from the preceding period (Table 1). Only one month in advance was projected due to uncertainty surrounding the COVID-19 pandemic and the availability of reliable and timely data. Texas sales are expected to recover 2.7 percent in November after October’s decline. The metric is estimated to rebound 2.5 and 2.4 percent in Austin and Houston, respectively, with additional increases of 4.9 percent in DFW. Transactions in San Antonio, however, are forecasted to slow further to -3.6 percent. Sales through November 2021 should accelerate relative to the same period in 2020. On the supply side, inventories reached a trough in May 2021 and should improve in the coming months. Listings seemed to reach a trough in May and are rising, easing some of the price pressures amid a rise in new and pending listings. (For more information, see 2021 Mid-Year Texas Housing & Economic Outlook).