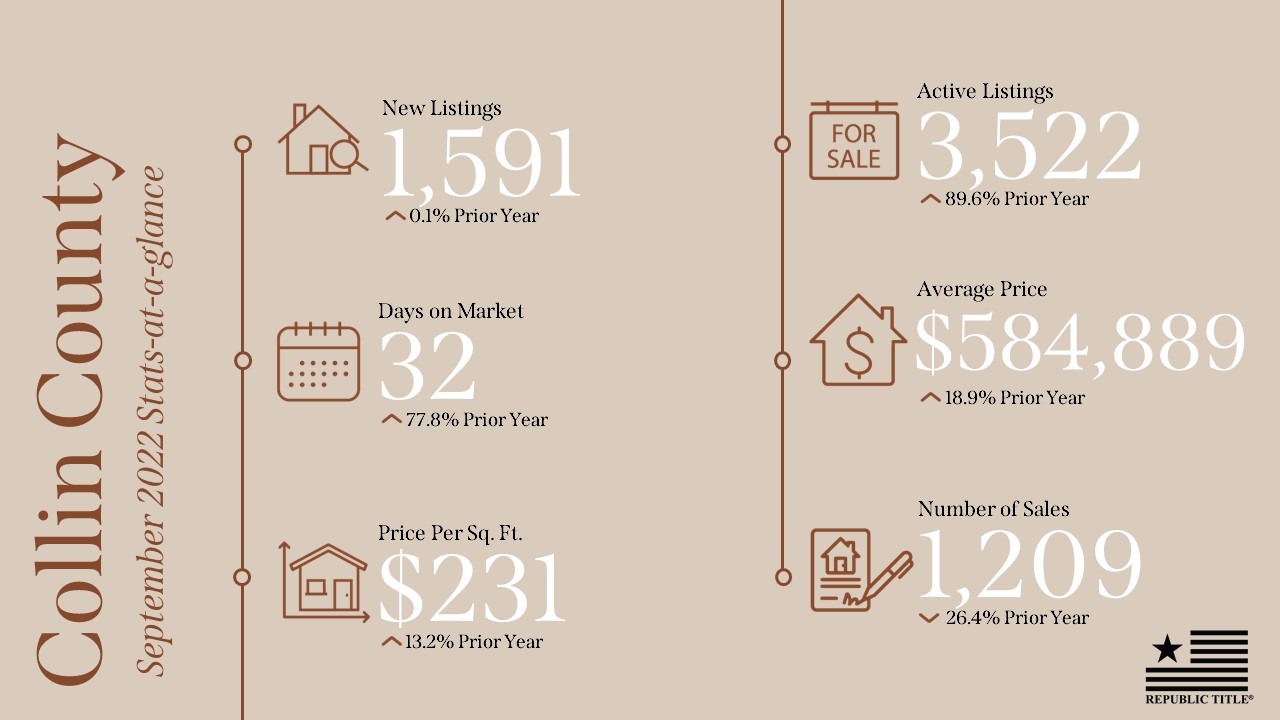
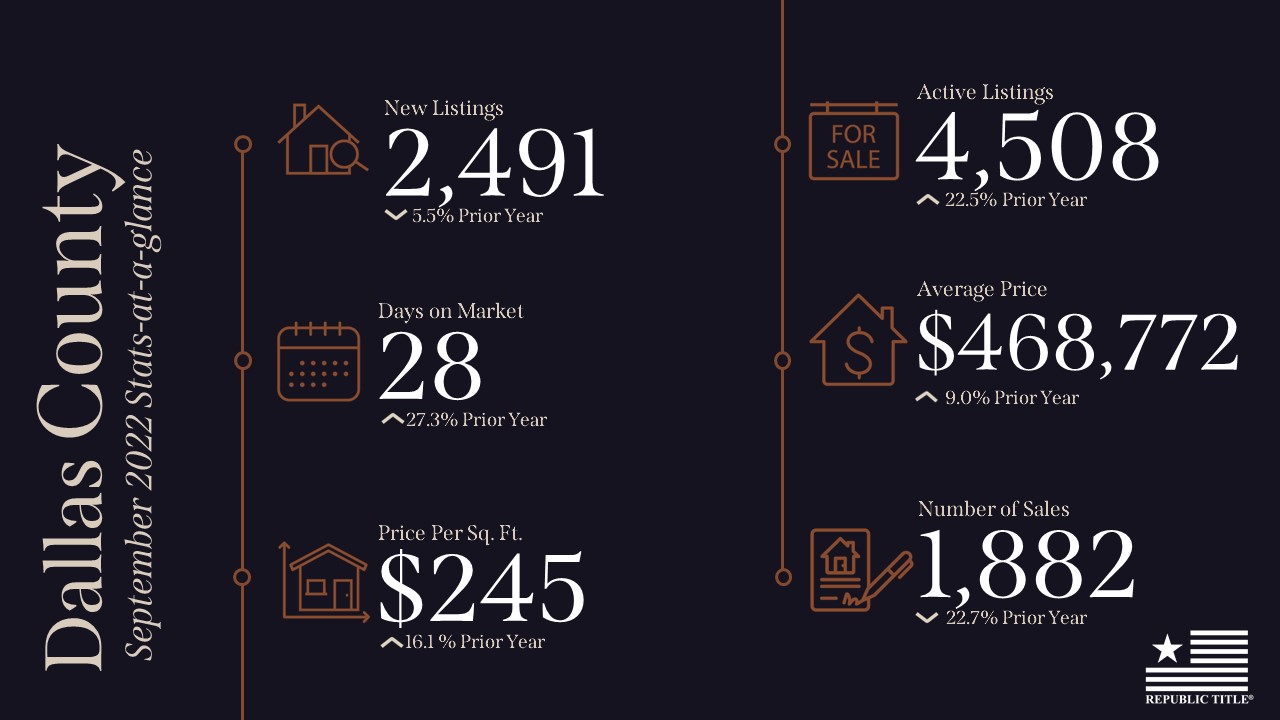
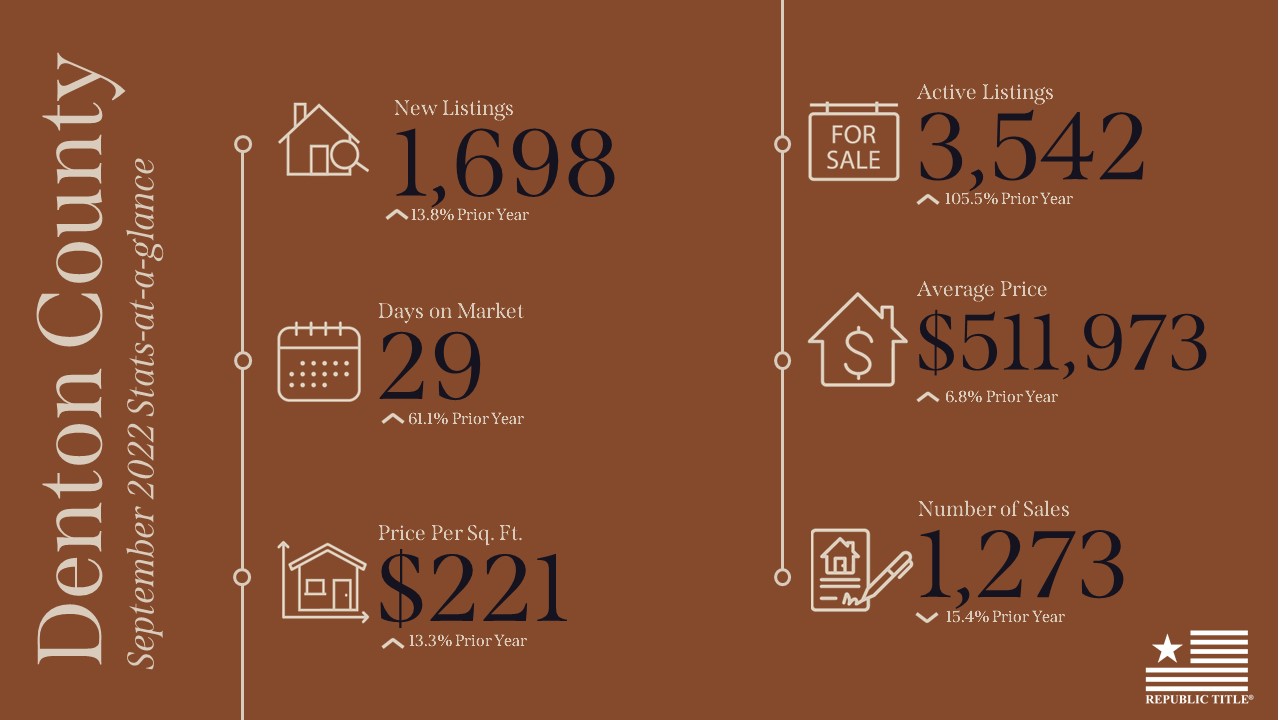
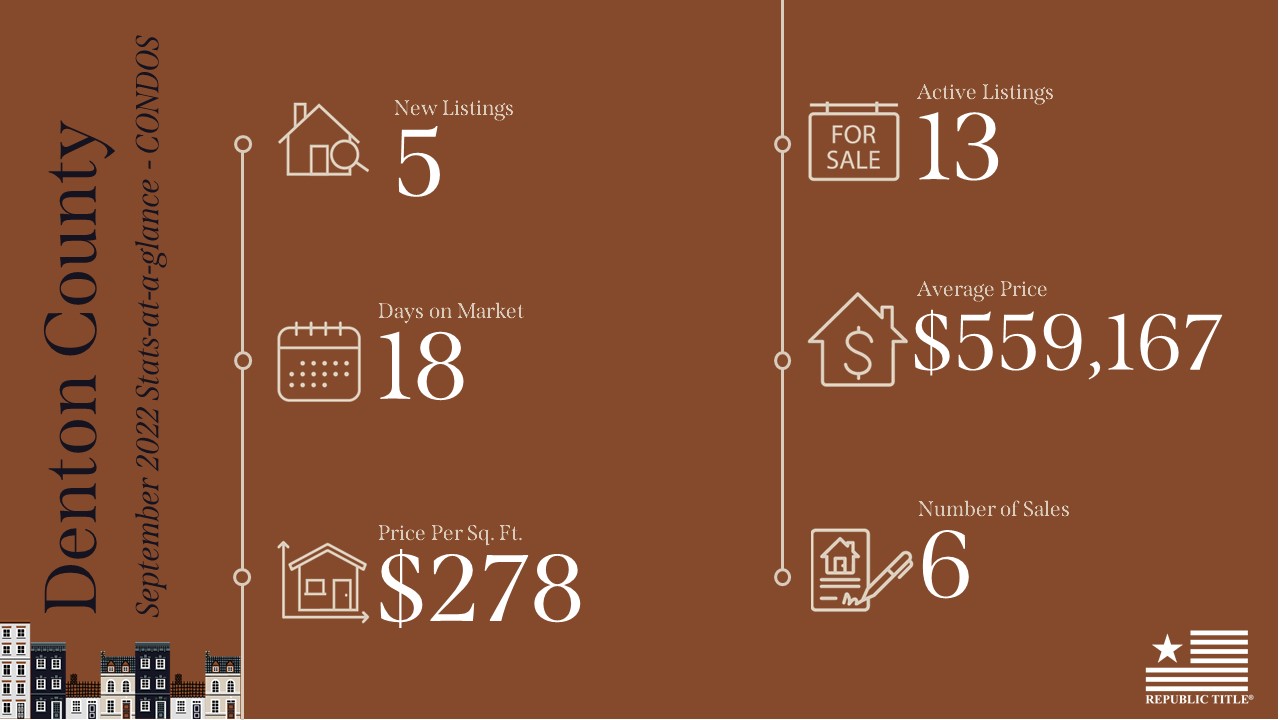
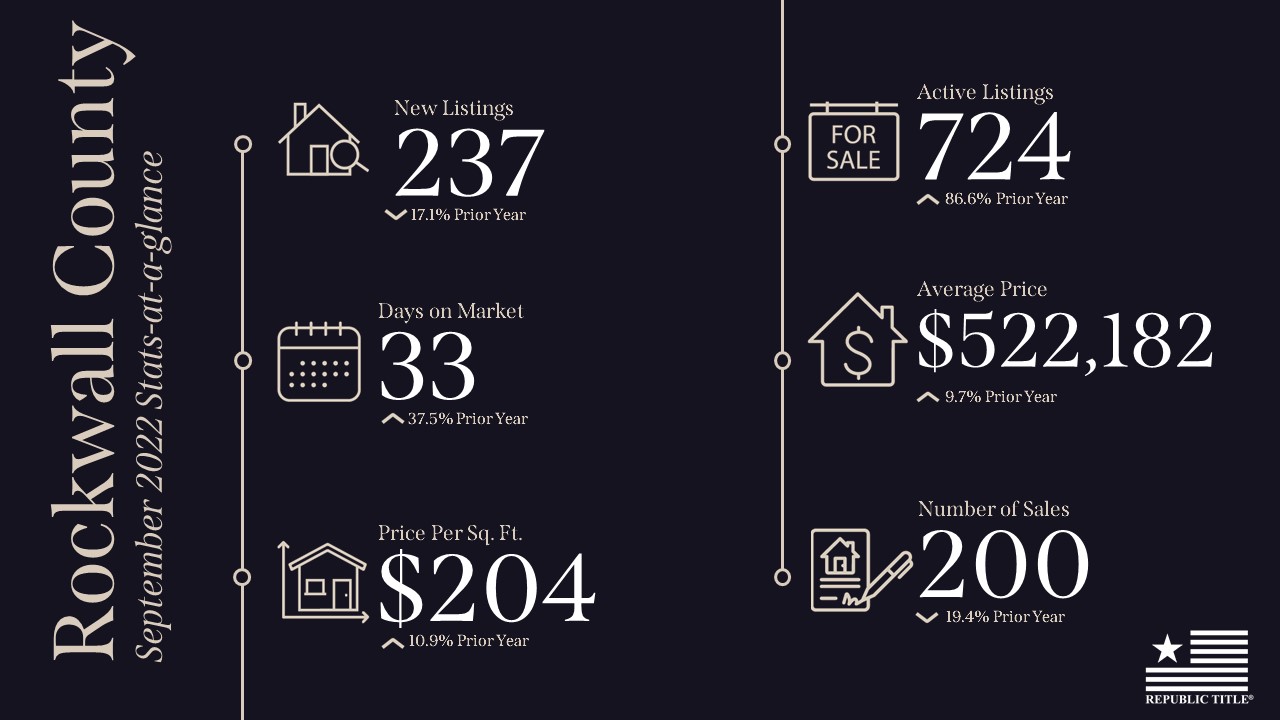
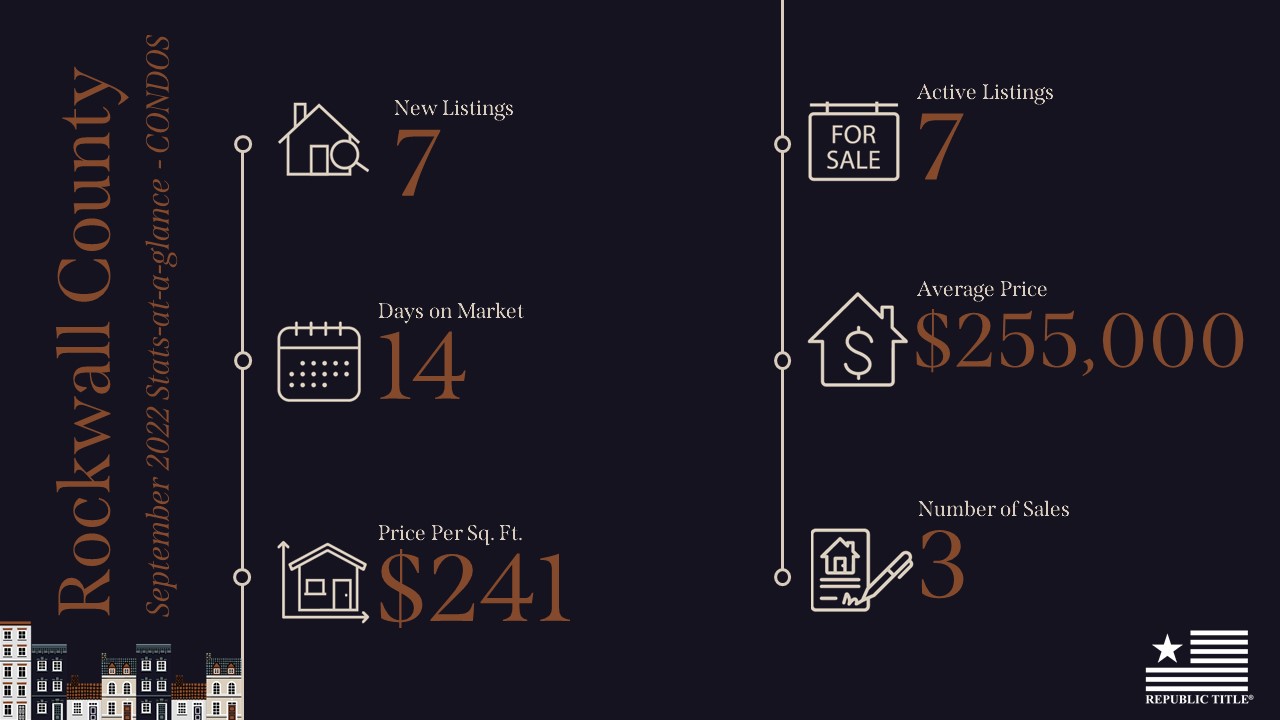
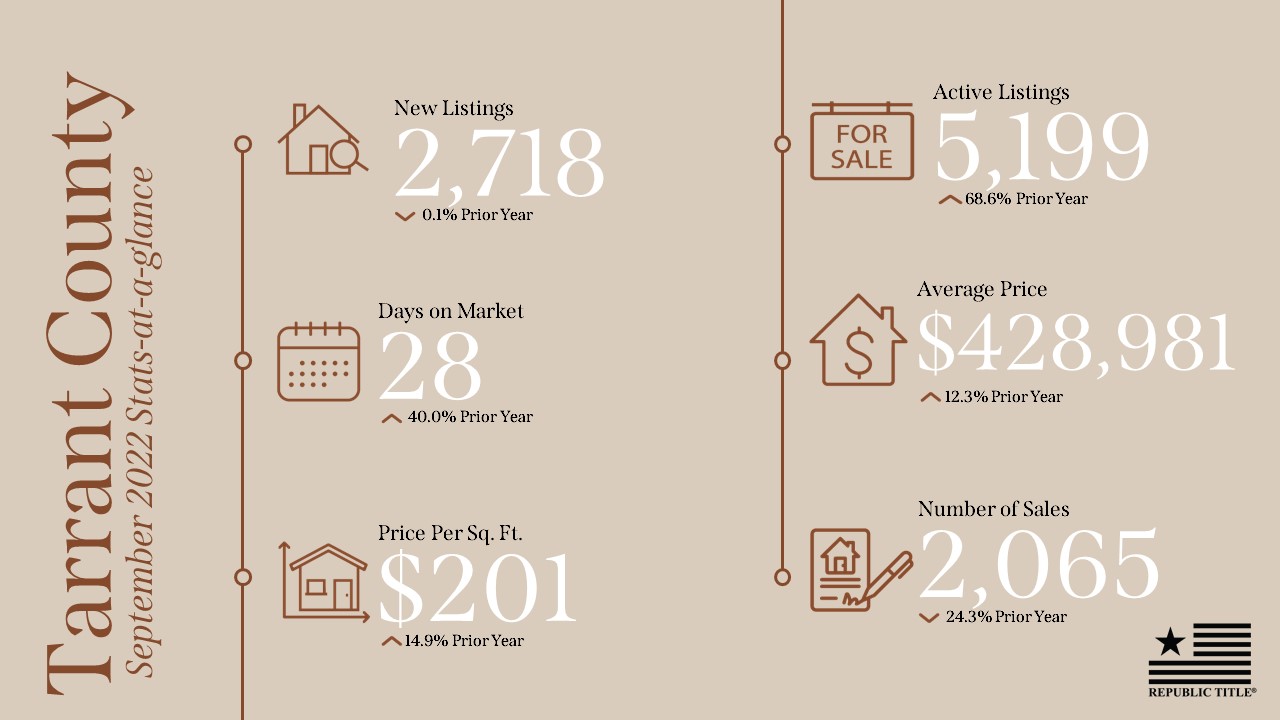
In Collin County, all arrows point up with regard to new and active listings, average sales price, average price per square foot and days on market. The number of sales is down about 26% from 2021. In Dallas County, new listings are down 5.5% from this time last year, along with the number of sales down almost 23% from 2021. The number of active listings is up 22.5% from last year, along with increases in days on market (up 27%), averages sales price (up 9%) from the prior year and prices per square foot (up 16%). Denton County sees the biggest increase in active listings up over 100% from last year, along with increases in new listings, average sales price, average price per square foot and days on market. Not surprisingly, we see much of the same statistics in Rockwall and Tarrant Counties.
The good news is that buyers have more options than they did in 2021. However, even with the increased inventory, there is still only an average of 2.5 month supply in all counties (according to NTREIS TRENDS report) which still makes it very much a sellers’ market in North Texas (with people still moving here)! Happy Selling!
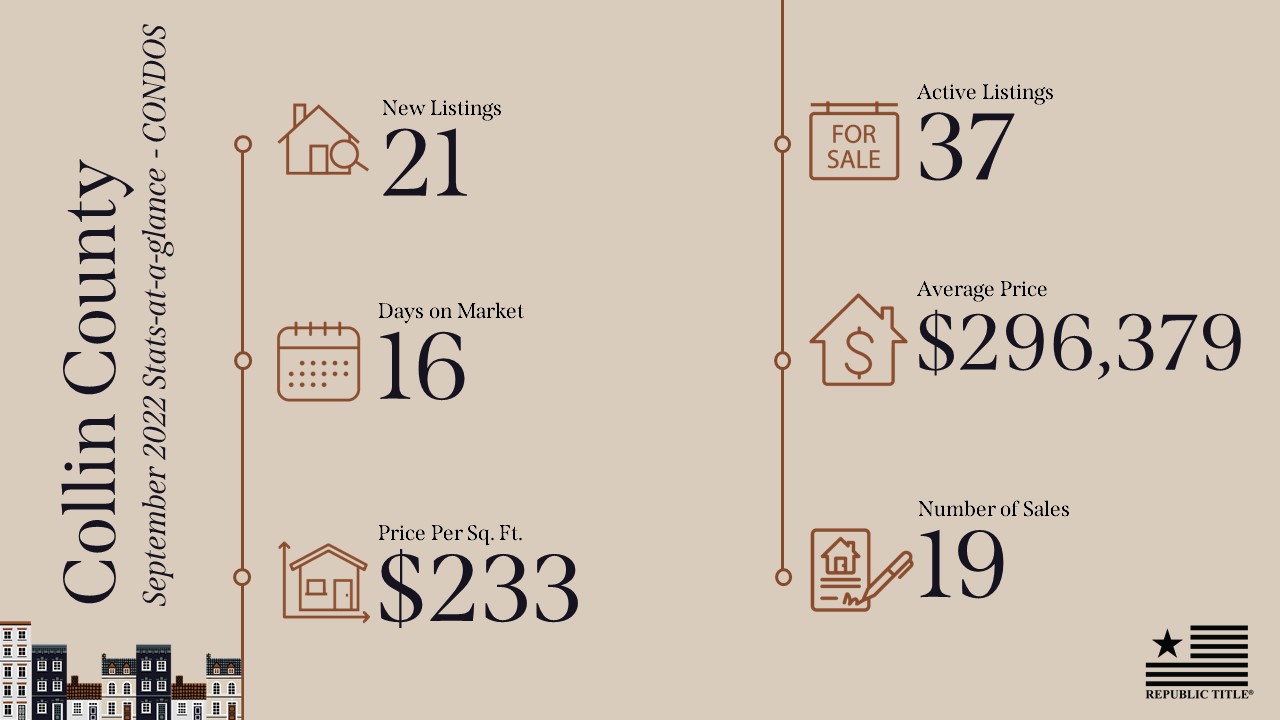
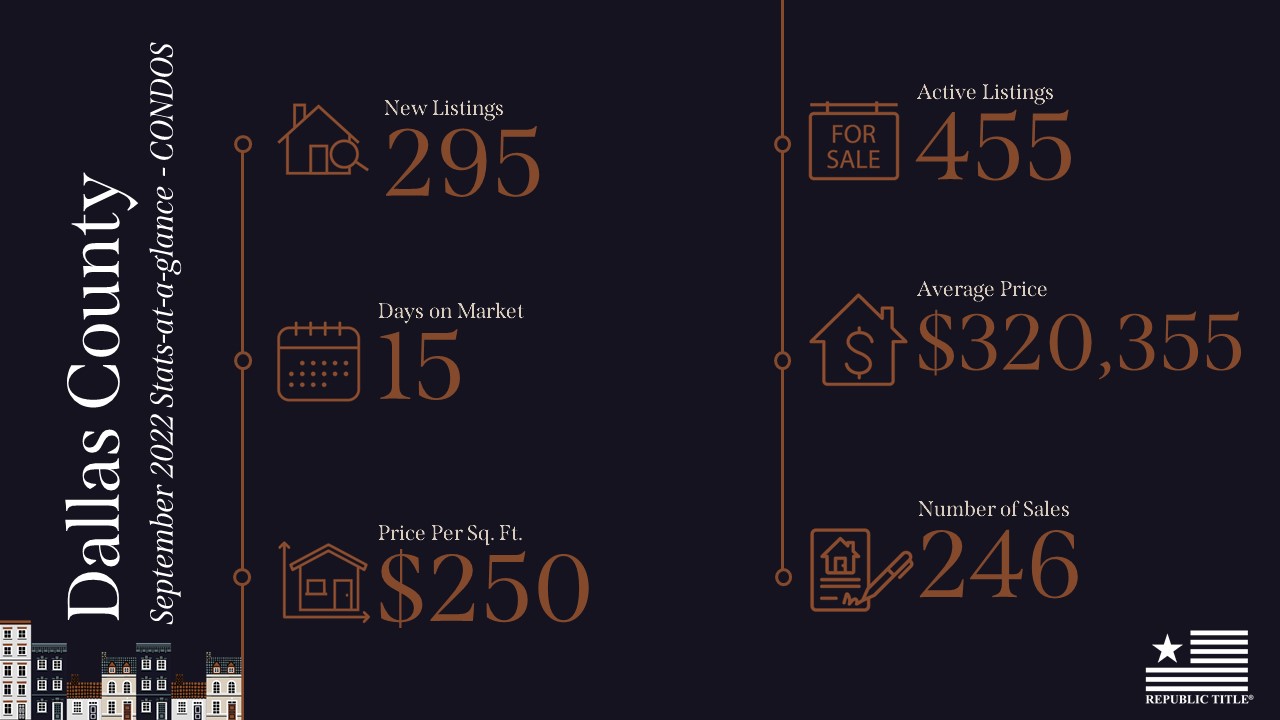
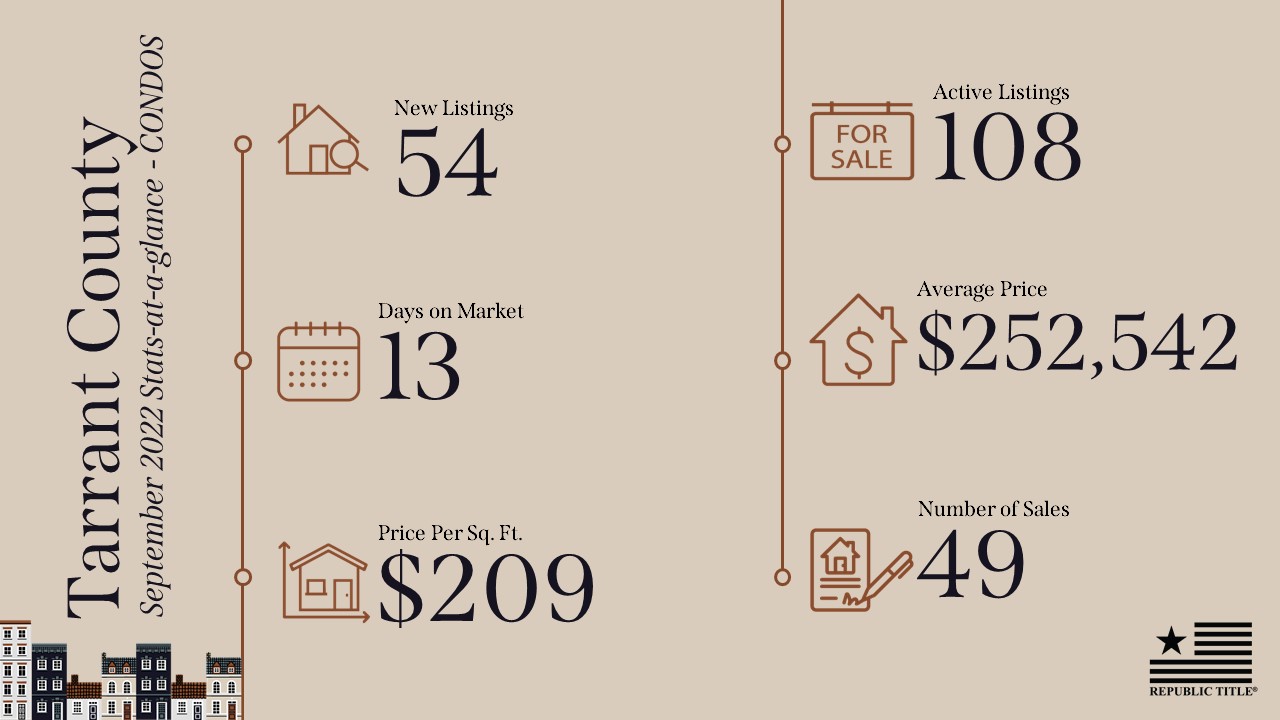
Our stats infographics include a year over year comparison and area highlights for single family homes broken down by county. We encourage you to share these infographics and video with your sphere.