
Total Texas housing sales kicked off the year with a 3 percent improvement, surpassing 38,500 sales to an all-time high. Fort Worth was the only major region within the state where the metric decreased relative to December 2020, although the trend in activity across both sections of the North Texas Metroplex flattened. On the supply side, inventory fell to critically low levels, while new construction indicators stumbled. Combined with dwindling listings, solid demand during low mortgage rates pushed median home price growth up by double-digit percentage increases. Overall, housing demand is expected to remain healthy in 2021 as vaccine rollouts continue, and the approval of a third federal stimulus package aids the economic recovery. Depleted inventory is the greatest challenge to Texas’ housing market, assuming the pandemic is contained.
Supply*
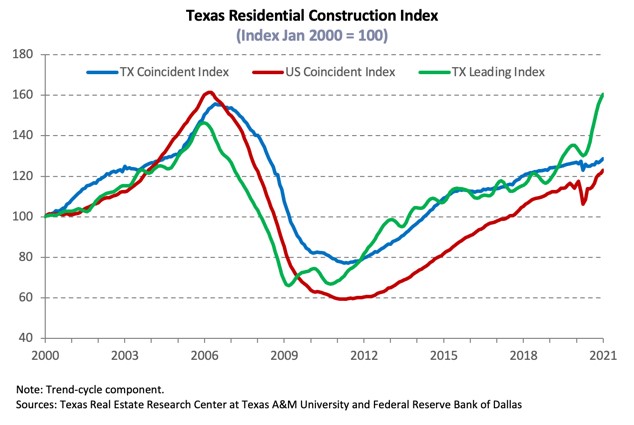
The Texas Residential Construction Cycle (Coincident) Index, which measures current construction levels, ticked up as construction values, employment, and wages improved. The Residential Construction Leading Index also continued on an upward trajectory due to overall elevated building permits and housing starts despite a monthly contraction in January, pointing toward higher construction activity in the coming months. Similarly, the metropolitan leading indexes indicated future activity to be favorable. Only in Houston did the metric flatten.
Recently released fourth-quarter private bank loan data indicated net residential loans decreased 1.1 percent quarter over quarter (QOQ) at the end of 2020 after lending standards tightened throughout the year due to pandemic-related economic uncertainty. Construction investment for one-to-four units led with a third consecutive quarterly decline. Large multifamily projects (buildings consisting of five or more units) flattened at its 2Q2020 series high of $8.9 billion.
Single-family construction permits dropped 8.1 percent from a record high in December. Austin issued 1,940 nonseasonally adjusted permits, exceeding its 2006 average in per capita terms, as did Dallas-Fort Worth. The metro topped the national list with 4,330 permits despite declining in January after adjusting for seasonality. Houston’s metric also stabilized after a strong end to the year, resulting in 4,258 permits. On the other hand, issuance in San Antonio increased for the fifth consecutive month to more than 1,200 permits. In Texas’ multifamily sector, permits trended upward after sluggish activity in 2020 when the pandemic shifted focus away from the apartment sector.
Although the Department of Commerce lowered tariffs on Canadian lumber from 20 to 9 percent at year end, lumber prices increased for the second straight month to an unprecedented level in January. Amid rising homebuilder costs, total Texas housing starts fell 4.8 percent as the single-family sector accounted for reduced activity in the southern region of the U.S. Lumber prices are expected to remain volatile in 2021, pressuring housing affordability in conjunction with robust housing demand. Reflecting monthly fluctuations in starts, single-family private construction values decreased 8.5 percent. The metric declined in DFW and Houston but ticked up in Central Texas.
Increased sales and a downward correction in new listings after activity recovered in the second half of 2020 pulled Texas’ months of inventory (MOI) down to an all-time low of 1.7 months. A total MOI around six months is considered a balanced housing market. Inventory for homes priced less than $300,000 was even more constrained, dropping below 1.3 months. Even the MOI for luxury homes (homes priced more than $500,000) slid to 3.2 months compared with 6.1 months a year ago.
The supply situation in Austin was especially critical, with the MOI trending down for two consecutive years to just half a month. Despite modest expansions in San Antonio’s and Houston’s inventory for homes priced less than $200,000, the overall metric fell to 1.7 and 2.2 months, respectively. In Fort Worth, the MOI ticked down to 1.2 months as contractions in the supply of active listings offset slower sales activity. The Dallas metric was not far behind, slipping to 1.3 months.
Demand
Total housing sales rose 3 percent to a record high in January after slumping the previous two months. Activity increased across the price spectrum, while sales for homes priced less than $300,000 ticked up for the second straight month. Nonseasonally adjusted transactions at the bottom price cohort (less than $200,000), however, fell to the lowest level in the series’ January history, with more than half occurring outside the major metros. The downward trend corroborates the shift in sales to higher-priced homes due to depleted inventory and rising building costs.
San Antonio and Houston sales extended strong upward trends to kick off the year, climbing 4.2 and 6.9 percent, respectively. Austin’s metric elevated 7.3 percent, while the metro’s list-to-sale-price ratio registered above 1.0 for the third straight month, confirming robust demand despite sales falling the previous two months. Dallas transactions also increased after sluggish activity in 4Q2020, accelerating 4.4 percent in January. Levels, however, remained down from October 2020 all-time high. Fort Worth was the exception as sales declined 2.3 percent due to decreased activity in the bottom cohort following a brief pick up at year end.
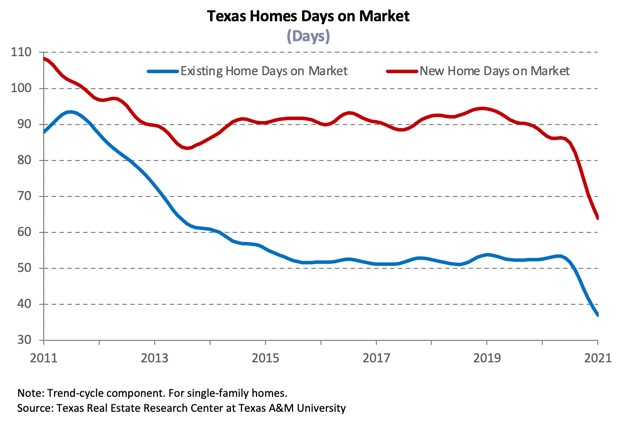
Texas’ average days on market (DOM) reached an all-time low of 43 days, corroborating strong demand as low mortgage rates remained favorable to homebuyers. Austin’s DOM shed almost a month off its year-ago reading, falling to 28 days. The other metros dropped more than two weeks from January 2020 levels, although the metric in Dallas ticked up slightly from the previous month to 36 days. The Houston DOM inched down to 41 days while the average home in San Antonio and Fort Worth sold after 44 and 30 days, respectively.
Vaccine rollouts and optimism regarding a third fiscal stimulus package resulted in higher growth and inflation expectations for 2021. The ten-year U.S. Treasury bond yield rose to 1.1 percent1 in January, its highest level since February 2020. The Federal Home Loan Mortgage Corporation’s 30-year fixed-rate ticked up for the first time in a year to 2.7 percent, although the metric still hovered around its historically low rate recorded at year-end (series starting in 1971). Anticipated increases in mortgage rates this year may soften housing demand. Mortgage rates slid to decades-low levels within Texas during January, sinking to 2.66 percent for non-GSE loans, while the median interest rate for GSE loans was 2.80 percent. Home-purchase applications boomed more than 20 percent in 2020, but activity softened to start the new year. Refinance applications also stabilized after doubling the previous year. The pace is expected to decelerate as the lenders add more requisites and the pool of households able to refinance shrinks. (For more information, see Finding a Representative Interest Rate for the Typical Texas Mortgagee.)
In January, the median loan-to-value ratio (LTV) and debt-to-income ratio (DTI) constituting the “typical” Texas conventional-loan mortgage increased from 84.5 to 85.8 and 34.5 to 35.3, respectively. The median credit score fell from 756 to 750 but still remained elevated relative to 2019 levels due to the rise in average consumer credit scores from relief actions taken by the federal government and lenders who helped some households pay off debt and save money. The metrics of the typical Texas borrower who obtained a loan from a government-sponsored enterprise (GSE) stabilized at 85.4 for the median LTV and 35.8 for the median DTI.
Prices
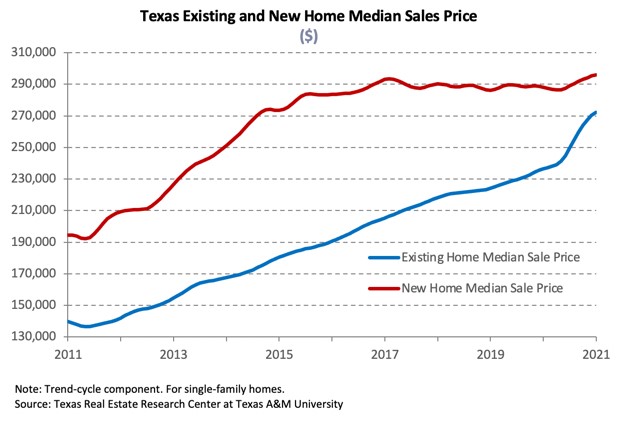
Solid housing demand and depleted inventory resulted in multidecade high home-price growth. The Texas median home price accelerated 12.6 percent year over year (YOY) to $277,900. A shift in the composition of sales toward higher-priced homes due to constrained inventories at the lower end of the price spectrum contributed to the rise in prices. All four major metros experienced double-digit home-price appreciation, but Austin led with a 19.7 percent increase to $379,700. The Dallas median price reached $336,200 after jumping 12.2 percent YOY while the San Antonio metric surged 13.4 percent to $265,600. Movements in Fort Worth’s ($280,000) and Houston’s ($276,200) median price were similar, elevating 11.4 and 11.5 percent, respectively.
The Texas Repeat Sales Home Price Index accounts for compositional price effects and provides a better measure of changes in single-family home values. The index corroborated increased home-price appreciation amid robust housing activity, rising 9.5 percent YOY, but the rate of growth was still less than the surge in the median home price suggested. On the metropolitan level, each index accelerated YOY with Austin’s metric booming 17.6 percent. Home-price appreciation in Dallas also exceeded the state average at 9.7 percent. In Fort Worth and San Antonio, the index jumped 9.1 and 8.7 percent, respectively, followed by the Houston metric at a 7.6 percent clip. Home-price appreciation unmatched by income growth will continue to chip away at housing affordability in 2021, especially as mortgage rates increase.
Single-Family Forecast
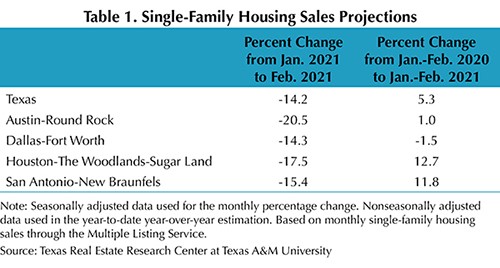
The Texas Real Estate Research Center projected single-family housing sales using monthly pending listings from the preceding period (Table 1). Only one month in advance was projected due to the uncertainty surrounding the COVID-19 pandemic and the availability of reliable and timely data. Texas sales are expected to decrease 14.2 percent in February from activity in January due to impacts of the winter storm that swept across the state. Declines in North Texas and San Antonio activity are predicted to hover close to the state average, but Houston and Austin transactions may drop around 17.5 and 20.5 percent, respectively.
Household Pulse Survey
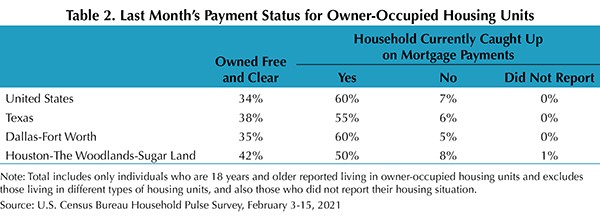
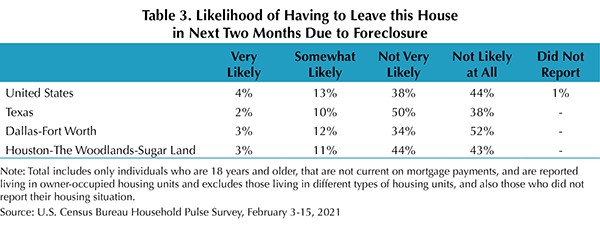
According to the U.S. Census Bureau’s Household Pulse Survey, 6 percent of Texas homeowners were behind on their mortgage payments during January, less than the national share of 7 percent (Table 2). Within Texas’ largest metropolitan areas, the metric declined compared with the previous month, falling to 5 and 8 percent in DFW and Houston, respectively. Moreover, only 12 percent of the respondents in Texas who were not current expected foreclosure to be either very likely or somewhat likely in the next two months compared with just 17 percent nationwide (Table 3). The proportion of delinquent individuals who were at risk of foreclosure ticked up to 15 percent in North Texas but flattened at 14 percent in Houston. Just after the survey was taken, the Federal Housing Finance Agency extended the foreclosure and REO eviction moratoriums for properties owned by Fannie Mae and Freddie Mac (the Enterprises) until June 30, 2021. Eligible borrowers were also granted an additional three-month extension of forbearance for a total of up to 18 months of forbearance. The Center for Disease Control’s federal eviction moratorium is set to expire at the end of March. Continued stability in the housing market is essential to Texas’ economic recovery.
________________
* All measurements are calculated using seasonally adjusted data, and percentage changes are calculated month over month, unless stated otherwise.
1 Bond and mortgage interest rates are nonseasonally adjusted. Loan-to-value ratios, debt-to-income ratios, and the credit score component are also nonseasonally adjusted.
Source – James P. Gaines, Luis B. Torres, Wesley Miller, Paige Silva, and Griffin Carter (March 18, 2021)
https://www.recenter.tamu.edu/articles/technical-report/Texas-Housing-Insight