
Total Texas housing sales continued to grow, increasing by 3.4 percent in the first quarter. Sales were concentrated on homes priced over $300,000. The constrained inventory in the lower-priced cohort pushed the median housing prices to a record-breaking level. Despite rising mortgage rates, housing market demand remains robust, driven largely by demographics. As building material costs (notably for lumber) continued to increase, so did housing starts.
Supply1
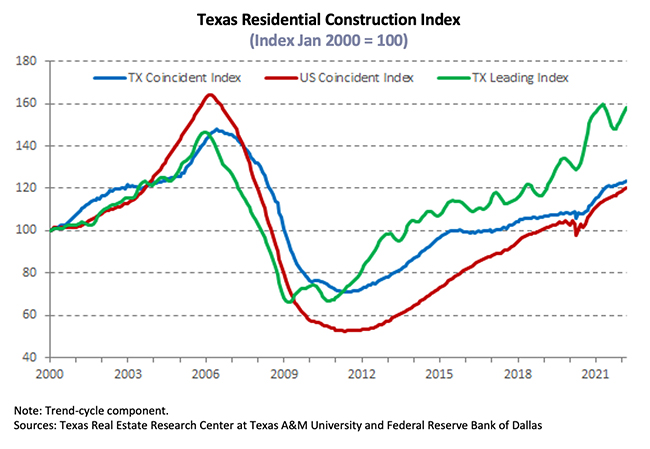
The Residential Construction Cycle (Coincident) Index, which measures current construction levels, increased slightly for both Texas and the U.S. as construction employment, wages, and output remained elevated. Construction activity is expected to continue expanding according to the Texas Residential Construction Leading Index (RCLI). Despite increases in the interest rates, the pace of new building permits and housing starts is expected to push the new home market forward at least for the immediate future.
According to Metrostudy data, after hitting a record high in the last quarter, the supply side contracted at the earliest stage of the construction cycle in the number of new vacant developed lots (VDLs). Despite a 26.3 percent elevation in San Antonio’s lot development, the depressed activity in DFW and Houston outweighed the gain. The contraction was most notable in lots priced between $200,000 and $299,000 for both metros, and DFW accounted for most of the quarterly loss due to reduced investment across all price cohorts, except in lots priced above $500,000.
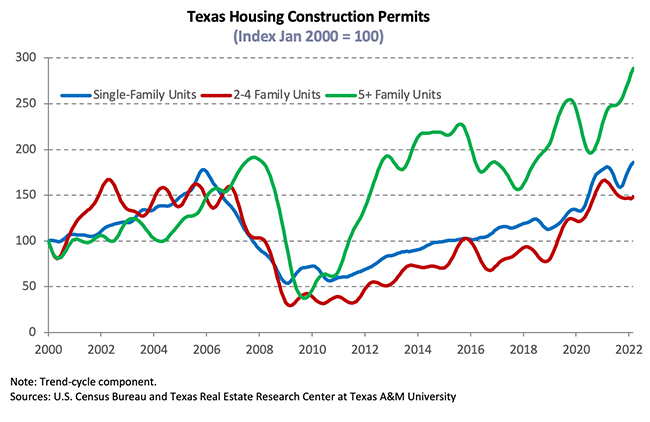
Quarterly growth in single-family construction permits remained steady, hiking to 10.4 percent quarter over quarter (QOQ). All metros posted positive seasonally adjusted growth. Houston and DFW were standouts not only in Texas but also compared with other metros nationwide. Austin edged out San Antonio building permit output with 6,000 permits. Texas’ multifamily sector registered a moderate expansion with 15.06 percent QOQ increase as issuance shifted from two to four units to five or more units.
In 1Q2022, lumber prices continued the latest wave of rises, hiking steeply at 34 percent. In spite of the lumber price disruption for new home construction, total Texas housing starts still grew by a narrow margin of 1.7 percent. Among the 36,000 homes that broke ground in the Texas Triangle, 80 percent were appraised at over $300K. Moreover, Dallas had the most growth in housing starts ($500K+), followed by Austin and Houston ($400K-$499K), and San Antonio ($300K-$399K).
Single-family private construction values increased 7.8 percent QOQ in real terms as the metric trended upward in Texas’ major metros. Houston’s average total cost for building construction surpassed Dallas’ in September 2021, and since then it had been the highest among all the Texas metros. Austin registered a sharp increase of 19.2 percent, while the other metros advanced incrementally.
The number of homes added to the Texas Multiple Listing Services expanded in March with 9,700 listings. Despite this inventory expansion, compared with 1.2 months in 2021Q4, Texas’ months of inventory (MOI) still deflated due to fast turnovers. Homes priced in the $200s had the tightest inventory at 0.8 months for the first quarter.
Both Austin and DFW remained below one month’s inventory, at 0.5 and 0.8 months, respectively. Houston and San Antonio trailed slightly above the one-month mark, at 1.1 and 1.2 months respectively. Inventory levels in each of the big four metros continued to drop over the latest quarter with the exception of DFW, which may have bottomed out.
Demand
While the national demand for housing declined marginally, demand in Texas accelerated, elevating the state total housing sales by 3.4 percent QOQ to 110,737 closed listings. Sales for homes priced above $500,000 continued climbing at an impressive rate, and the luxury home market share jumped to 24 percent with almost as many sales as homes priced from $200,000 to $299,999.
Total quarterly sales expanded in Texas largely due to massive growth in Houston, over 10 percent QOQ. San Antonio grew at a more modest rate of 2.7 percent, while both Austin and DFW contracted. Statewide existing-home sales shrunk for the first quarter, but new-home sales grew enough to push overall sales into positive territory.
Active listings in the existing-home market plummeted, maintaining supply constraints. Active listings of new homes also fell during the first quarter. Houston led the boost in new-home sales with an average of 9,355 closed listings per month, expanding 9.7 percent QOQ. Austin and San Antonio increased marginally with 3,095 and 3,552 closed listings, respectively. New-home sales in DFW decelerated in 1Q2022 after a positive run that started last summer. They tumbled across all price cohorts except $500,000+ homes, most of which were in Dallas.
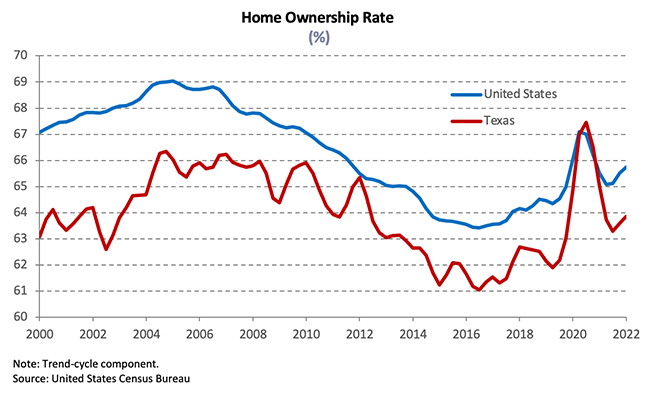
While the homeownership rate for the South was 67.4 percent, the U.S. Census Bureau announced the Texas homeownership rate ticked down 1.1 percentage points to 62.8 percent. Metro-level homeownership rates fell slightly except in San Antonio, where they rebounded 1.54 percent.
Texas’ average days on market (DOM) elevated to 33 days, demonstrating that, while the housing market is still hot, some signs of weakness are emerging. Austin’s DOM gained a day over the previous quarter, averaging 22 days in Q1, while homes sold after an average of 24 and 25 days in Dallas and Fort Worth, respectively. Houston’s metric gained 4.9 percent QOQ, staying above the state average at 35 days. San Antonio fell to 31.4 days. As supply has begun rising to meet demand, DOM has increased QOQ, signifying a slow return to a healthy market.
The Federal Reserve is expected to reduce its balance sheet assets and increase the Federal Funds rate several more times by the end of the year. The ten-year U.S. Treasury bond yield2 rose from 1.5 percent last December to 2.1 percent this March, soaring by at least 60 basis points with much volatility along the way. Furthermore, the Federal Home Loan Mortgage Corporation’s 30-year fixed-rate skyrocketed by 4.2 percent in March 2022, rising firmly from a record low of 2.7 percent in January 2021. Responding to these increased property interests, Texas’ home-refinance applications declined 10.8 percent in the past month, and the metric shrunk 54.8 percent from a year ago. Home-purchase applications, on the other hand, showed strong growth in 2022, albeit diminishing 8 percent from a year ago.
Millennials emerged as a big force of the mortgage applications as many reached 32 years old—the median age for first-time buyers. Though the increased mortgage rates could cool the homebuying frenzy and depress the housing boom, the need for larger family homes as well as for home office space persists, and housing demand remains robust. For a typical Texas mortgagee, the median mortgage rates in March climbed to 3.6 percent for non-GSE loans and 4.1 for GSE loans, respectively. The rates for both loans shot up by about 30 percent from a year ago. Under the pressure of rising interest rates, the original loan balance that constituted the “typical” Texas conventional home loan dropped $222 million in a year to $314 million. Despite the big drop in loan values, the debt-to-income ratio (DTI) rose from 35.3 to 35.6 percent, leaving housing affordability a long-lasting constraint.
Prices
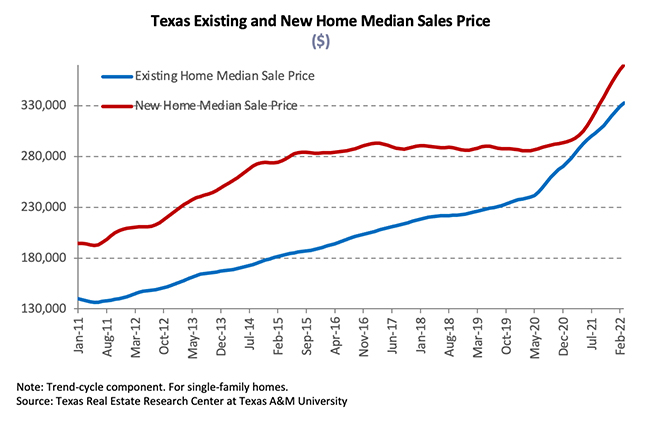
Texas’ median home price rose for the 15th consecutive month, increasing 4.9 percent QOQ to a record-breaking $335,000 in March. The ongoing compositional sales shift toward higher-priced homes contributed to a higher median price. The growing share of higher-priced homes in Austin has increased the median price of homes sold to a new high of $520,000, up 8.9 percent QOQ. The Dallas metric ($416,000) gained 7.4 percent, while the quarterly price growth in Fort Worth ($352,000) elevated 5.9 percent. Houston’s ($330,000) and San Antonio’s ($322,000) metrics rose 4.8 and 4.1 percent, respectively.
The Texas Repeat Sales Home Price Index accounts for compositional price effects and corroborated substantial home-price appreciation as the index hovered near a series maximum, gaining 20 percent YOY. Austin led price growth with almost 30 percent YOY growth. Despite its elevated growth rate, the pace has gradually slowed closer to levels observed in the other major Texas metros. Annual home-price appreciation is at 28 and 25 percent in Dallas and Fort Worth, respectively. San Antonio posted a 20 percent annual hike followed by Houston with 15 percent growth. Rapid price growth outpaced wage gains, adding additional pressure to housing affordability.
Household Pulse Survey
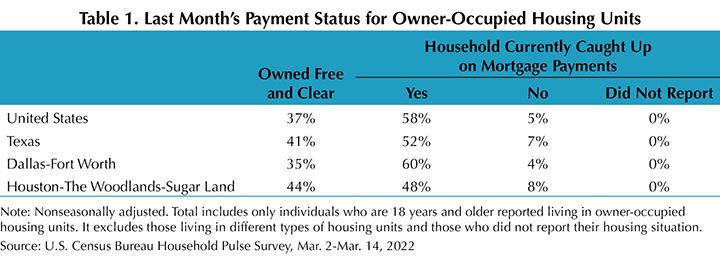
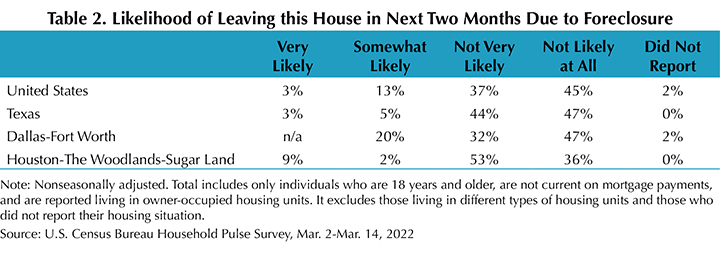
According to the U.S. Census Bureau’s Household Pulse Survey, the share of Texas homeowners behind on their mortgage payments jumped 3 percentage points to 7 percent (Table 1). Houston areas mirrored the statewide average, where the behind-the-payment share increased 2 percent points, while DFW area was unchanged at 4 percent. The share of Texas respondents who were somewhat likely to leave their houses in the next two months due to foreclosure shrunk by 20 percent to 5 percent, much lower than the national rate of 13 percent (Table 2).
________________
1 All measurements are calculated using seasonally adjusted data, and percentage changes are calculated month over month, unless stated otherwise.
2 Bond and mortgage interest rates are nonseasonally adjusted. Loan-to-value ratios, debt-to-income ratios, and the credit score component are also nonseasonally adjusted.
Source – Joshua Roberson, Weiling Yan, and John Shaunfield (June 9, 2022)
https://www.recenter.tamu.edu/articles/technical-report/Texas-Housing-Insight