Texas’ housing market continued to rise in November, trending upward despite ongoing supply constraints. Months of inventory slid to 1.5 months, and single-family permits weakened. Housing starts, however, expanded despite lumber and other input price increases. The lack of inventory for homes priced under $300,000 remains the greatest challenge to Texas’ housing market. Demand remained steady despite being stagnated by lack of inventory. Still, the state’s diverse and expanding economy, favorable business policies, and steady population growth support a favorable outlook.
Supply1
The Texas Residential Construction Cycle (Coincident) Index, which measures current construction activity, decreased nationally and within Texas due to falling employment outweighing heightened construction gains. The Texas Residential Construction Leading Index (RCLI) possibly reached a trough and could increase in the coming months, signaling an increase in future activity. The leading index’s downward trend was reverted by an increase in weighted building permits and residential construction value starts along with the ten-year real Treasury bill’s continued decline. The leading indexes in the major metros continued to decline, indicating slower activity in the coming months. Current inflationary conditions due to supply chain issues are putting downward pressure on construction activity and may impede construction activity in the coming months.
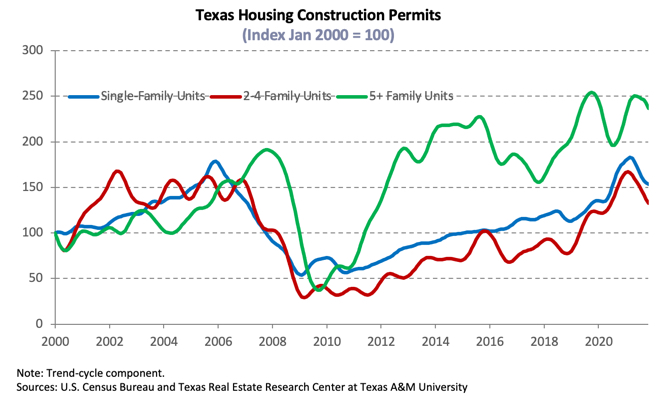
Single-family construction permits fell 2.2 percent month over month (MOM), and the permit issuance had dropped since December 2020. Despite the overall decrease, Houston and DFW remained the top metros nationally, outnumbering Phoenix by 1,000 permits. Houston ranked first for the eighth consecutive month with 3,887 nonseasonally adjusted permits, followed by DFW with 3,523 permits. Austin and San Antonio issued 1,480 and 872 permits, respectively. Texas’ multifamily permits plummeted 12.2 percent on a monthly basis; however, the metric was up 12.3 percent year to date (YTD).
After three months of continuous decline, robust economic conditions and copious demand pushed total Texas housing starts up 6.5 percent as lumber prices increased 12.4 percent. Single-family private construction values also increased in real terms. A 10.6 percent MOM upturn in Houston values contributed to the majority of the statewide growth. This upswing overcame the 13.2 percent and 8.6 percent MOM reduction, respectively, in Austin and San Antonio.
Texas’ months of inventory (MOI) hovered at 1.5 months as active listings and sales activity stabilized. A six-month MOI is typically considered a balanced housing market. Supply was limited across all price categories. Most notably, the inventory for luxury homes (those priced more than $500,000) dropped to 2.3 months, a record low. Total housing inventory in the major metros dropped slightly, with the MOI remaining most constrained in Austin at 0.8 months. The metric in North Texas fell to one and 1.1 months in Dallas and Fort Worth, respectively. Houston’s MOI decreased to 1.6 months, while San Antonio’s declined to 1.7 months. Dwindling inventory persisted as a major headwind to the health of Texas’ housing market.
Demand
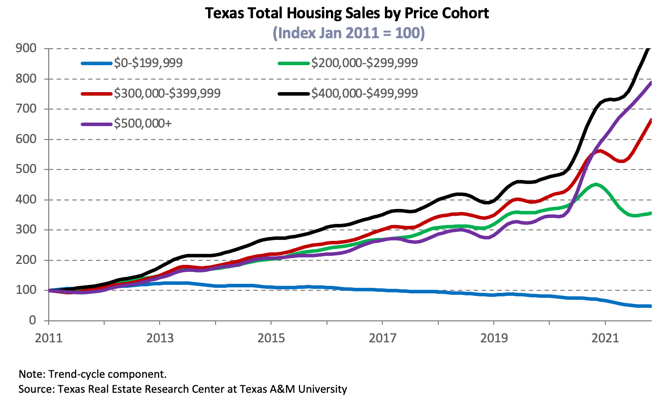
Despite the deflated inventory, demand increased across all price cohorts. Total housing sales rose 2.6 percent MOM. Transactions at the lower end of the price spectrum decreased significantly compared with year-ago levels, while the opposite occurred at the higher end. Housing sales for homes priced under $299,000 cut back 23.1 percent YTD, while housing sales for homes priced at more than $300,000 rose 37.8 percent YTD.
Housing sales increased across the price spectrum at the metropolitan level, except in San Antonio where total sales contracted 3.3 percent. Meanwhile, Houston mirrored statewide fluctuations as sales jumped 2.6 percent. In Austin, the metric rose 1.1 percent, while North Texas activity increased 0.5 and 8.1 percent in Dallas and Fort Worth, respectively.
Texas’ average days on market (DOM) fell marginally to 31 days amid robust demand and limited inventory. Austin remained the most popular housing market with its DOM slipping another day, averaging 20 days. The metrics in North Texas averaged 25 days. San Antonio’s and Houston’s metrics registered two-day gains, with both metros averaging 34 days.
Market expectations are for the Federal Reserve to accelerate the tapering of asset purchases and increasing the Federal Funds rate two to four times in 2022. The ten-year U.S. Treasury bond yield returned to pre-pandemic levels of 1.6 percent2, while the Federal Home Loan Mortgage Corporation’s 30-year fixed-rate hovered around 3.1 percent for the second consecutive month. The median mortgage rate for the typical Texas homebuyer climbed to 3.2 percent for GSE loans in October3 and fell ten basis points to 2.9 percent for non-GSE loans. Among the mixed mortgage interest rate changes, home-purchase applications strengthened for November but overall fell 4 percent YTD. Meanwhile, refinance applications have declined on a monthly basis and were down 29.9 percent since December 2020. Year-over-year (YOY) purchase and refinance applications diminished 3.5 and 31.7 percent, respectively, largely due to baseline effects after a surge of remodeling and refinancing in 2020. (For more information, see Finding a Representative Interest Rate for the Typical Texas Mortgagee.)
In October, the median loan-to-value ratio (LTV) constituting the “typical” Texas conventional-loan mortgage dropped from 87.4 the previous year to 84.2. The debt-to-income ratio (DTI) declined from 36.4 to 35.5, while the median credit score increased six points to 751 over the same period. The LTV for GSE borrowers increased slightly from 85.2 in October to 85.7; meanwhile, their DTI grew from 35.5 to 36.7.
Prices
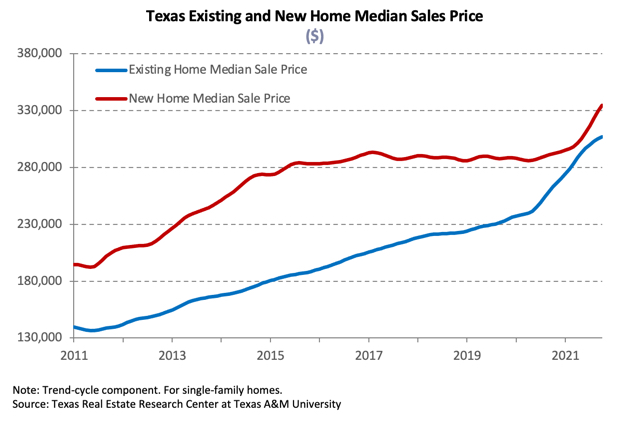
The ongoing shift in the composition of sales toward higher-priced homes due to constrained inventories at the lower end of the market boosted the average and median home price. The Texas median home price rose for the 11th consecutive month, appreciating 1.7 percent on a monthly basis and 17.2 percent YOY to a record-breaking $319,112. The five major metros all hit historically high median prices. The share of luxury homes sold in Austin continued to expand, contributing to the 29.6 percent YOY surge in the median price ($475,700). The Dallas metric ($386,500) increased 18.1 percent, while annual price growth in Fort Worth ($331,800) shot up to 20.6 percent. Houston’s ($315,200) and San Antonio’s ($308,600) metrics were hikes of 16.2 and 19.7 percent, respectively.
The Texas Repeat Sales Home Price Index accounts for compositional price effects and provides a better measure of changes in single-family home values. Compared with November 2020’s 7.8 percent YOY increase, Texas’ index corroborated significant home-price appreciation, accelerating 18.6 percent YOY in 2021. The growth rate surpassed the surge in the median home price. The repeat sales index accelerated in the major metros, except in Austin and Houston. Annual price growth reached recent peaks in Dallas. The metric dipped to 35.1 percent in Austin after a year of explosive growth, while North Texas prices increased 24.1 and 22 percent in Dallas and Fort Worth, respectively. San Antonio posted an 18.4 percent annual hike, while Houston’s index decelerated to 14.6 percent. Increasing home prices pressured housing affordability, decreasing Texas’ affordability advantage over other states like California.
Single-Family Forecast
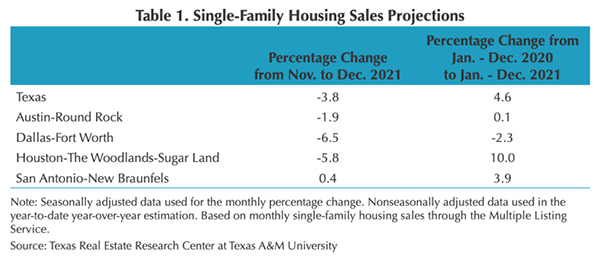
The Texas Real Estate Research Center projected single-family housing sales using monthly pending listings from the preceding period (Table 1). Texas sales are expected to fall 3.8 percent in December after increasing during the past month. The metric is estimated to slow to 1.9 percent in Austin, with additional losses of 6.5 percent and 5.8 percent in DFW and Houston, respectively. Transactions in San Antonio, however, are forecasted to rebound 0.4 percent. Sales through December 2021 should accelerate relative to the same period in 2020. On the supply side, listings seemed to have reached a trough in May and are rising, easing some of the price pressures amid a rise in new and pending listings.