
Total Texas housing sales rebounded 6.3 percent in September, pushing third-quarter activity up more than one-third above depressed 2Q2020 levels. Historically low mortgage interest rates helped elevate sales, with new-home transactions increasing more than 8 percent. The Lone Star State’s homeownership rate rose to an all-time high of 70 percent, exceeding the national metric for the first time since 2012. Survey data, however, indicated Texas mortgagees may be more at risk of foreclosure in the coming months than the average U.S. household due to a higher proportion of FHA and VA loans in the state.
On the supply side, lot development slowed in 3Q2020, but single-family building permits and construction values trended upward. Additional housing is greatly needed as months inventory slid to record lows, especially for homes priced less than $300,000. Constrained inventory contributed to the near-double-digit growth in the median home price as the composition of sales shifted toward higher-priced houses. The Real Estate Center’s Repeat Sales Home Price Index also accelerated, albeit at a more moderate pace, threatening recent improvements in affordability. The pandemic remains the greatest headwind to the Texas housing market as the Center projected a slowdown in single-family sales during October amid a resurgence in COVID-19 cases.
Supply1
The Texas Residential Construction Cycle (Coincident) Index, which measures current construction levels, ticked up modestly due to improvements in industry wages, employment, and construction values. The Residential Construction Leading Index rose for the fifth straight month amid increased building permits and housing starts and a decrease in the real ten-year Treasury bill. The major metros also registered growth in their leading indexes except for San Antonio, where permits and starts fell, pulling the metric down.
According to Zonda (formerly Metrostudy), activity at the earliest stage of the construction cycle was sluggish during the third quarter as the number of new vacant developed lots (VDLs) in the Texas Urban Triangle flattened. Only VDLs in North Texas posted an increase, rising more than 40 percent quarter over quarter (QOQ) due to improvement in the $300,000 and above price range. San Antonio’s metric normalized after doubling the previous quarter but still trended upward. Vacant lot development in Austin, however, registered a one-fifth drop below 4Q2019 levels, while Houston posted its second straight quarterly decline following a yearlong climb.
Single-family construction permits backtracked 1 percent in September but remained on a strong upward trajectory after reaching an all-time high the prior month. The decrease was largely concentrated in Houston, where nonseasonally adjusted permits fell to 4,570. Nevertheless, the metro topped the national list, followed by Dallas-Fort Worth (DFW) with 4,193 permits. Issuance in Central Texas flattened at 1,843 and 905 permits in Austin and San Antonio, respectively. On the other hand, Texas’ multifamily permits almost doubled in September, rising to a year-to-date (YTD) high due to renewed strength in the apartment sector. Still, multifamily permits sank 2.2 percent QOQ.
Total Texas housing starts rebounded 20.6 percent on a monthly basis despite record-breaking lumber prices. Zonda data revealed more than 27,100 single-family homes broke ground in the Texas Urban Triangle in 3Q2020, surging 6.1 percent. Activity for homes priced less than $500,000 increased statewide and in Houston, where starts rose 24.6 percent QOQ. San Antonio registered upticks across the price spectrum, climbing 28 percent overall. Starts in Austin and Dallas, however, declined 9.2 and 7.0 percent, respectively, after just modest improvement the previous quarter.
Although single-family private construction values backtracked on a monthly basis in September, third-quarter values rebounded 32.8 percent following a decline during the second quarter. Central Texas posted the largest monthly decreases but increased 28.5 percent QOQ in Austin and 17.5 percent in San Antonio. The metric also maintained a strong upward trend in Dallas and Houston, rising 21.1 and 48.7 percent QOQ, respectively.
Record sales and a dwindling supply of active listings pulled Texas’ months of inventory (MOI) down to an all-time low of 2.2 months. A total MOI of around six months is considered a balanced housing market. Inventory for homes priced less than $300,000 was even more constrained, sliding below 1.6 months. The MOI for luxury homes (homes priced more than $500,000), although elevated at 5.7 months, decreased for the fourth straight month.
Inventory fell to unprecedented levels in the major metros as well, plummeting to one month in Austin. The metro’s MOI for homes priced less than $300,000 was just half a month. In North Texas, inventory dropped to 1.8 and 1.6 months in Dallas and Fort Worth, respectively. San Antonio’s metric matched the state average, while Houston’s MOI sank for the sixth consecutive month to 2.5 months.
Demand
Total housing sales accelerated 6.3 percent in September to an unprecedented high, boosted by historically low mortgage rates. Every price cohort registered increased activity, boosting YTD sales up more than 5 percent above transactions during the same period last year. The Lone Star State continued to outpace the national metric, which surpassed last year’s nine-month sum by 2.1 percent. The current rate of sales, however, is unsustainable given Texas’ depleted inventory.
A shift in preferences from inner-city apartments to homes outside the city center with more space supported new-home sales as well. Per Zonda, Austin new-home sales accelerated 13.1 percent QOQ to an all-time high of 5,389. Increased activity in DFW and San Antonio resulted in 10,782 and 4,150 sales, respectively. Houston sold 8,276 new homes, less than the prior quarter, but posted its tenth straight year-over-year (YOY) improvement.
Strong sales activity during 3Q2020 pushed Texas’ homeownership rate up well above the national rate of 67.4 percent to an unprecedented 70 percent (with the U.S. Census’ Current Population Survey/Housing Vacancy Survey series beginning 1996). Nationally, homeownership fell across all races and every age group, except for 65 years and older. At the metropolitan level, Austin registered the greatest homeownership rate of out Texas’ Urban Triangle for the first time in 12 years, rising almost 9 percentage points to 74.7 percent. DFW’s metric climbed to 69 percent, while San Antonio homeownership stabilized at 66.3 percent. Houston was the exception, with the proportion of owner-occupied units falling from 67.9 to 65.5 percent. Homeownership could suffer in 2021 as COVID-19 foreclosure-protection policies expire.
Texas’ average days on market (DOM) slid to an all-time low of 54 days, corroborating robust demand despite the pandemic. Austin posted the most drastic annual decline, shaving two weeks off its metric to drop to 39 days. The DOM trended downward in North Texas, falling to 42 and 41 days in Dallas and Fort Worth, respectively. Houston’s metric matched the statewide measure, while the average home in San Antonio sold after 58 days.
Low inflation expectations and persistent economic uncertainty surrounding the pandemic, in part due to a dubious timeline for a second round of fiscal stimulus, kept interest rates at historically low levels. The ten-year U.S. Treasury bond yield inched up for the second straight month to 0.7 percent2, but the Federal Home Loan Mortgage Corporation’s 30-year fixed-rate fell to an unprecedented low below 2.9 percent (series starting in 1971). Mortgage rates slid to decades-low levels within Texas during August, sinking to 3.01 and 3.07 percent for non-GSE and GSE loans, respectively. The drop in rates pushed home-purchase applications up 15.5 percent YTD in September. Refinance activity increased for the first time since March, rising more than 50 percent YTD. (For more information, see Finding a Representative Interest Rate for the Typical Texas Mortgagee.)
In August, the median loan-to-value ratio (LTV) and debt-to-income ratio (DTI) constituting the “typical” Texas conventional-loan mortgage decreased from 85.3 to 84.0 and 35.5 to 34.9, respectively, reaching multiyear lows. Meanwhile, the median credit score ticked up from 750 to 753 as average consumer credit scores have been rising during the pandemic due to early relief actions taken by the federal government and lenders that helped some households pay off debt and save money. The median DTI of the typical Texas borrower who obtained a loan from a government-sponsored enterprise (GSE) inched up to 35.6 from 35.5, but the median LTV declined to 85.3 from 85.8. The overall trend of improved credit profiles may reflect tightening lending standards as economic uncertainty prevails.
Prices
The Texas median home price accelerated 9.9 percent YOY in September, reaching a record high $266,500 as the price per square foot for existing homes posted an unprecedented $127. Annual price growth exceeded 11 percent in three of the state’s major regions – Austin ($359,300), Dallas ($326,100), and San Antonio ($261,000). In Fort Worth ($269,900) and Houston ($266,400), the median home price rose 9.0 and 8.5 percent, respectively. The shift in the composition of sales toward higher-priced homes due to constrained inventories at the lower end of the price spectrum contributed to the increase in home prices.
The Texas Repeat Sales Home Price Index accounts for such compositional effects and provides a better measure of changes in single-family home values. The index suggested more moderate home-price appreciation than the change in the median price, but it still accelerated 5 percent annually in 3Q2020. At the metropolitan level, Austin’s metric rose at the fastest pace, skyrocketing 8.4 percent, followed by Fort Worth and San Antonio, where the index jumped 5.1 and 5.0 percent, respectively. The larger metros posted home-price appreciation of more moderate rates, increasing 4.4 percent in Dallas and 3.6 percent in Houston.
Historically low interest rates supported increased housing affordability in Texas’ major metros during the third quarter, but elevated home prices slowed the upward climb established within the past year. Fort Worth and Houston were the most affordable locales with an index of 1.9, indicating that a family earning the median income could afford a home 90 percent more than the median sale price. In both Austin and San Antonio, the metric flattened to 1.7, while Dallas’ index fell slightly below that of the Central Texas reading. Continued improvement is important to Texas’ demographic advantages that have supported the state’s economic prosperity over the past decade.
Single-Family Forecast
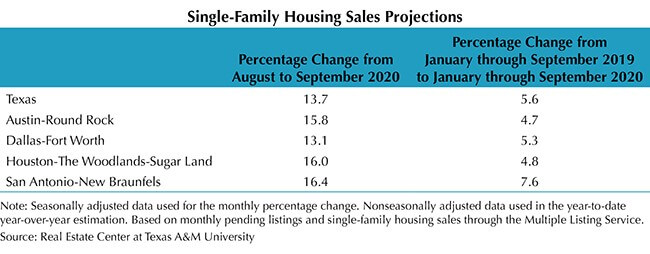
The Real Estate Center projected single-family housing sales using monthly pending listings from the preceding period (Table 1). The Center projected only one month in advance due to the uncertainty surrounding the COVID-19 pandemic and the availability of reliable and timely data. Texas sales are expected to increase less than 1 percent in October after climbing by more than a tenth in September. Amid shrinking inventory and an upturn in COVID-19 cases, the rapid pace in Austin and Houston is anticipated to decelerate to 2.1 and 2.4 percent improvement, respectively. Meanwhile, single-family sales are predicted to tick up just 0.9 percent in DFW, and decline 2.2 percent in San Antonio.
Household Pulse Survey
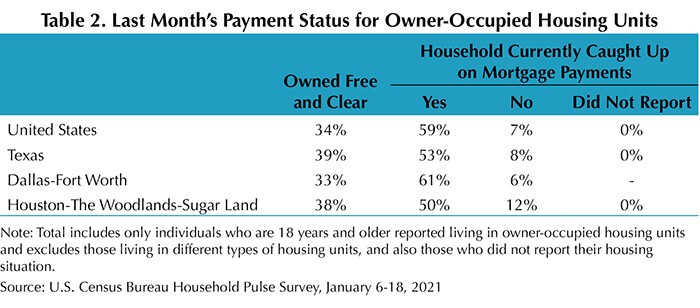
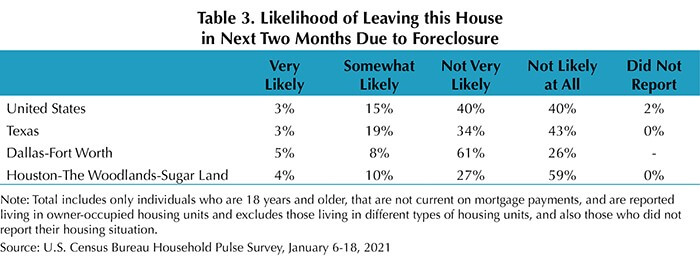
According to the U.S. Census’ Household Pulse Survey, 7 percent of Texas homeowners were behind on their mortgage payments during September, greater than the national rate of 6 percent (Table 2). Although the proportion of homes owned free and clear in DFW and Houston was less than the state average, the percentage of households delinquent hovered around the statewide rate due to a greater ratio of occupants who were current on their mortgage payments. Of the Texas respondents who were not current, more than one-fifth expected foreclosure to be either very likely or somewhat likely in the next two months compared with just 18 percent nationwide (Table 3). That same metric, however, was lower in the state’s largest metro areas where local foreclosure protections may be in place. Currently, federal foreclosure moratoriums are in place until Dec. 31, 2020. Continued stability in the housing market is essential to Texas’ economic recovery.
________________
1 All measurements are calculated using seasonally adjusted data, and percentage changes are calculated month over month, unless stated otherwise.
2 Bond and mortgage interest rates are nonseasonally adjusted. Loan-to-value ratios, debt-to-income ratios, and the credit score component are also nonseasonally adjusted. Texas data typically lags the Texas Housing Insight by one month.
Source – James P. Gaines, Luis B. Torres, Wesley Miller, Paige Silva, and Griffin Carter (November 17, 2020)
https://www.recenter.tamu.edu/articles/technical-report/Texas-Housing-Insight