
Record housing prices and rapidly rising mortgage rates are making homebuyers reconsider the value of home purchases. In April, the median single-family price climbed to almost $350,000 in Texas, and the national mortgage rate rose almost 2 percent in the span of one year, making home purchases a challenge especially for first-time buyers. Seasonally adjusted home sales declined for three consecutive months since January’s peak, and the weighted loss on homes valued less than $300,000 reflected first-time buyers’ pause. Meanwhile, more expensive homes had a marginal sales increase. The unusually low inventories persisted. However, demand in building permits rebounded in April. The growing future supplies and the steep borrowing rates are expected to slow home-price growth and cool the frenetic housing market.
Supply1
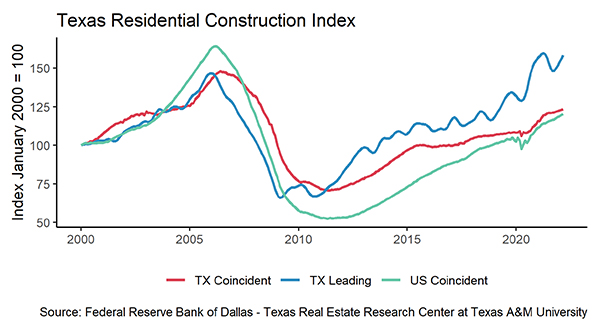
The Residential Construction Cycle (Coincident) Index, which measures current construction levels, trended upward nationally and in Texas due to increased industry wages, employment, and construction values. Both the Texas and U.S. Residential Construction Leading Index indicated construction activity is expected to strengthen in the coming months as weighted building permits and employment continue to elevate.
Building permits for U.S. future single-family homes decreased for the second month, signaling a cooling housing market at the national level. In Texas, on the other hand, permits rebounded to a seasonally adjusted (SA) monthly rate of 16,000 units after March’s marginal decrease. Houston and Dallas topped the national list with 4,800 and 4,700 non-seasonally adjusted permits, respectively. Austin and San Antonio issued 2,100 and 1,400 permits, respectively. In Texas’ multifamily sector, increased April permits revealed leading growth in two-to-four units.
Unlike last year’s series of price hikes when winter ended and construction season started, lumber price moderated in April, falling sharply with a double-digit decline from March. Supported by the sudden drop of building input costs, Texas’ total housing starts rebounded this month along with construction starts in the southern region of the U.S. As housing starts inched up, Texas’ single-family construction values increased 2.7 percent month-over-month (MOM). However, they were down for the 11th month compared with year-ago values. At the state level, private construction values in 2022 were all lower than 2021’s same-period values. At the metropolitan level, private construction values were mixed, with Dallas and San Antonio falling from mid-2021 peaks and Houston and Austin surpassing previous values and peaking in early 2022. Austin and Houston increased 11.6 and 8 percent year-to-date (YTD), respectively, while Dallas and San Antonio registered losses.
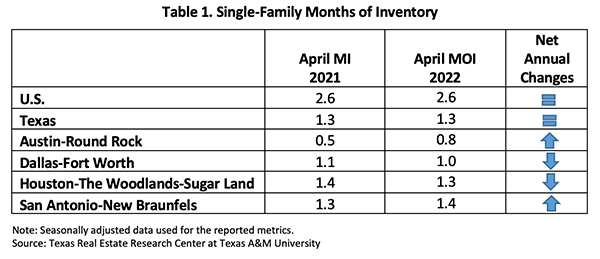
New listings for existing and new construction expanded in April. New-home listings were up 7,200 SA compared with 2021’s monthly average of 6,200 units. Total active listings had a10.4 percent MOM hike, pulling Texas’ months of inventory (MOI) up to 1.3 months (Table 1). Before March, the state’s MOI fell five consecutive months to a record low of 1.2 months (a total MOI around six months is considered a balanced housing market). The rebound was evident for every price cohort, and it signaled a less heated housing market. The rebound was most significant for homes priced between $500,000 and $749,999 with 0.3 months lengthened market time. Homes priced under $400,000 remained the most constrained with 1.2 months, and the expansion for this price cohort was moderate.
April’s MOI metrics of the major metros broke down the trend of the statewide metric. MOI was up in every major metro in April as active listings expanded. Austin had the largest monthly gain in active listings (30.8 percent), while Houston grew 9.2 percent to a rate of 12,800 SA units, contributing nearly one-third of the state’s total housing inventories. Dallas and Fort Worth, which flattened at record-low MOI’s for all three months in 2022Q1, rose for the first time this year. Furthermore, new listings in San Antonio made up 93 percent of the metro’s record supply in December 2021, signaling more sellers had entered the local housing market.
Prices
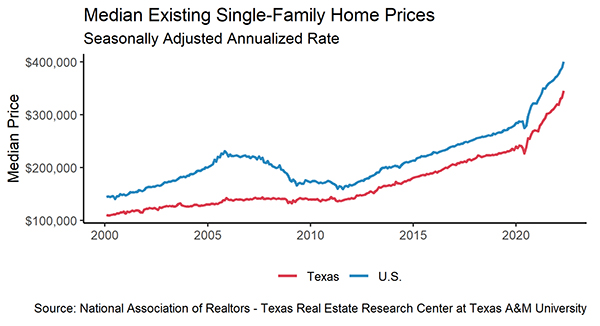
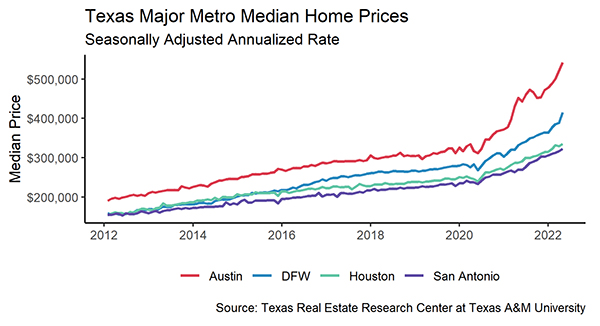
A shift in the composition of sales toward higher-priced homes due to constrained inventories at the lower end of the market contributed to home-price appreciation. The Texas median home price continuously hit record highs starting in January 2021, and the median price rose to a record-breaking $349,000 this month, climbing over 25 percent since then. Austin ($530,000) and Dallas ($439,000) were the two most expensive metros in which to own a single-family home. Amid all expanding metros, the median price growth was most notable in Austin at 37.6 percent. The tech metro’s exponential growth brought the price gap between Austin and Dallas from $49,000 in January 2021 to $91,000 in April 2022. Meanwhile, median prices in San Antonio ($325,000), Houston ($337,000), and Fort Worth ($370,000) advanced at a double-digit rate. Houston was the slowest at raising its housing price in terms of price per square foot since 2010.
The Federal Reserve is expected to reduce its balance sheet assets and increase the Federal Funds rate at least six more times in 2022. The ten-year U.S. Treasury bond yield shot up to 2.75 percent2 in April, increasing 62 basis points in one month. The spread difference between the ten-year and the two-year bond yields shrunk to 21 basis points, the lowest since February 2020. The Federal Home Loan Mortgage Corporation’s 30-year fixed-rate, which for years hovered around 3 percent, elevated to 4.98 percent this month. Rising interest rates deterred potential borrowers, and as a result the loan counts for both the GSE and non-GSE loans shrunk by half.
The Texas Repeat Sales Home Price Index accounts for compositional price effects and provides a better measure of changes in single-family home values due to changes in market forces alone. Texas’ index corroborated substantial and unsustainable home-price appreciation, soaring 19.9 percent YOY. Dallas’ and Fort Worth’s index rose 27.7 and 25 percent, respectively, as home-price appreciation shot up in North Texas. Meanwhile, the metrics climbed around 20 percent in a year for the other three major metros. Increasing home prices pressures housing affordability, particularly in an environment of mortgage rate hikes and low real wage growth.
Demand
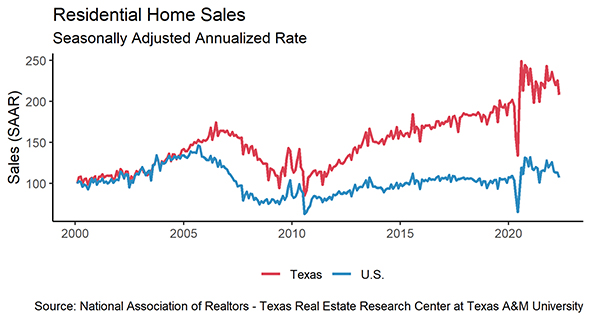
According to the Multiple Listing Service (MLS), seasonally adjusted total housing sales peaked in January with nearly 39,000 transactions in the state. Sales have declined monthly since then. In April, total housing sales fell to 34,000 closed listings. Sales in all major metros declined under the price pressures. Houston had 9,500 sales in April, down 1,400 from the January record. Dallas followed with 5,800 closed deals. Austin, Fort Worth, and San Antonio hovered around 3,000 sales, each losing hundreds of home transactions.
Home appreciation drastically changed the price structure of housing sales. Sales slipped 6.2 percent for homes priced below $500,000, while transactions for more expensive homes increased about 1 percent. The slip weighed heavily on homes priced below $300,000, and the market share for these homes shrank from 50 percent April 2021 to 35 percent.
Texas’ average days on market (DOM) inched down to 30 days after a small rebound in February. In Austin and North Texas, the average home sold fastest, staying on the market for only 21 days. San Antonio’s DOM matched the statewide metric, while Houston’s steadied at 34 days. Categorized by price cohorts, homes priced in the $300K cohort sold fastest, typically leaving the market in 28 days. Homes less than $300K had a conspicuously longer market duration. Despite major housing shortages in affordable housing, many of these homes, which had below-average asking prices and above-average DOMs, may be in poorer condition than normal market expectations, illustrating the limits to housing demand.
Household Pulse Survey
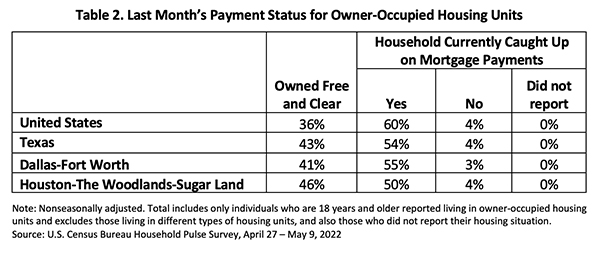
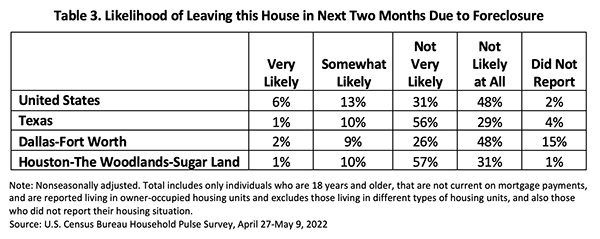
More Texas homeowners were on pace with mortgage payments. According to the U.S. Census Bureau’s Household Pulse Survey, the share of Texas homeowners behind on their mortgage payments inched down from last April, along with the national average (Table 2). DFW’s metric also ticked down, while Houston’s rate remained unchanged. The share of Texas respondents who were either very likely or somewhat likely to forfeit in the next two months was at 11 percent, while nationally it was 19 percent (Table 3). The proportion of delinquent individuals who were at little of foreclosure was optimistic in North Texas. The metric was less upbeat in Houston.
________________
1 All measurements are calculated using seasonally adjusted data, and percentage changes are calculated month over month, unless stated otherwise.
2 Bond and mortgage interest rates are nonseasonally adjusted. Loan-to-value ratios, debt-to-income ratios, and the credit score component are also nonseasonally adjusted.
Source – Joshua Roberson and Weiling Yan (July 1, 2022)
https://www.recenter.tamu.edu/articles/technical-report/Texas-Housing-Insight