
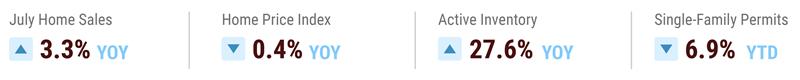
Home sales activity continued to build momentum in July, extending June’s strong rebound with a 3.3 percent year-over-year (YoY) increase. For the first time in 2025, year-to-date (YTD) sales surpassed those of 2024. Forward-looking indicators, including pending sales data, point to sustained momentum into August.
Supply pressures persist. However, the imbalance between inventory and constrained affordability has created favorable pricing conditions for buyers, with many seizing on the shifting market dynamics, contributing to rising sales. Amid the pricing pressures, average home prices in Texas recorded a small YoY decline.
In the post-spring buying season, inventory continues to climb to the cyclical high despite slowing new-listing activity. This means significant inventory pressure going into the fall and winter months. With average days-on-market among active inventory nearing 90 days, many sellers are motivated to close a deal soon.
Inventory levels for low-priced entry-level homes remain notably higher than those in the mid- and upper-tier segments. Since June, while inventory for high-priced homes (above $800,000) has declined following the peak spring and summer buying season, entry-level inventory (below $250,000) has instead seen a more pronounced increase.
On the flip side, elevated inventory in the low-priced entry-level segment is creating greater availability for first-time and modest-income buyers, many of whom are expected to re-enter the market as mortgage rates have declined. This week, the Federal Reserve announced a 25-basis point policy rate cut in response to concerns over a softening labor market and downside risks to employment and economic growth. Anticipation of the cut had already driven mortgage rates sharply lower from their spring peak of 7 percent to a 12-month low in the low 6 percent range. More affordable borrowing costs are expected to draw buyers back into the market.
Home Sales Maintain Upward Momentum, Pushing YTD Activity Into Positive Gains
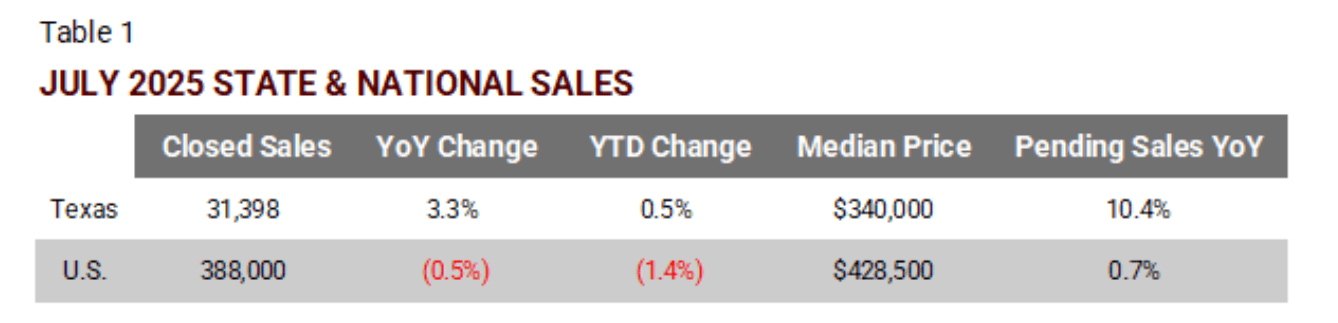
Notes: The sales numbers reflect actual sales, not seasonally adjusted.
Source: Texas REALTORS and National Association of REALTORS data (accessed at Haver Analytics)
Texas recorded 31,398 closed home sales in July—including both new and existing homes—accounting for 8.1 percent of all U.S. home sales that month. YTD, the state’s share stands at 8.6 percent.
- Home sales continue their upward momentum, building on June’s strong surge with a 3.3 percent YoY increase. YTD, home sales are now surpassing 2024 levels. Pending home sales in July surged 10.4 percent YoY, signaling sustained momentum going into the fall.
- Texas’s median home price edged down to $340,000 in July, a small decline from $345,000 in June 2024.
- Texas’ statewide median home price in June reached $345,000, a small YoY increase from $340,000 in June 2024. The Texas Real Estate Research Center’s Home Price Index, which is a repeat sales index and controls for the quality of homes, showed no YoY price change from June 2024.
- Nationally, seasonally unadjusted home sales declined 0.5 percent from July 2024, with YTD sales trailing 2024 levels by 1.4 percent. The median home price of existing single-family homes was $428,200, up slightly from $427,200 YoY.
- (Not shown) The West led the sales weakness, posting a 5.6 percent YoY drop and an 8.8 percent decline YTD. The South saw a more modest 1.7 percent YTD decrease, while the Midwest held steady with no change. The Northeast was the only region to show growth, with YTD sales rising 1.5 percent.
Market Liquidity Remains Constrained
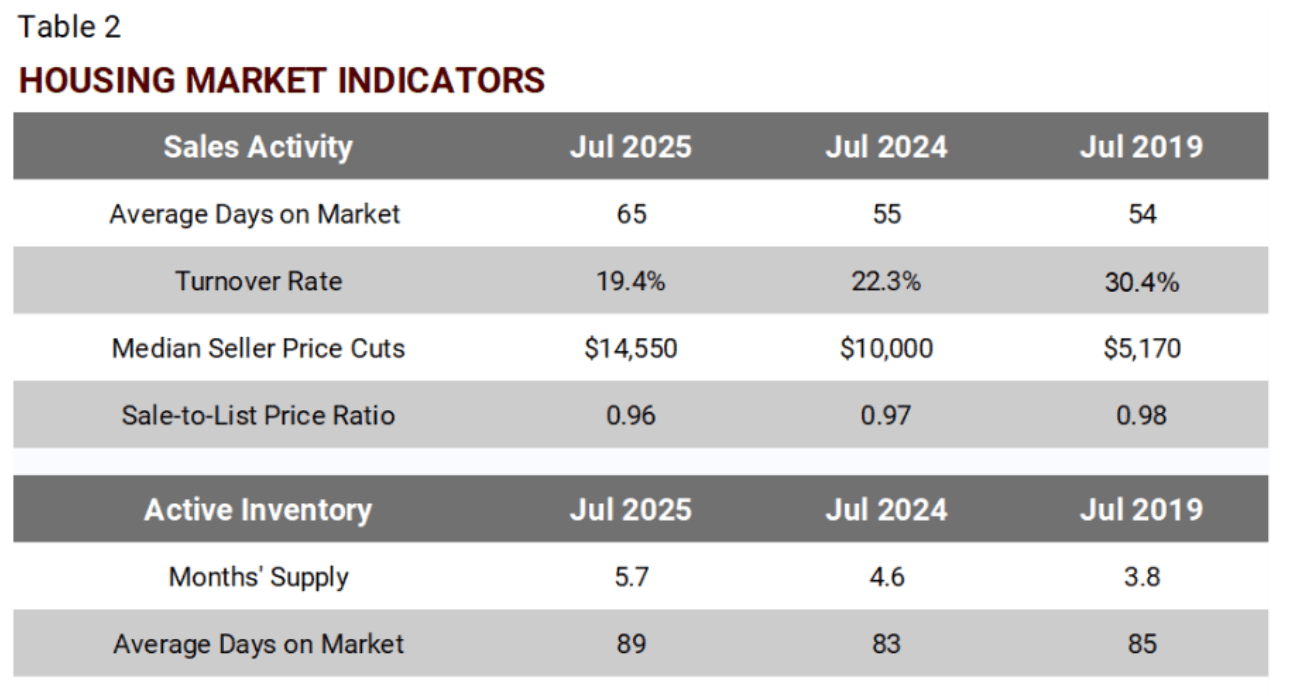
Notes: The turnover rate is calculated as pending sales divided by inventory, where inventory is the average of month-beginning and month-end inventory
Source: Texas Real Estate Research Center analysis of Data Relevance Project and Texas REALTORS data
- The average time on market for homes sold in July was 65 days. This corresponds to an inventory turnover rate of 19.4 percent, a slower pace than a year ago. During the more balanced pre-pandemic period, inventory in July turned over at a healthier pace of 30 percent.
- Amid high mortgage rates and elevated inventory, the median seller price reduction in July intensified and reached $14,550, equating to a 4 percent cut from the original asking price and a sale-to-list ratio of 0.96.
- The July month-end active inventory stood at 5.7-month supply. In Texas, a 3-4-month supply typically (historically) indicates a more stable and balanced market.
- Homes in the active inventory currently average 89 days on the market, significantly longer than the 65-day average for properties that have sold.
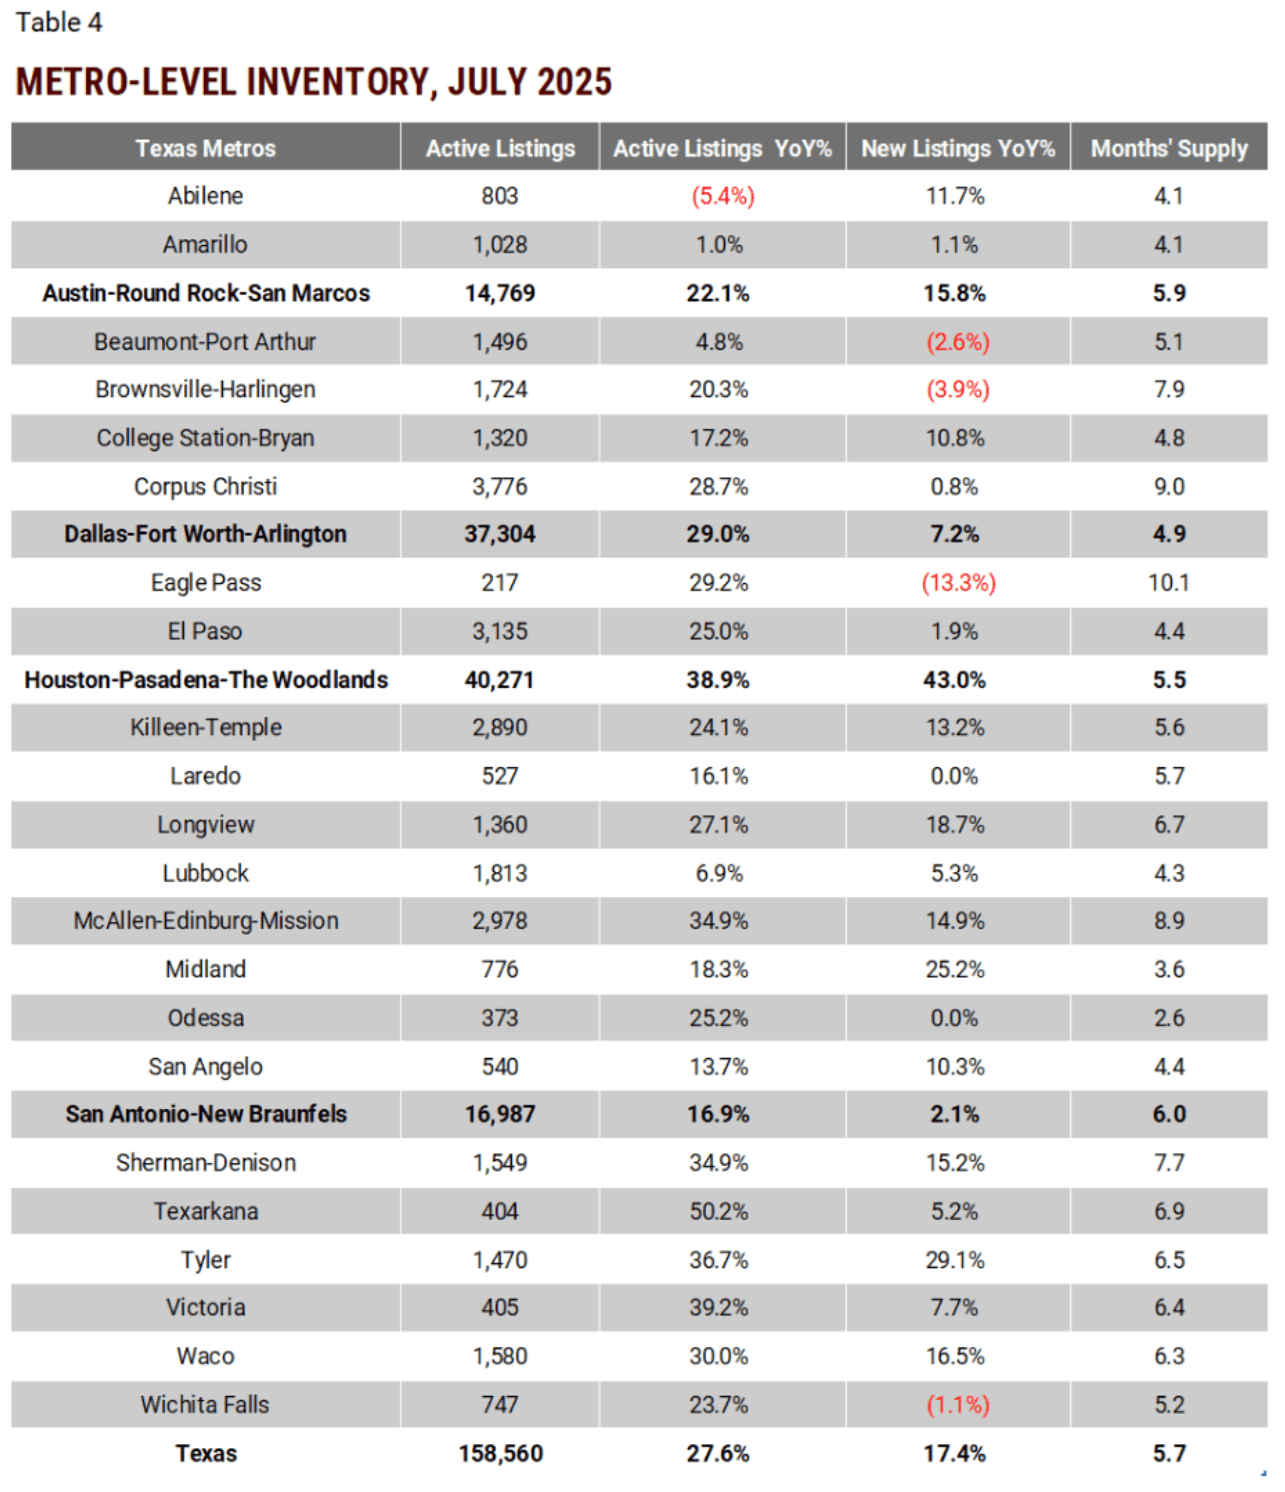
Inventory Climbs Despite Slowing New Listings
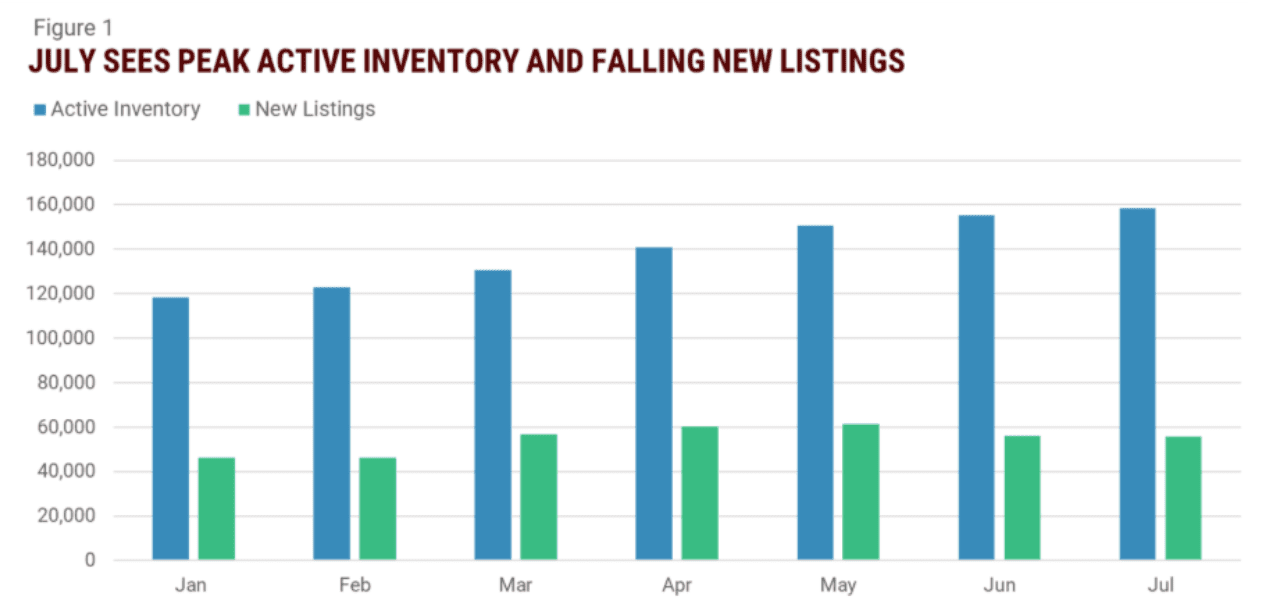
Source: Texas Real Estate Research Center analysis of Data Relevance Project, Texas REALTORS data
- Inventory continued to climb, rising 2.1 percent month-over-month (MoM) from June to July. At the July month end, 158,560 homes were actively listed for sale. Inventory growth YoY stood at 27.6 percent. But as the active summer market is slowing down, the pace of inventory growth began to decelerate.
- April to June are typically the most active months for new listings. This year, new listing activity reached its peak in May. In July, new listings declined 0.6 percent MoM from June
,following a sharper 8.4 percent MoM drop between May and June.
- YTD, new listing activity is up 17.4 percent compared to the same period last year. The surge was likely fueled by sellers responding to shifting market conditions in early spring, including rising trade tensions and growing economic uncertainty.
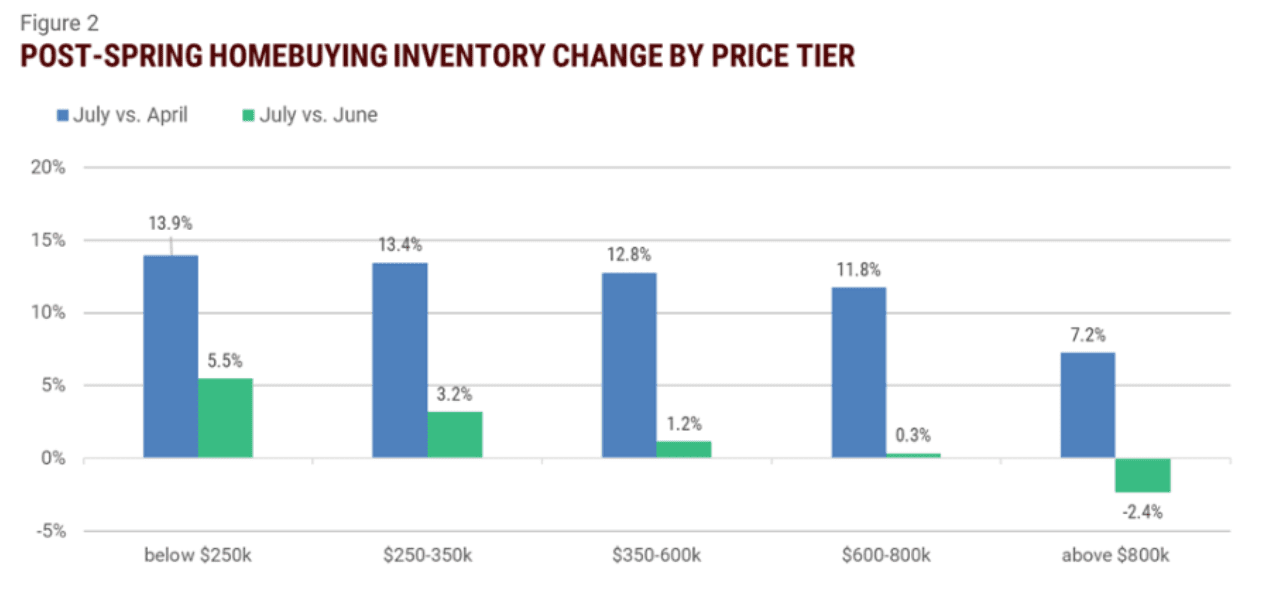
Slow Inventory Drawdown Among Lower-Priced Homes
Source: Texas Real Estate Research Center analysis of Data Relevance Project and Texas REALTORS data
- As highlighted in the , lower-priced entry-level homes saw the fastest inventory growth at the start of the spring season, outpacing mid- and high-tier segments as affordability challenges weigh more heavily on modest-income buyers.
- By July, following the peak spring and summer homebuying months, while higher-priced segments saw inventory contractions, inventory remained more elevated for lower-priced homes.
- The July-end inventory for homes priced below $250,000 increased 13.9 percent from April and 5.5 percent from June. Similarly, July inventory was up 13.4 percent since April and 3.2 percent since June.
- In contrast, the July-end inventory for the highest-priced segment (above $800,000) was up more modestly at 7.2 percent from April and fell 2.4 percent from June’s level.
- Overall, the rises and contractions in post-spring season inventory across different price tiers are indictive of disproportionately weaker demand from first-time and modest-income buyers.
- On the flip side, high inventory among low-priced entry-level homes offers greater availability for first-time and modest-income buyers, many of whom are expected to reenter the market amid declining mortgage rates.
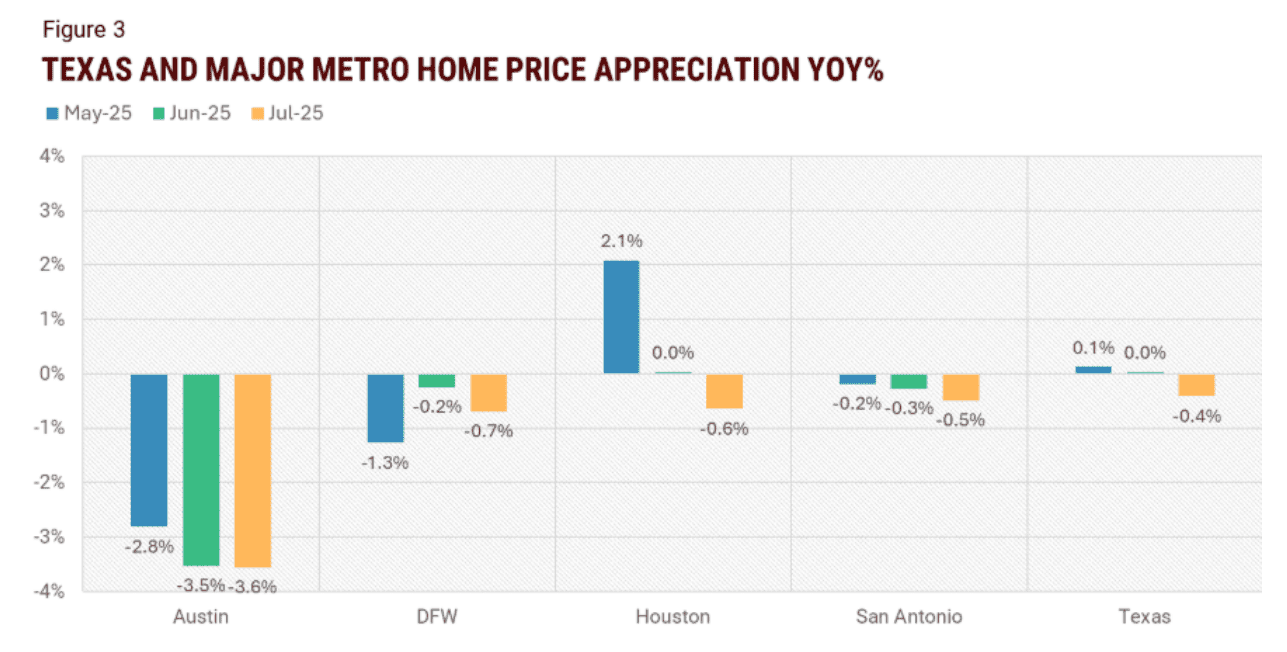
Home Prices Peak, Softening Under Supply Pressure
Source: Texas Real Estate Research Center analysis of Data Relevance Project and Texas REALTORS data
- After two months of minimal movement, statewide home prices edged downward in July, posting a small YoY decline of 0.4 percent.
- In Houston, following a flat YoY performance in June, the city’s average home price declined, registering a modest 0.6 percent annual depreciation. Meanwhile, end-of-July inventory remained 39 percent higher than a year ago while rising 5 percent since June, signaling significant supply pressure.
- Elevated inventory continues to exert downward pressure on home prices in Austin, DFW, and San Antonio. In Austin, July marked the 34th consecutive month of YoY price declines. The city’s home prices are down 18.6 percent from the market peak in May 2022.
- In DFW, July marked the sixth consecutive month of negative YoY price change. YTD, home prices remain in the positive territory, up 2.6 percent since January.
- San Antonio also saw a positive YTD price growth at 1.9 percent, despite four consecutive months of negative YoY price change.
Local Housing Market Indicators
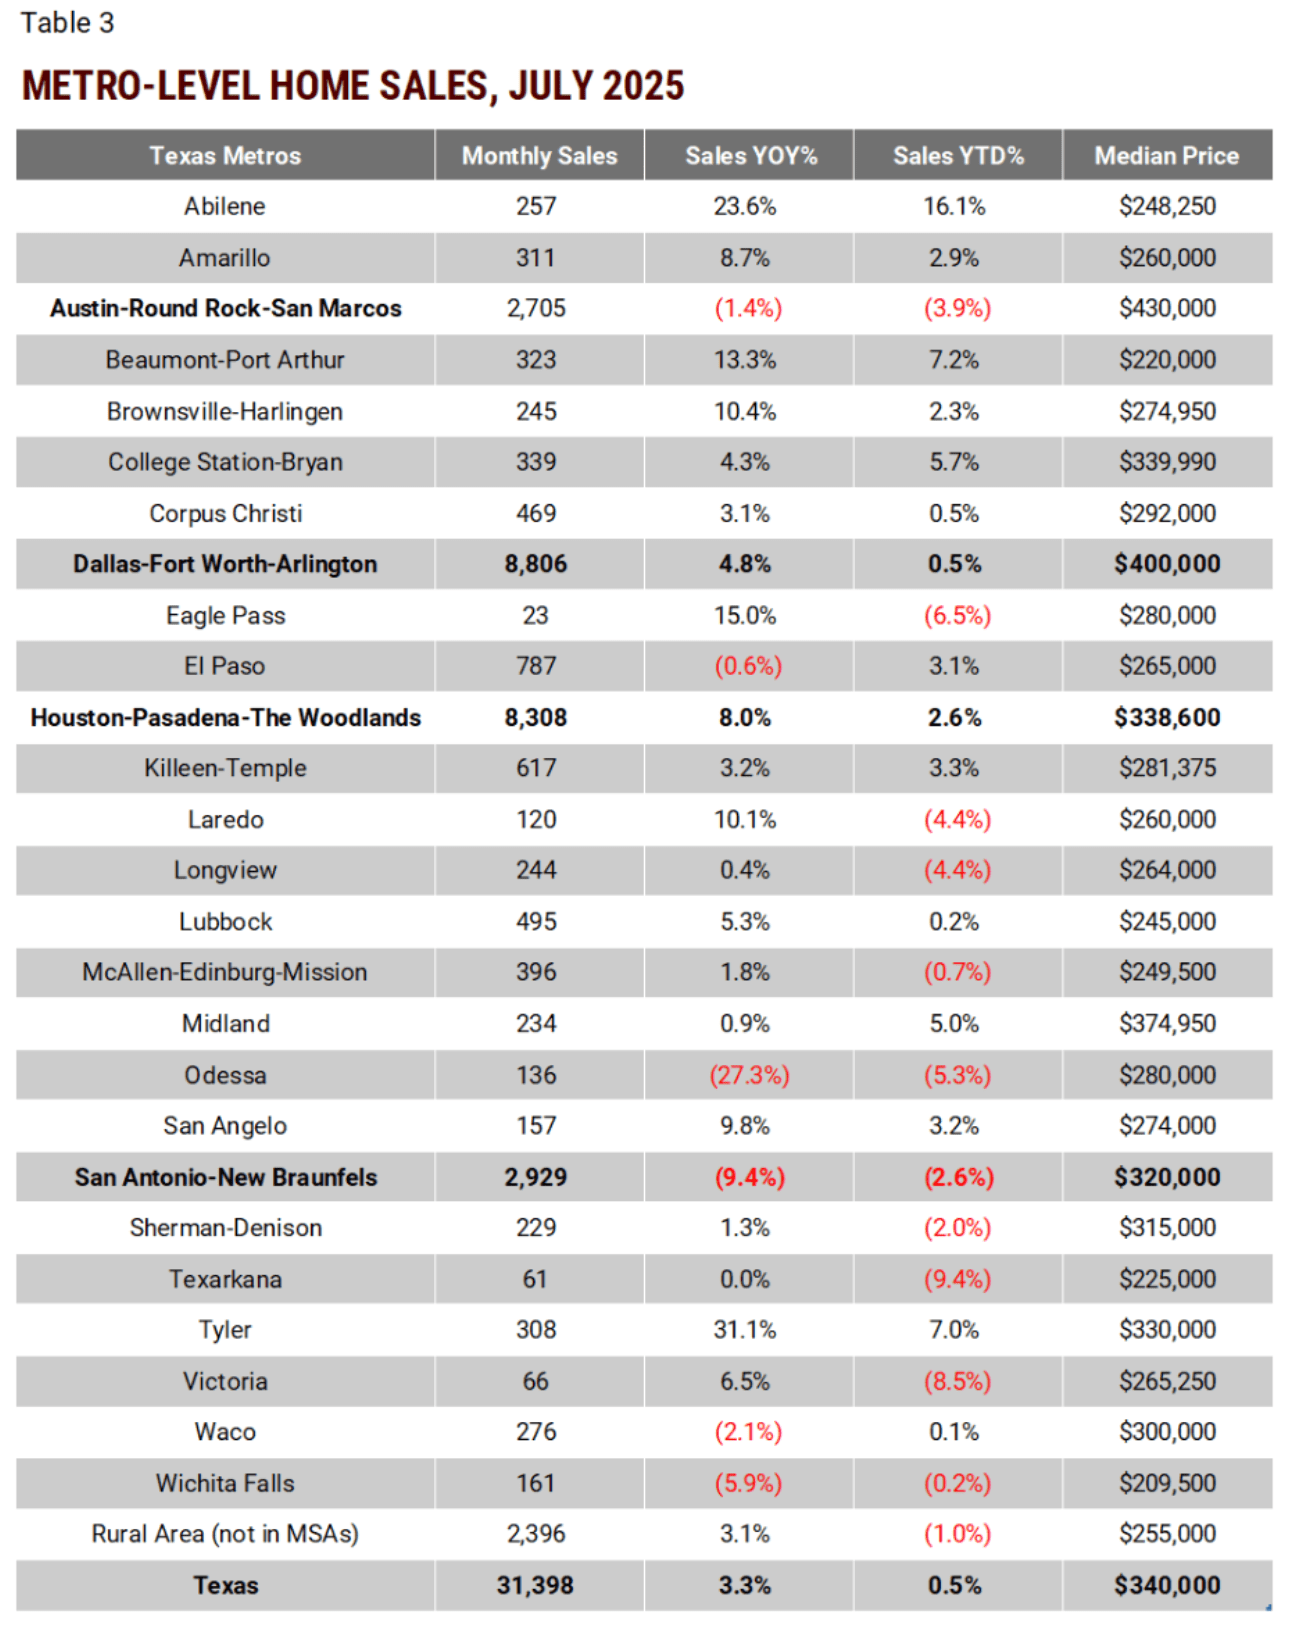
Source: Texas Real Estate Research Center analysis of Data Relevance Project and Texas REALTORS data
Source: Texas Real Estate Research Center analysis of Data Relevance Project and Texas REALTORS data
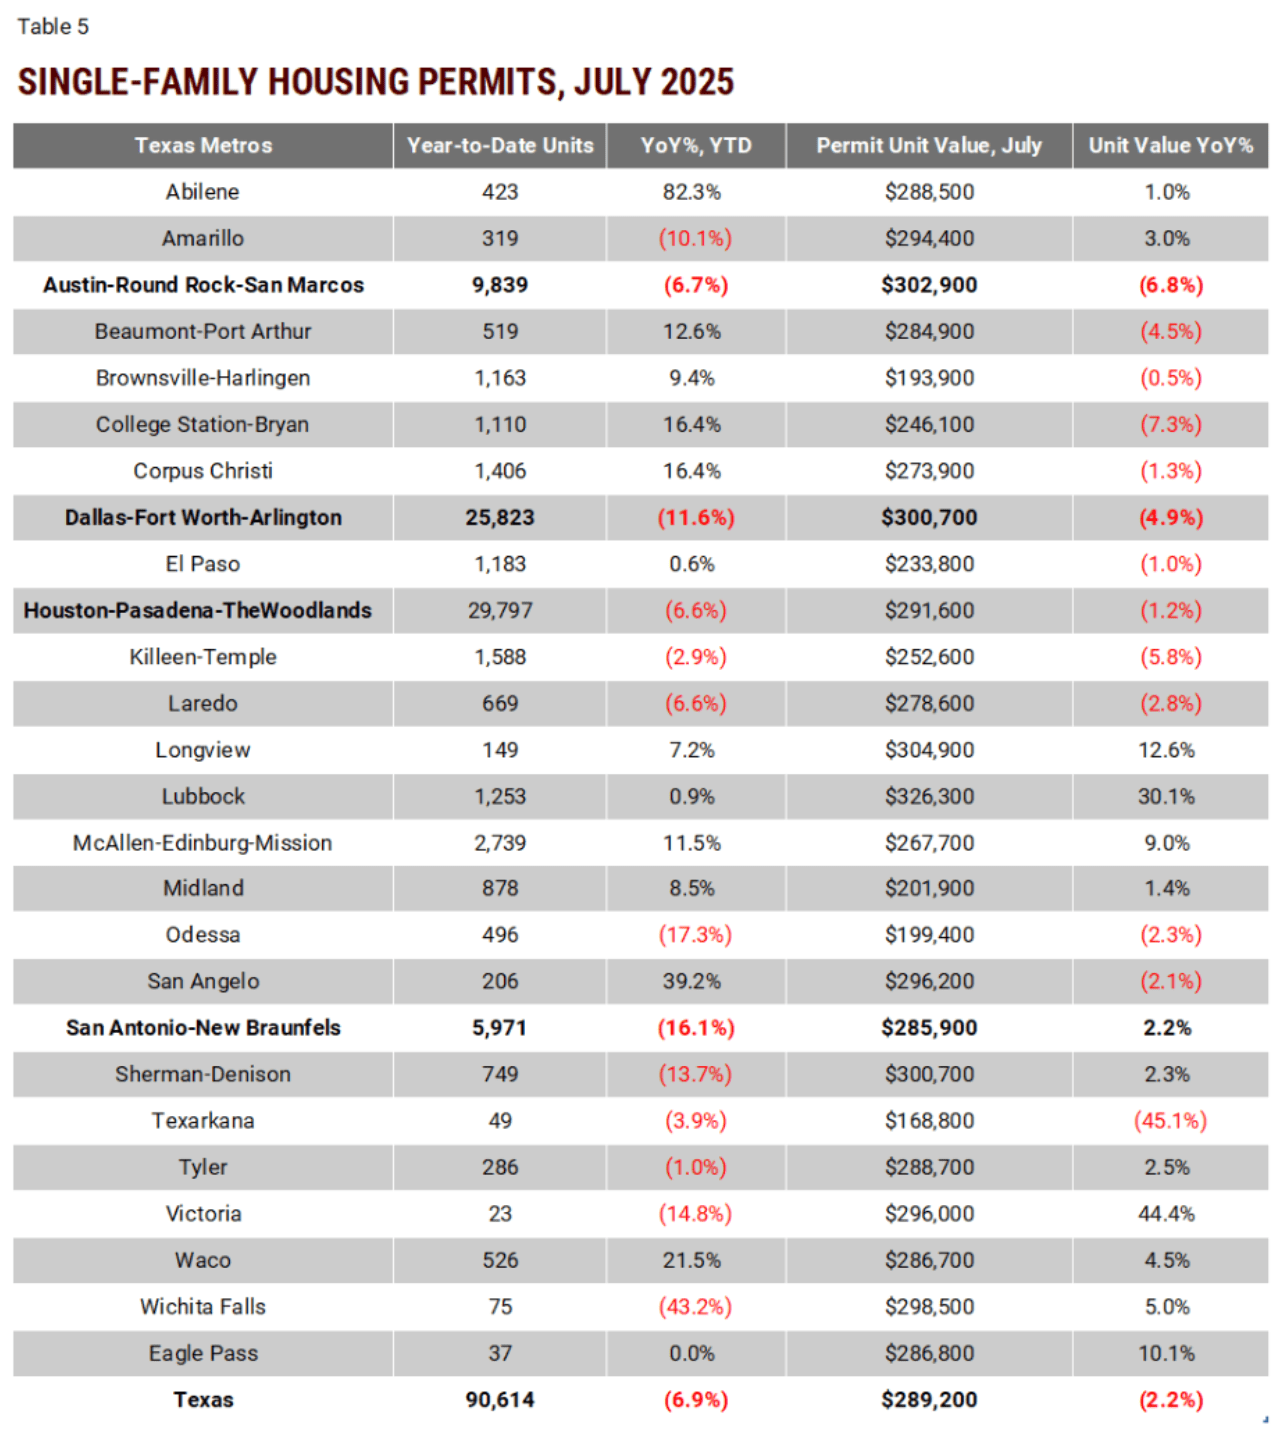
Notes: Permit value is builder estimated construction costs of the residential structure, excluding land acquisition costs.
Source: Survey of New Construction of U.S. Census Bureau
Source: Texas Housing Insight | July 2025 | Texas Real Estate Research Center (by Yanling Mayer)