

The pandemic-induced housing frenzy is easing as the Fed’s aggressive monetary policies directly affect the housing market. Mortgage interest rates rose from 2.84 to 5.22 percent in the past year. Amid these robust rate increases, Texas’ housing market quickly dialed back sales while supplies have gradually accumulated. Despite the slowdown, inventory levels remain below historical levels, and prices are still high. While prices have dipped some in recent months, they still remain considerably high compared with before the pandemic. As of August, Texas’ median price remains 11.4 percent elevated from a year earlier.
Supply1
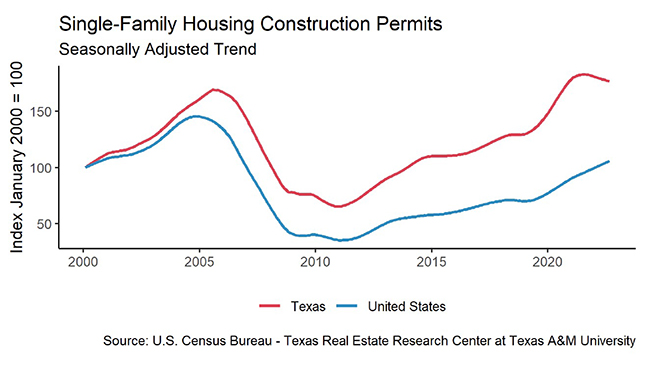
Interest rates continued to increase following more aggressive Federal Reserve intervention. Despite mounting interest rate pressure, Texas’ single-family construction permits recovered 12,500 permits in August, rising 9.3 percent month over month (MOM). Permits rebounded in three of the state’s four largest metros (San Antonio being the exception). Houston (3,700) and Dallas (3,693) had the most permits, while Austin (1,609) and San Antonio (681) followed third and fourth in the state. Meanwhile, Texas’ single-family construction values continued to fall by double digits, tumbling to a two-year low. All major metros reported double-digit negative year-to-date (YTD) growth.
Permits for Texas’ multifamily sector corrected. After July’s abnormally high request of 12,500 construction permits, 9,000 permits were issued in August.
Total overall housing starts in the Southern Census Bureau Region also recovered some in August with 885,000 new starts. However, single-family housing starts, which account for the biggest share of the overall count, remained 100,000 units short of the year-ago average with 530,000. August’s boost could be partially explained by declining input costs such as lumber. The lumber producer price index (PPI) decreased for the third time in a row in August.
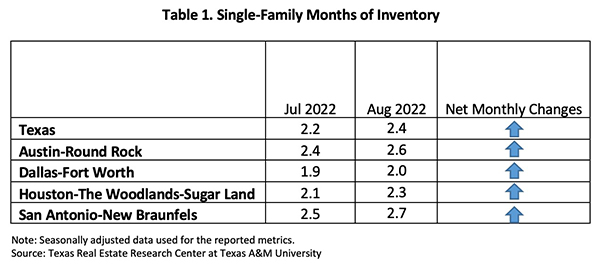
In the existing-home market, the state’s current supply has accumulated throughout the summer. Active listings rose more than 30,000 units since May. This loosening up of housing availability indicates a break-through considering the distinctly low inventories of the past two years. Texas’ housing supply, which had been below two months of inventory (MOI) from November 2020 to June 2022, ticked up to 2.4 months. San Antonio led with 2.7 months, and Dallas remained the tightest with two months (Table 1). The Texas Real Estate Research Center considers six to 6.5 months of inventory a balanced market.
Demand
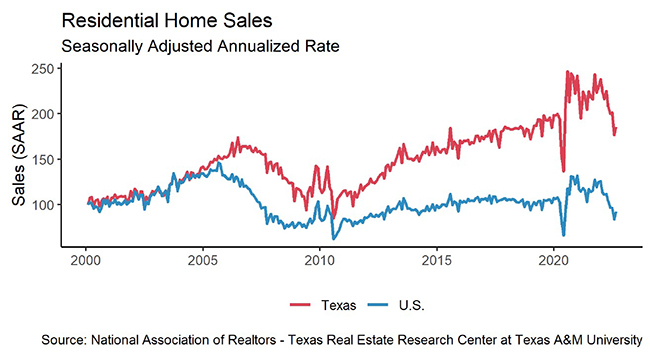
As a result of higher mortgage rates, housing demand has fallen, and homes are sitting on the market longer. Sales improved slightly in August (5 percent MOM) from July’s steep decline, reaching a seasonally adjusted rate of 29,300 sales. Overall home sales have been in freefall since around April. At the current rate, 2022 sales will likely fall short of 2021. According to the Center’s Data Relevance Program, the sales level was down 16.3 percent from a year earlier.
Sales in all major metros remained low as mortgage pressures rattled buyers. Austin and Houston’s closed listings were most affected with a 20 percent year-over-year (YOY) reduction, while DFW and San Antonio pulled back more than 10 percent. Existing-home sales, which make up 80 percent of Texas’ housing market, inched down for the seventh straight month. Texas’ marginal recovery in August was concentrated in the remaining 20 percent of the housing market, where Dallas’ new-construction market had double-digit growth.
Texas’ average days on market (DOM) was 38 days, up from 29 days in March. However, compared with the five-year average of 57 days between 2014 and the early 2020s, the relatively short time suggests a persistent imbalance between sellers’ and buyers’ bargaining-power. Amid slowing sales, Austin’s market reacted most aggressively, doubling the listing time in the past five months, while DFW reacted most moderately.
When days on market are differentiated based on the home market, the existing homes’ DOMs are conspicuously lower than new homes’. This could possibly be due to differing price points as new homes tend to be more expensive than the average existing-home listing. Categorized by price cohorts, homes priced between $300K and $500K had the shortest listing time, taken off list in 34 days.
Prices
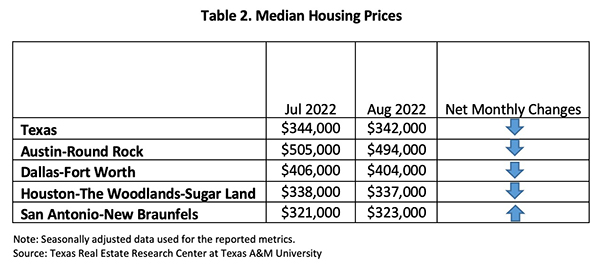
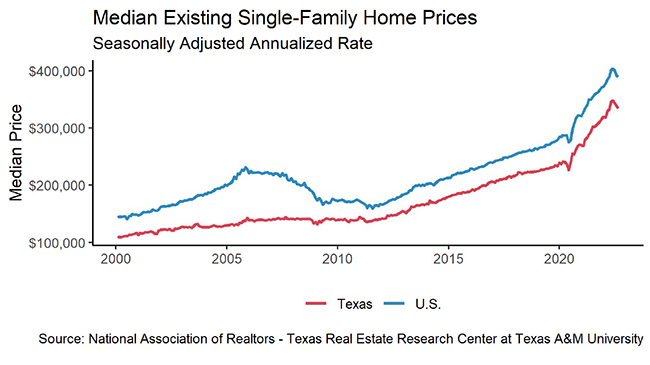
The downward trend for Texas’ median home price continued in August. The state’s seasonally adjusted median price was $342,000, falling more than $10,000 in three months. Prices dropped in all metros except San Antonio, which advanced $2,000 this month (Table 2). Dallas and Houston, Texas’ two largest MSA areas, reported modest declines of $2,000, while Austin took the biggest hit of $11,000. Although housing prices are recently under correction, they remain much elevated from year-ago prices, accelerating 11.4 percent YOY. Even for Austin, the price in this much-affected market was up 5.5 percent YOY.
The Federal Reserve is expected to impose more forceful monetary policies throughout the latter half of this year and likely into the upcoming year to combat inflation. While the ten-year U.S. Treasury bond yield persisted at 2.9 percent2, the two-year counterpart continued to march upward. The spread between the ten-year and the two-year bond yields dipped further in the negative territory, indicating the market’s economic uncertainties about the near future. The Federal Home Loan Mortgage Corporation’s 30-year fixed-rate refrained from June’s high of 5.52 percent and slipped 30 basis points in the past two months. The last time the mortgage rate was over 5 percent was 2009. For more information on the effect of mortgage interest rates on purchase affordability, see “How Higher Interest Rates Affect Homebuying.”
The Texas Repeat Sales Home Price Index, which accounts for compositional price effects, corroborated the trend of depreciation. The index’s monthly decline was the second in a row. Annual appreciation slowed to 12.1 percent YOY in August compared with 20.4 percent YOY growth in January. While Dallas’ home price index remained above the state average, Austin’s YOY rate fell to a single digit, behind Houston’s yearly growth and down to the slowest appreciating metro.
Household Pulse Survey
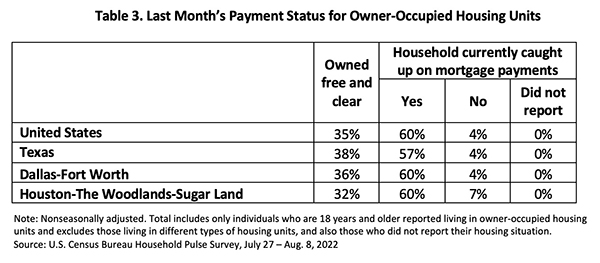
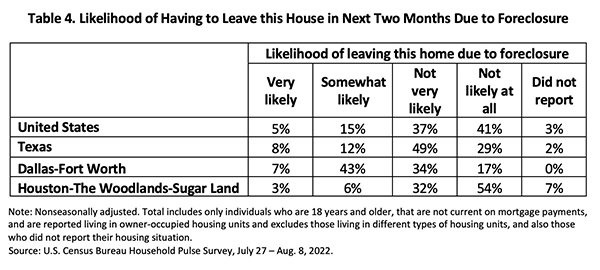
According to the U.S. Census Bureau’s Household Pulse Survey, in spite of rising mortgage rates, the share of Texas homeowners current on their mortgage payments improved 60 basis points in August, and the percentage of people who were behind shrunk to 4 percent (Table 3). This implies that while the overall economy continues to decline, homeowner financial health has so far remained robust. Houston owners’ bolstered ability to pay their mortgage resulted in an increase in the state’s average owned free/clear homes ratio. On the other hand, when asked about future payments, fewer Texas homeowners were confident that they would not face foreclosure. The proportion of delinquent individuals at risk of foreclosure shot up 80 basis points to 8 percent (Table 4).
Source – Joshua Roberson, Weiling Yan, and John Shaunfield (September 29, 2022)
https://www.recenter.tamu.edu/articles/technical-report/Texas-Housing-Insight