

The Texas housing market continues to move through a period of adjustment marked by softening prices under elevated inventory levels. Home values have weakened across major Texas metros, reflecting both abundant supply conditions and ongoing affordability challenges for buyers. Price pressure has eased as lower mortgage rates improve affordability, drawing buyers back into the market and renewing additional seller activity.
October recorded positive but weak year-over-year (YoY) sales growth. It marked the sixth consecutive month of rising sales, keeping year-to-date (YTD) sales activity in positive territory. Pending home sales—a forward-looking indicator—suggest continued momentum in sales through November.
Inventory through October has held steady from month to month even as new listing activity slowed and delisting activity became more common during the fall and winter. Encouraged by declining mortgage rates and expectations of one more rate cut in December, new listing activity rebounded after four consecutive months of month-over-month (MoM) declines.
Mortgage rates, still sitting in the low 6 percent range, barely budged following December’s 25 basis point rate cut. Looking ahead, with inflation stuck near 3 percent and lingering uncertainty on tariff-related price pressures, there is little reason to expect a meaningful drop in mortgage rates. Rates are likely to remain stubbornly elevated until inflation risks are truly behind us.
Meanwhile, the November jobs report offered a mixed read on the economy: October’s figures were revised downward, yet November delivered better-than-expected job gains even as the unemployment rate edged up to 4.6 percent. Job and income security clearly remain fundamental to buyer demand and the housing market’s trajectory in the months ahead.
Sales Post Slight Increase, Keeping YTD Growth Positive
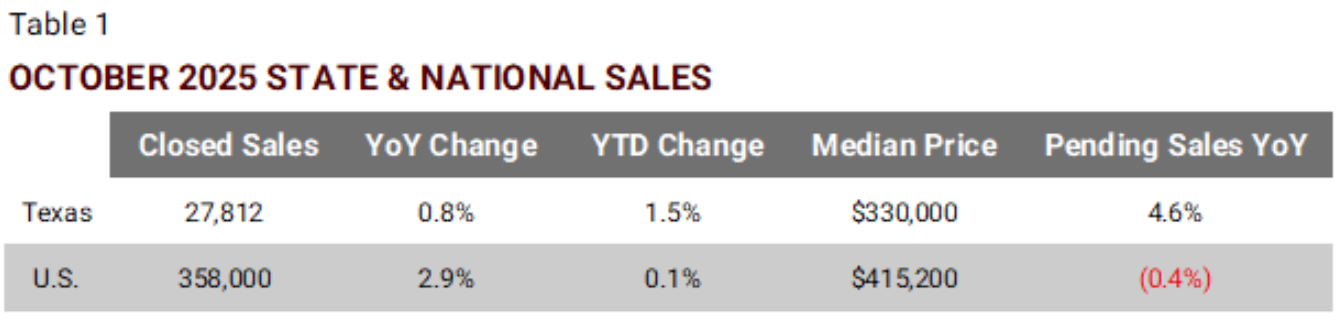
Notes: The sales numbers reflect actual sales, not seasonally adjusted.
Source: Texas REALTORS and National Association of REALTORS data (accessed at Haver Analytics)
- October marked the sixth straight month of rising YoY sales, up 0.8 percent from a year ago. YTD, home sales grew 1.5 percent.
- Pending home sales were up 4.6 percent YoY, signaling sustained momentum through November. October’s median home prices held steady at $330,000 MoM but were below last year’s level of $335,000.
- Nationally, seasonally unadjusted home sales rose a solid 2.9 percent, with the Northeast, Midwest, and South posting gains of 4.6 percent, 3.5 percent, and 4 percent, respectively. These increases pushed YTD sales slightly into positive territory.
- The national median home price of existing single-family homes reached $415,200, a modest increase from $406,800 a year earlier.
Monthly Market Snapshot: October Sales and Inventory Trends
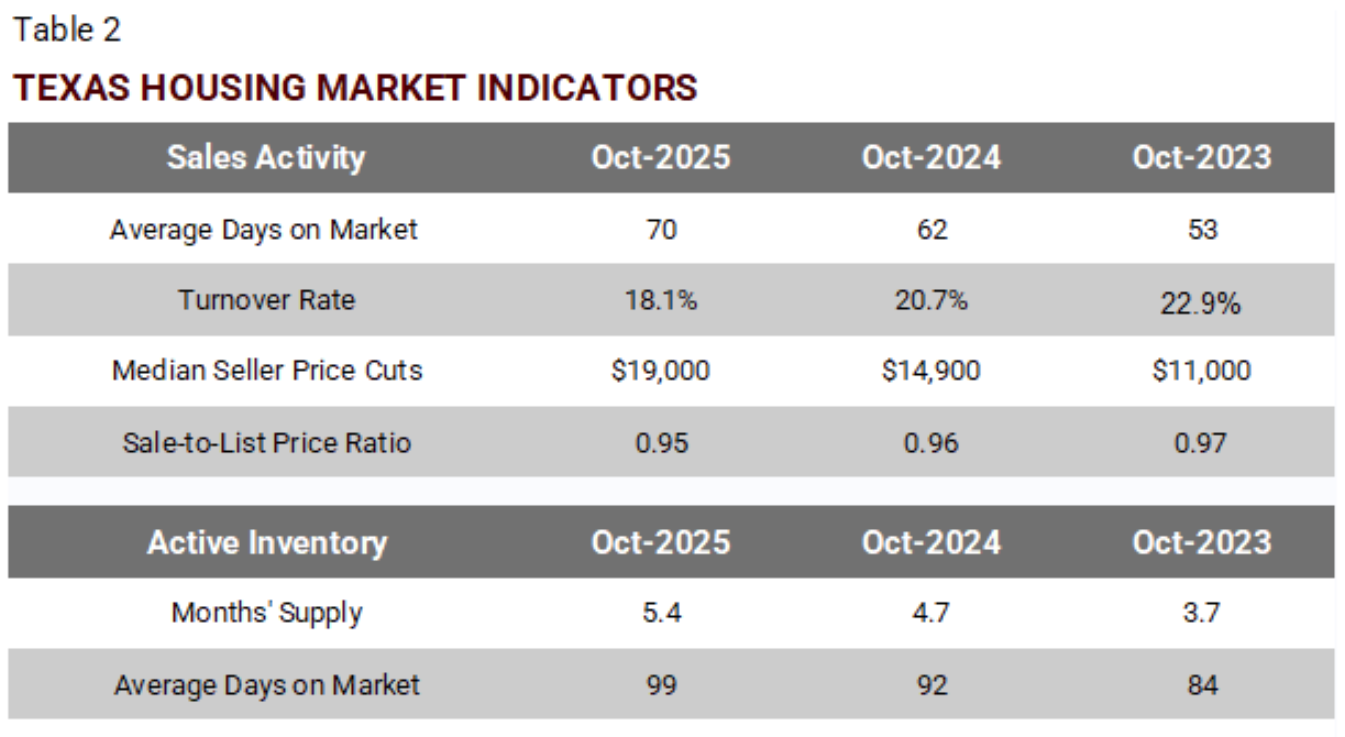
Notes: The turnover rate is calculated as pending sales divided by inventory, where inventory is the average of month-beginning and month-end inventory
Source: Texas Real Estate Research Center analysis of Data Relevance Project and Texas REALTORS data
- In October, homes sold averaged 70 days on the market, resulting in an inventory turnover rate of 18.1 percent, down from 20.7 percent a year earlier and 22.9 percent in 2023.
- Sellers continued to sweeten offers amid elevated inventory pressure. In October, the median price cut reached $19,000—about a 5 percent reduction from the original asking price, resulting in a sale-to-list ratio of 0.95.
- As of October, active inventory is at a 5.4-month supply, rising from 4.7 months a year earlier. In Texas, a three- to four-month supply is generally considered indicative of a more stable and balanced market.
- Average days-on-market (DOM) for unsold inventory climbed to 99 days, sitting on the market roughly a month longer than sold homes, which averaged 70 days.
Active Inventory Holds Steady, New Listing Activity Bounces Back
During the fall and winter months, active inventory typically declines as new listing activity slows and delisting activity becomes more common, with sellers pulling homes that have sat on the market for extended periods.
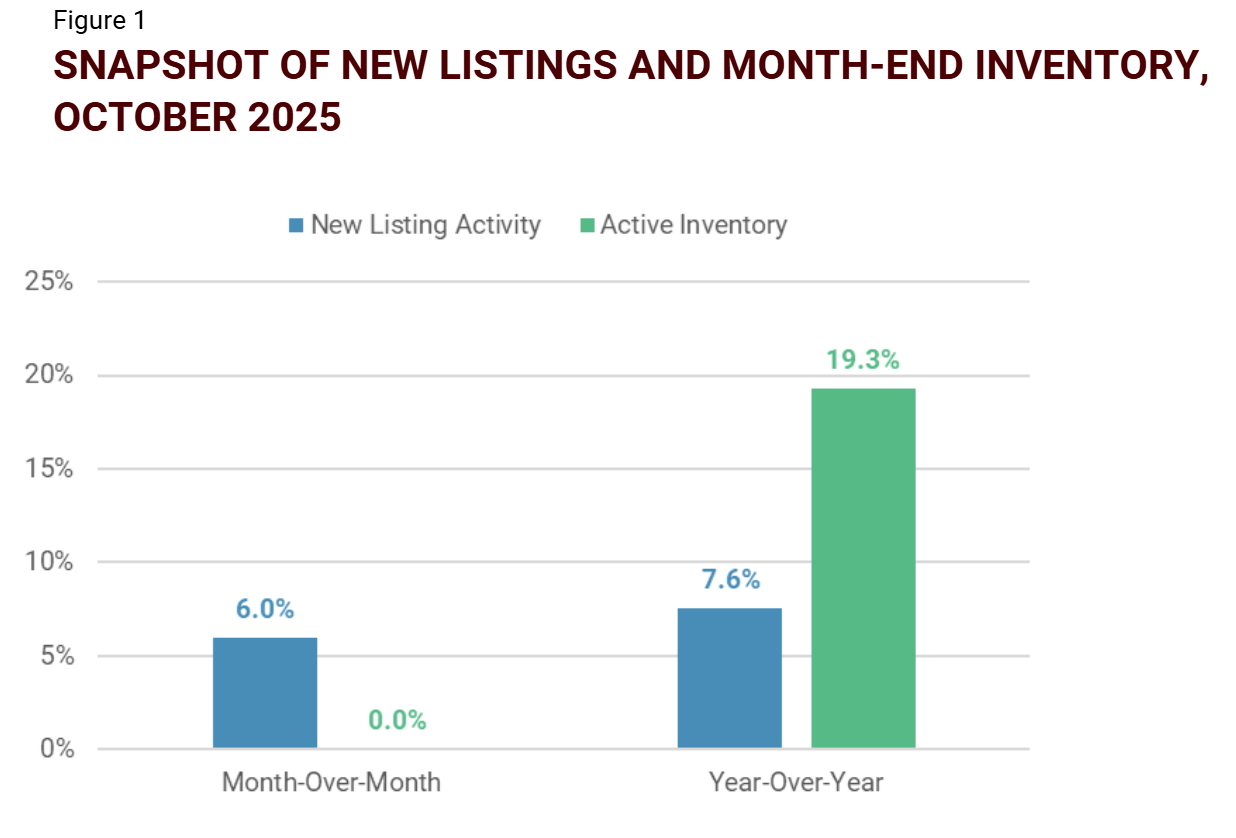
Source: Texas Real Estate Research Center analysis of Data Relevance Project, Texas REALTORS data
- After four consecutive MoM declines since June, new listing activity rebounded, up 6 percent in October, with sellers likely encouraged by declining mortgage rates and expectations of further rate cuts.
- The pace of new listing activity has slowed sharply YOY compared to the stronger activity seen in the spring and summer.
- Active inventory was unchanged from the prior month but stood 19.3 percent higher than a year ago at 151,775. The pace of inventory growth has levelled off, though it remains elevated YoY.
Home Price Declines Persist
Under persistent supply pressure, Texas home prices continue to weaken broadly. October recorded the fourth consecutive month of negative YoY price change, led by Austin and Dallas-Plano-Irving metropolitan division.

Source: Texas Real Estate Research Center analysis of Data Relevance Project and Texas REALTORS data
- Statewide home prices declined 0.3 percent YoY, with the pace of price softening eased modestly since September. This easing in price declines was evident across the major metros.
- Home prices in Austin continue to trend downward, averaging 2.3 percent below year-ago levels. However, the city’s October median sales price of $437,500 was slightly above the $430,000 recorded a year ago, likely reflecting shifts in the mix of homes sold.
- Price declines in the DFW market have been largely concentrated in the Dallas-Plano-Irving metropolitan division. In contrast, prices in the more affordable Fort Worth-Arlington-Grapevine area remained relatively stable through October, even posting a slight overall increase.
- Prices in Houston and San Antonio continue to face downward pressure from elevated inventory levels. In October, prices fell 0.2 percent and 0.4 percent, respectively, following sharper declines of 1.1 percent and 1.7 percent earlier.
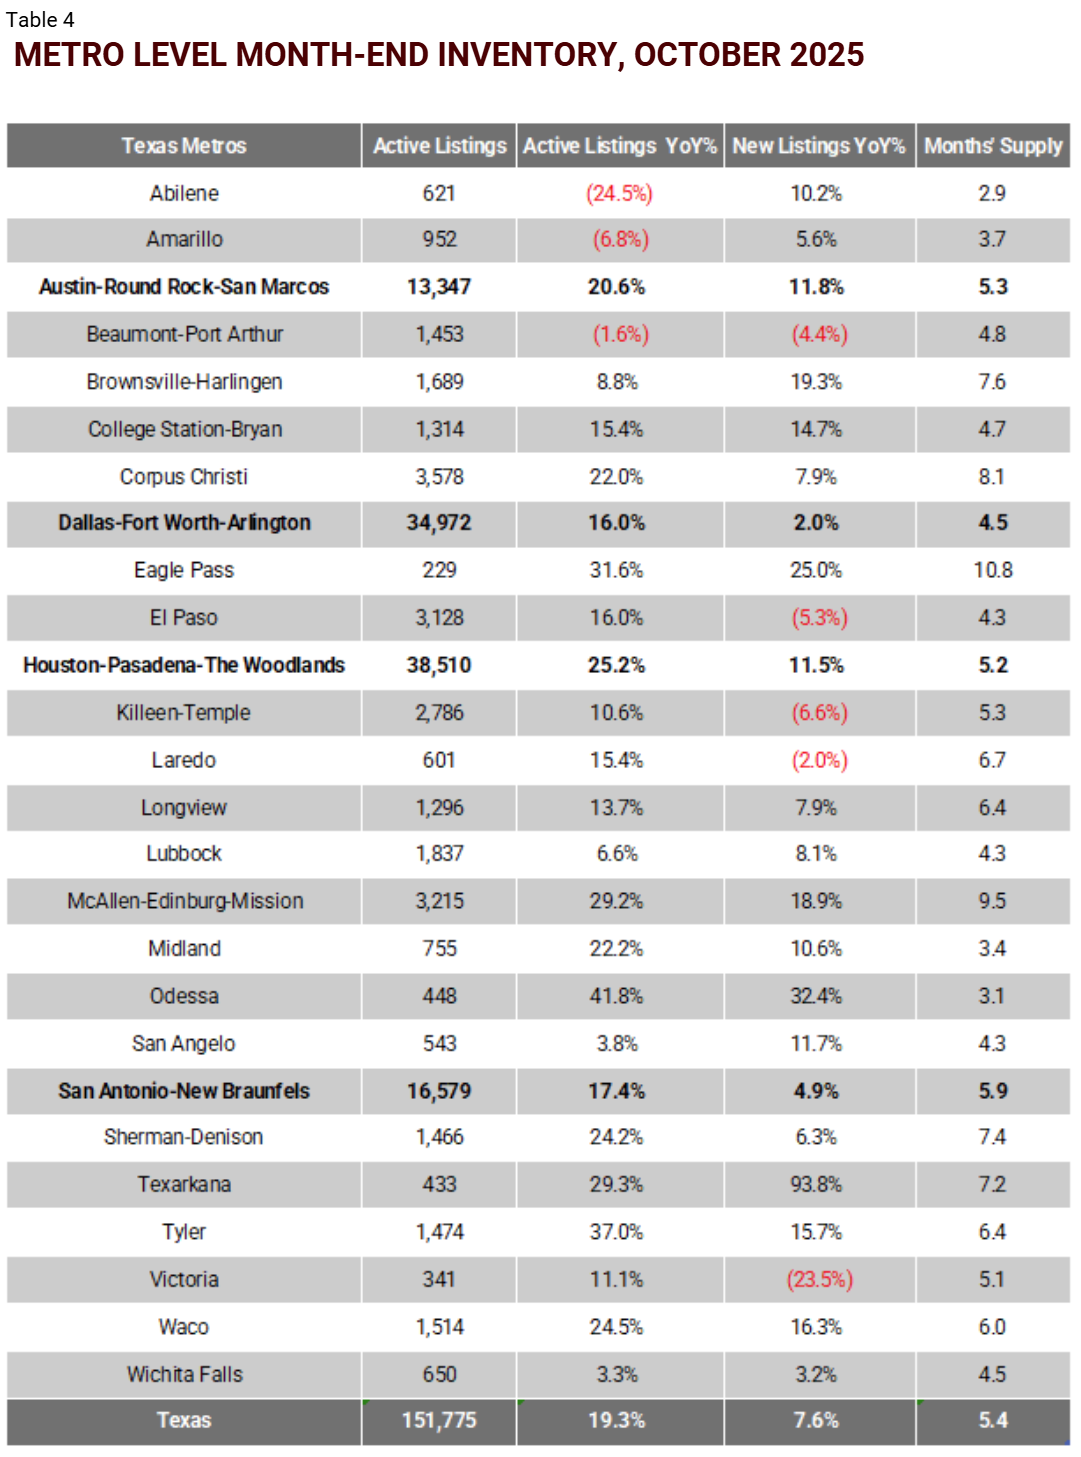
Local Housing Market Indicators

Source: Texas Real Estate Research Center analysis of Data Relevance Project and Texas REALTORS data
Source: Texas Real Estate Research Center analysis of Data Relevance Project and Texas REALTORS data
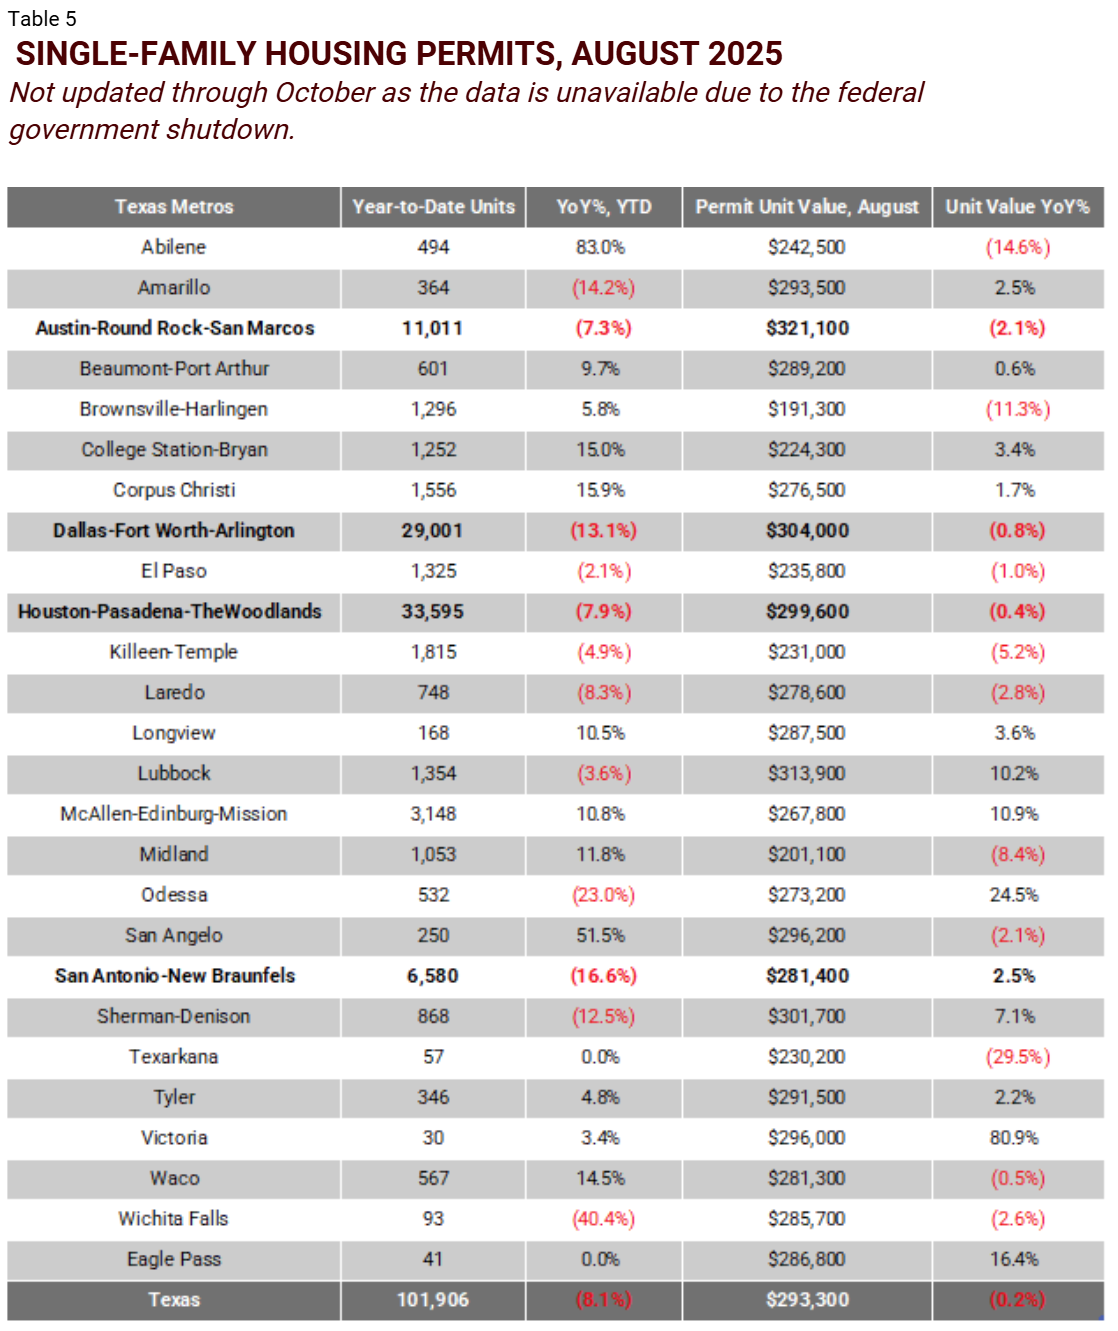
Notes: Permit value is builder estimated construction costs of the residential structure, not including land acquisition costs.
Source: Survey of New Construction of U.S. Census Bureau
Source: Texas Housing Insight | October 2025 | Texas Real Estate Research Center (by Yanling Mayer)