
Total Texas housing sales rose 17.1 percent in July, exceeding pre-pandemic levels with a record-breaking 36,165 sales amid historically low interest rates and steady demand. Supply-side activity bounced back with large increases in building permits and housing starts. Inventory levels, however, continued to trend downward, falling to an all-time low of 2.6 months. Strong demand and a dwindling number of listings contributed to accelerated home-price appreciation, but the pace ran below the seven-year averages in Texas’ major Metropolitan Statistical Areas (MSAs), except in Austin. Although the Real Estate Center’s single-family housing sales projection suggests activity took a step back in August from July’s high, the outlook remains overall positive.
Supply1
The Texas Residential Construction Cycle (Coincident) Index, which measures current construction levels, increased to its highest level this year as industry employment ticked up. Moreover, the Residential Construction Leading Index posted an all-time high due to record-low interest rates and rising building permits and housing starts, indicating strong activity in the coming months. The major metros’ leading indexes posted solid gains except for the San Antonio metric, which flattened as multifamily starts slowed.
Single-family construction permits rebounded completely from pandemic-related decreases in March and April, accelerating 21.8 percent to a post-crisis high to start the third quarter. Texas remained the national leader, contributing 16 percent of the national total. Houston and Dallas-Fort Worth (DFW) issued 4,952 and 3,750 nonseasonally adjusted permits, respectively, also peak levels since the Great Recession after accounting for seasonality. Permits increased to 2,077 in Austin and 1,002 in San Antonio. Texas’ multifamily sector improved as well, with permits rising 28.2 percent.
Total Texas housing starts continued to recover from coronavirus-related uncertainty, accelerating 39.8 percent to start the second half of the year just 2 percent below the post-Great Recession high reached in February 2020. Single-family private construction values, however, dipped 1.3 percent in July after two monthly increases. Most of the decrease was due to San Antonio’s 18.2 percent decline, offsetting Houston’s third straight improvement. DFW values ticked down, but the metric in Austin made up for a contraction the previous month.
Extended decreases in the supply of active listings and record sales pulled Texas’ months of inventory (MOI) down to an all-time low of 2.6 months. A total MOI of around six months is considered a balanced housing market. Inventory for homes priced less than $300,000 was even more constrained, sliding to less than 2.1 months. The MOI for luxury homes (homes priced more than $500,000) remained higher at 6.7 months despite dropping for the second straight month.
Inventory reached historical lows in all the major MSAs except for Houston, although the metro’s MOI ticked down to 2.8 months, its scarcest level in six years. The metric in Austin fell to 1.5 months while North Texas inventory slid to 2.1 and 1.9 months in Dallas and Fort Worth, respectively. San Antonio’s MOI inched down to 2.5 months.
Demand
Total housing sales reached a record-breaking 36,165 after climbing 17.1 percent in July, although the rate of increase moderated relative to the prior month. For the first time ever, sales for homes priced more than $400,000 accounted for more than 20 percent of total transactions while the share of sales of homes priced less than $200,000 sank to one-fourth.
Every major metro posted a historical number of sales, rebounding fully from sluggish activity earlier this year amid coronavirus concerns. While economic uncertainty is still prevalent, low mortgage rates and stable employment in the income bracket more likely to buy than rent supported the recovery. DFW led with 10,500 sales, but Houston and Austin registered the largest growth in percentage terms, with sales in each area increasing by one-fifth. Sales rose 12.9 percent in San Antonio, where the YTD sum outpaced transactions during the first seven months of last year by 4.3 percent.
Texas’ average days on market (DOM) stabilized at 64 days, suggesting the fluctuations from the economic shutdown in April have weakened. Similarly, upward momentum slowed to a halt at the metropolitan level. Demand was strongest in Fort Worth with a metric of 51 days. The DOM in Houston and San Antonio flattened to 65 and 66 days, respectively. Austin and Dallas’ DOMs posted solid declines, falling below year-ago readings to 54 days each.
During widespread local and federal eviction moratoria, the national and Texas foreclosure inventories fell to 0.7 and 0.5 percent, respectively, in 2Q2020. A recent extension of the Coronavirus Aid, Relief, and Economic Security (CARES) Act’s foreclosure moratorium (which prevents the lender or loan servicer from foreclosing on the home) for federally backed mortgages through the end of 2020 will help keep inventories from rising as much as they would under the previous expiration date of August 31. Under the CARES Act, borrowers have the right of up to 12 months of mortgage forbearance (an agreement to suspend payments without penalties).
Persistent economic uncertainty surrounding the pandemic kept interest rates at historically low levels. The ten-year U.S. Treasury bond yield moved above 0.7 percent2, but the Federal Home Loan Mortgage Corporation’s 30-year fixed-rate reached 3.0 percent for the first time in series history (starting in 1971). Mortgage rates extended a year-and-a-half-long slide within Texas, falling to 3.28 and 3.34 percent for nonGSE and GSE loans, respectively, pushing home-purchase applications up 8.3 percent YTD. Refinance activity slowly normalized after spiking at the onset of the pandemic. (For more information, see Finding a Representative Interest Rate for the Typical Texas Mortgagee.)
In June, there was a decrease in the median loan-to-value ratio (LTV) and debt-to-income ratio (DTI) constituting the “typical” Texas conventional-loan mortgage. Meanwhile, the median credit score shot up to an all-time high. The improved credit profile may reflect tightening lending standards as economic uncertainty looms heading into autumn. In contrast, both the median LTV and DTI of the typical Texas borrower who obtained a loan from a government-sponsored enterprise (GSE) increased for the fourth straight month.
Prices
Amid compositional changes in sales, the Texas median home price surged to $261,600 in July, climbing 9.3 percent YOY. Austin led with the greatest median home price of $347,200, followed by Dallas at $313,500. Houston’s metric surpassed the statewide average at $261,800, while the Fort Worth and San Antonio median prices were slightly lower at $257,200 and $252,300, respectively. The growth rate in median sale price, however, reflects the relative strength of demand for higher-priced homes as the lower-end of the market has been more vulnerable to recent employment shocks.
The Texas Repeat Sales Home Price Index accounts for such compositional effects and provides a better measure of changes in single-family home values. The index suggested more moderate home-price appreciation, rising 4.1 percent annually. Fort Worth’s metric tied the state’s in YOY growth, with the San Antonio index close behind, increasing 4 percent. In Dallas and Houston, the index rose 3.0 and 2.8 percent, respectively. On the other hand, price appreciation in Austin accelerated 7.2 percent, driving the statewide increase.
Single-Family Forecast
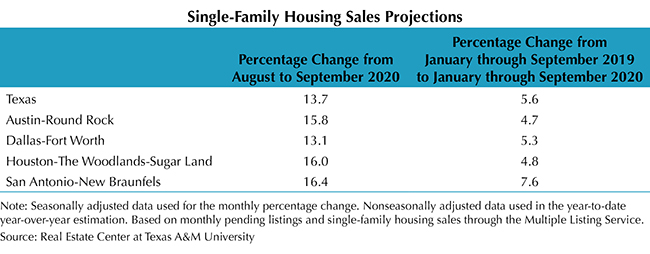
The Real Estate Center projected single-family housing sales using monthly pending listings from the preceding period (see table). Only one month in advance was projected due to the uncertainty surrounding the COVID-19 pandemic and the availability of reliable and timely data. Texas sales are expected to retreat 12.5 percent in August from July as the rush to capitalize on exceptionally low interest rates wanes and dwindling inventory inhibits activity. The downshift is not surprising given the unsustainable pace set in June and July fueled by pent-up demand from the economic shutdown. Nonetheless, overall monthly sales hover at high levels while the YTD sum through August 2020 is predicted to be greater than the sum of single-family sales in the first eight months of 2019. The estimated decline in the number of transactions from July to August 2020 is expected to be steepest in Houston, with sales projected to fall 16.4 percent. Dallas and San Antonio single-family sales are projected to decrease around 13 percent each, while Austin’s metric is projected to drop just 8.3 percent. Despite the slowdown, Texas’ housing market remains a pillar of the state’s economic recovery.
________________
1 All measurements are calculated using seasonally adjusted data, and percentage changes are calculated month over month, unless stated otherwise.
2 Bond and mortgage interest rates are nonseasonally adjusted.
Source – James P. Gaines, Luis B. Torres, Wesley Miller, Paige Silva, and Griffin Carter (September 14, 2020)
https://www.recenter.tamu.edu/articles/technical-report/Texas-Housing-Insight