Please note this review does not account for the impacts of the COVID-19 outbreak but reflects the market through March 2020.
With half the month affected by the domestic coronavirus outbreak, total Texas housing sales decreased 4 percent in March, but still resulted in moderate first quarter growth. This decline does not bode well for second quarter home sales, when shelter-in-place and stay-at-home orders were implemented, increasing the reluctance of potential buyers and sellers to visit and show homes for sale. Supply-side activity decelerated amid uncertain economic conditions, but average days on market indicated steady demand. Median home-price appreciation remained stable, corroborated by the Texas Repeat Sales Home Price Index. The coronavirus outbreak is the greatest threat to the Texas housing market since the 1986-90 recession via disruptions to buyer and seller confidence, the negative income shock, and wariness of visiting and showing homes for sale. Preliminary effects showed in the March data with more significant impacts almost certain to appear during the second quarter of the year.
Supply*
Contemporaneous and anticipated construction levels took a step back in March after reaching post-recessionary highs the prior month, signaling a coronavirus-induced downturn. The Texas Residential Construction Cycle (Coincident) Index, which measures current construction levels, declined due to industry wage and employment cuts. Decreased building permits and housing starts offset falling interest rates, pulling the Residential Construction Leading Index down.
According to Metrostudy, activity at the earliest stage of the construction cycle cooled as the number of new vacant developed lots (VDLs) in the Texas Urban Triangle declined 5.4 percent quarter over quarter (QOQ) after reaching a post-recessionary high in 3Q2019. Dallas-Fort Worth (DFW) and San Antonio VDLs fell for the second straight quarter, most notably in the $300,000-$400,000 price range. On the other hand, Austin’s VDLs exceeded its average in 2019 while Houston lot development surged to a record-breaking 10,700 amid accelerated activity in the lowest-priced cohort (homes priced less than $200,000).
Quarterly fluctuations in the major metros’ single-family construction permits reflected movements in VDLs. On a month-over-month basis, issuance slowed across the board, although Texas continued to lead the nation in nonseasonally adjusted permits on both the state and metropolitan levels. Houston and DFW topped the list, issuing 4,116 and 3,506 monthly permits, respectively. Austin ranked fifth after Phoenix and Atlanta with 1,869 permits, while San Antonio permits numbered 966. Meanwhile, Texas’ multifamily permits fell about 5 percent QOQ despite monthly improvements in March.
Total Texas housing starts normalized after skyrocketing the previous month, decelerating to 4.6 percent QOQ growth. In the single-family sector, Metrostudy data confirmed strong supply-side activity in Houston with a post-crisis record 9,000 homes breaking ground in the first quarter. Dallas and San Antonio single-family starts flattened to start the year after reaching post-recessionary highs the previous quarter. In Austin, starts showed signs of normalizing after rapid growth during 2019.
Following solid improvement to start the year, single-family private construction values dropped nearly 6 percent in March to end the quarter with modest growth. San Antonio continued to correct downward after a rapid climb during the second half of 2019. Austin construction values decelerated in 1Q2020, while Houston’s showed signs of flattening. Values in North Texas, however, accelerated 6.4 percent QOQ.
Decreased sales slowed the decline in Texas’ months of inventory (MOI), which settled at 3.2 months. A total MOI around six months is considered a balanced housing market. Inventory for homes priced less than $300,000 (where four-fifths of total sales take place) held at 2.5 months as a sizeable reduction in sales offset a downtick in the supply of active listings. In the luxury home market (comprised of homes priced more than $500,000), the MOI fell below 7 months but remained elevated compared to the lower-priced cohorts.
Movements in inventory levels differed among the major metros. The San Antonio MOI dipped to an all-time low of 2.9 months, while North Texas inventory slid below 2.5 months in Dallas and 2.3 months in Fort Worth. On the other hand, Austin’s metric ticked up above 1.7 months as fluctuations in the metro’s inventory for homes priced under $300,000 mirrored the state’s change. Houston registered broader increases for an overall MOI of 3.7 months with only luxury home inventory shrinking (but still exceeding eight months).
Demand
As COVID-19 concerns affected the showing and visiting of homes for sale, particularly during the last half of the month, total housing sales fell 4 percent in March with decreases in every price cohort. The monthly decline, however, was more palatable than the 10.2 percent national plummet. Moreover, Texas sales increased 2.2 percent QOQ, exceeding the countrywide growth rate of 1.4 percent.
Monthly resale transactions contracted in each of the major metros for a statewide drop of 3.3 percent, but changes in quarterly sales volumes differed. Dallas and San Antonio existing-home sales rose 4.9 and 3.5 percent QOQ, respectively, with the latter maintaining positive momentum. Houston also exhibited an upward trend albeit at a more moderate rate, increasing 1 percent QOQ. In Austin and Fort Worth, quarterly resale volumes fell flat.
In the new-home market, homes priced more than $300,000 accounted for the 2.1 percent QOQ increase in the Texas Urban Triangle. North Texas and Houston new-home sales surged 7.8 and 5.2 percent, respectively, with the latter recording improvement five quarters in a row. Momentum in Central Texas faltered as sales declined 1.5 and 7.2 percent in Austin and San Antonio, respectively, from post-crisis records at year end.
Ahead of the most serious coronavirus impacts, Texas’ homeownership rate rose to its greatest level since 2012 at 64.4 percent in 1Q2020, just one percentage point less than the U.S. rate. On the metropolitan level, all four major metros registered an increase in homeownership. Houston reached a post-recessionary high of 65.5 percent, while the San Antonio metric also exceeded the statewide average with 66.1 percent homeownership. In Dallas and Austin, homeownership was slightly lower at 62.6 and 58.9 percent, respectively. Homeownership rates could suffer as COVID-19 foreclosure-protection policies expire later this year.
Texas’ average days on market (DOM) flattened at 59 days, indicating still-healthy demand. Houston’s and Fort Worth’s DOMs steadied at their yearlong averages of 58 and 44 days, respectively. The San Antonio metric ticked up slightly to 62 days, but the average home sold after only 50 days in Austin and 51 days in Dallas. The downward trends confirmed robust demand despite falling sales.
The domestic coronavirus outbreak and falling oil prices pulled interest rates down in March. The ten-year U.S. Treasury bond yield dropped to 0.9 percent, while the Federal Home Loan Mortgage Corporation’s 30-year fixed-rate remained less than 3.5 percent. While applications to refinance home loans doubled in the first quarter, mortgage applications for home purchases fell 11.3 percent in March amid reduced showing and visiting of houses and an uncertain economic climate. Decreased home purchase mortgage applications may indicate a slowdown in sales in the coming months.
Prices
The Texas median home price rose to $249,000, a 5.8 percent YOY increase. Austin pushed the statewide metric upward, posting double-digit home-price appreciation for the second straight month as the median home price reached $337,200. In San Antonio, the median price accelerated 6.6 percent YOY to $241,000. However, home-price appreciation moderated in North Texas and Houston where the median prices remained below record highs. The Dallas metric hovered at $298,100 as Fort Worth’s and Houston’s declined to $249,000 and $249,400, respectively.
The Texas Repeat Sales Home Price Index, a better measure of changes in single-family home values, provides insight into how Texas home prices evolve. The index indicated more moderate annual home price appreciation of 3.8 percent, but the rate of change steadied, similar to the median home price. The same phenomenon was observed on the metropolitan level (growth rates for each metro’s median home price exceeded its respective index, but the pace trended in the same direction). Austin’s index maintained a rapid clip, rising 5.9 percent YOY. The Dallas and Houston indices also picked up, increasing 2.5 and 3.0 percent, respectively. Growth in Fort Worth’s and San Antonio’s indexes slowed but remained slightly elevated at 3.6 and 3.4 percent, respectively. Favorable housing affordability relative to other parts of the country supported the Lone Star State’s economic growth in the years following the burst of the housing bubble a decade ago. Texas needs to maintain affordability for the housing market to remain a stalwart in the impending recession and subsequent recovery.
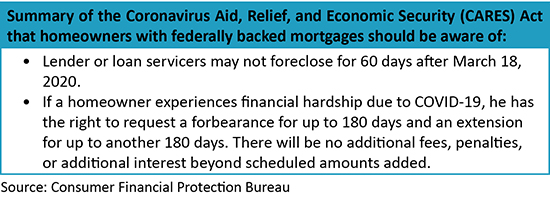
The data reported here reflect only preliminary COVID-19 impacts on the Texas housing market, although the Saudi-Russian oil price war greatly affected the energy commodities and related employment in March. The anticipated events of the next few months and the revised economic expectations for the second half of the year will overshadow recent optimistic conditions. The government stimulus bill signed late in March allowing forbearances on federally backed mortgage loans, moratoriums on evictions, and direct financial payments to Americans earning within an income threshold will aid current homeowners, but is unlikely to spur additional, immediate-home sales.
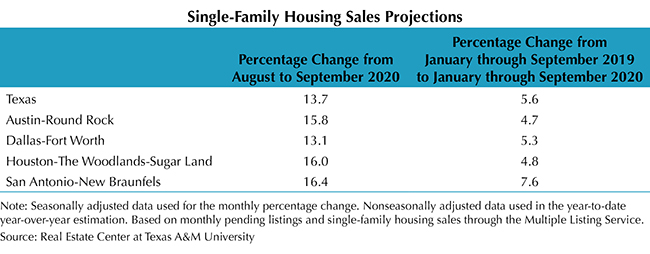
The Real Estate Center forecasted single-family housing sales using monthly pending listings from the preceding period (see table). The Center projected only one month in advance due to the uncertainty surrounding the COVID-19 pandemic and the availability of reliable and timely data. In April, statewide sales are expected to fall by more than three times as much as during March, plummeting 14.4 percent. Austin and North Texas activity may act similarly. Houston and San Antonio single-family sales, however, are predicted to nosedive around 17.4 and 12.2 percent next month after relatively moderate decreases of 3.0 and 3.5 percent, respectively, in March.
________________
* All measurements are calculated using seasonally adjusted data, and percentage changes are calculated month over month, unless stated otherwise.