Texas housing sales remained unchanged in July but trended downward amid limited supply of homes across all price cohorts. Despite decreases in mortgage interest rates, double-digit home-price appreciation chipped away at housing affordability. Elevated levels of demand persisted as homes averaged less than a month on the market. On the supply side, single-family housing permits declined for the second consecutive month, and housing starts decelerated even as lumber prices plummeted due to other material inputs keeping construction costs high. The historically low level of inventory available for sale is the greatest challenge to Texas’ housing market. The state’s diverse and expanding economy, favorable business policies, and steady population growth, however, support a favorable outlook.
Supply1
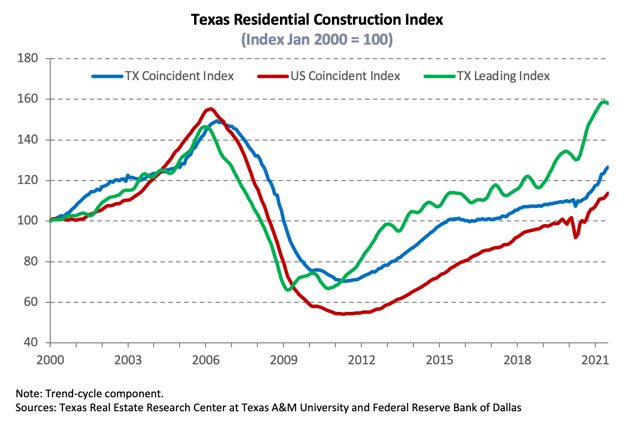
The Texas Residential Construction Cycle (Coincident) Index, which measures current construction activity, inched up amid increased construction values and wages while employment flattened in the industry. The Residential Construction Leading Index (RCLI), normalized as residential starts flattened and weighted building permits decreased; the ten-year real Treasury bill also decreased. Weighted building permits and residential starts increased in Houston and San Antonio; however, the leading index ticked down in the former due to an overall downward trend while the metric increased in the latter. Meanwhile Dallas-Fort Worth (DFW) and Austin indexes flattened as housing starts and building permits decreased in both metros.
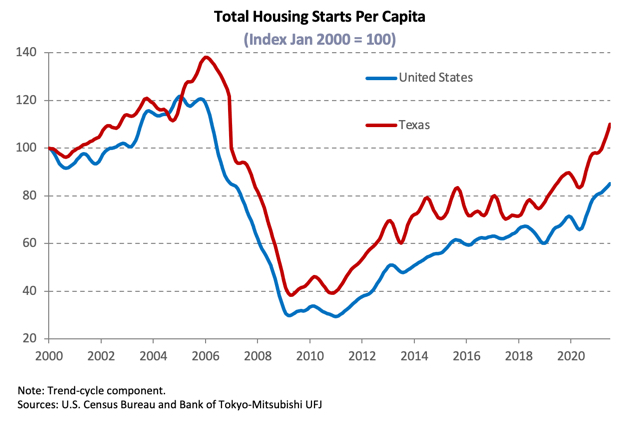
Single-family construction permits declined for the second consecutive month in July, dropping 11 percent. Nevertheless, issuance exceeded its 2006 average and elevated 31.9 percent on a year-to-date (YTD) basis. Houston continued to lead the nation with 4,259 nonseasonally adjusted permits, followed by Dallas-Fort Worth at 4,174. Issuance in Austin decreased to 1,966 permits but remained well above pre-Great Recession levels. San Antonio’s metric remained unchanged, reporting 1,267 permits as the overall trend normalized over the past five months. Similar to single-family permits at the statewide level, monthly permits issued for multifamily properties sank 10.1 percent; year-over-year comparisons, however, were largely positive.
Material inputs remain costly due to supply-chain issues, but lumber prices fell 93.6 percent in July. Consequently, total Texas housing starts decelerated 2.2 percent. Single-family private construction values decreased for the second straight month, declining 8 percent in real terms. Monthly fluctuations in Dallas and San Antonio reflected broader movements in the statewide metric, while Austin and Houston values normalized from record activity.
Housing supply remained at relatively low levels statewide, despite rising for two consecutive months as Texas’ months of inventory (MOI) increased to 1.5 months. Similarly, the MOI for homes priced less than $300,000 trended positively, increasing to 1.1 months. The two-month increase in inventory held across all price cohorts, rising from a trough in May. The MOI for luxury homes (homes priced more than $500,000) grew to 2.4 months but remained down 51 percent from 4.9 months a year ago. A total MOI of around six months is considered a balanced housing market.
The MOI accelerated across the major metros, rebounding after a year-long decline. Houston’s MOI grew to 1.7 months. Dallas and Fort Worth increased supply to 1.2 months, and the MOI expanded in San Antonio and Austin to 1.6 and 0.8 months, respectively.
Demand
Total housing sales extended its negative trend, ticking down 0.3 percent amid reduced activity for homes prices less than $300,000. The sales composition continued to shift toward homes above that price point, accounting for 51 percent of transactions in July and signaling supply constraints at the lower price cohorts. Sales for homes priced less than $200,000 reached an all-time low as homes appreciated across the state.
Luxury home transactions registered double-digit YTD growth in the major Metropolitan Statistical Areas (MSAs) despite total sales trending downward. Home sales fell 1.8 and 1.2 percent in Austin and San Antonio, respectively. In North Texas and Houston, total sales reflected statewide fluctuations as significant decreases in new-home transactions offset incremental sales growth in the resale market.
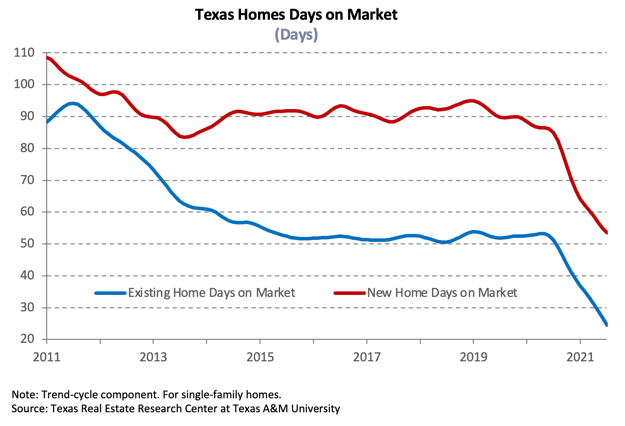
Despite lackluster sales, Texas’ average days on market (DOM) fell to an all-time low of 28 days. Similarly, the DOM fell to record lows in all the major metros, corroborating robust demand as mortgage rates remained favorable to homebuyers. Homes on Austin’s Multiple Listing Service lasted an average of 14 days, while the Dallas and Fort Worth DOM averaged just over three weeks. Homes in Houston and San Antonio sold at a rate closer to the state measure, staying on the market for 31 and 29 days, respectively.
Amid low expectations of additional fiscal and monetary stimulus, economic growth forecasts for the rest of the year cooled as the initial and strongest stage of recovery likely reached its peak, and inflation pressures are believed to be temporary. The ten-year U.S. Treasury bond yield fell to 1.32 percent, and the Federal Home Loan Mortgage Corporation’s 30-year fixed-rate decreased to 2.9 percent. Despite lower rates for borrowers, mortgage applications for home purchases continue to fall, declining 22.1 percent YTD. Mortgage rates remained low for the typical Texas homebuyer in June3, sinking to 3.03 percent for nonGSE loans, while the median interest rate for GSE loans was 3.11 percent. Texas home-purchase applications, however, declined for the fourth consecutive month in July, falling 22.1 percent YTD. Refinance applications improved on a monthly basis yet were still down 18.5 percent over the same period. (For more information, see Finding a Representative Interest Rate for the Typical Texas Mortgagee.)
Prices
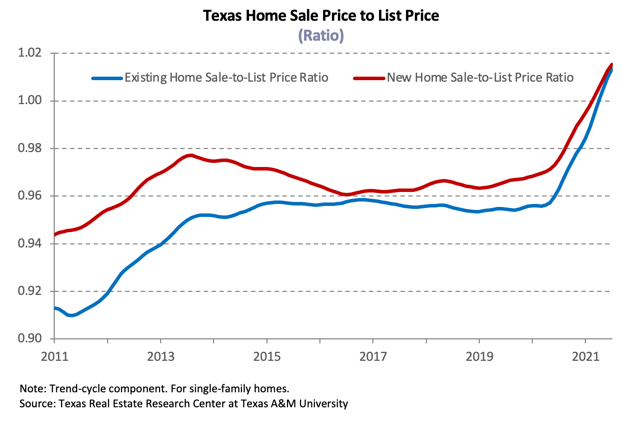
The Texas median home price posted a new record high, decelerating 15.6 percent YOY to $301,900. Year-to-date (YTD) price growth was 15.9 percent in July, considerably more than last year’s YTD average of 7.1 percent. Three of the four major MSAs reached all-time highs in median home prices. The exception was Houston ($299,200) where the metric dipped just $1,600 from last month’s record high. Austin led the state with median price of $470,300, followed by Dallas at $370,600. The median price in Fort Worth ($306,300) and San Antonio ($286,700) rose $2,600 and $10,000, respectively.
The Texas Repeat Sales Home Price Index accounts for compositional effects and provides a better measure of changes in single-family home values. The index corroborated increased home-price appreciation, climbing 17.7 percent YOY. Houston’s metric rose by 14.1 percent, while Dallas and Fort Worth indexes grew 22.9 and 20.9 percent, respectively. Furthermore, the index in Austin soared 23.3 percent and accelerated 18.6 percent in San Antonio. Home-price appreciation unmatched by income improvement will continue to chip away at housing affordability.
Single-Family Forecast
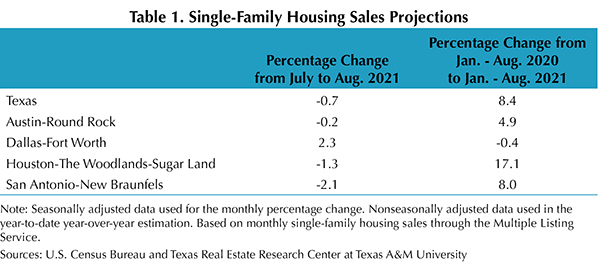
The Texas Real Estate Research Center projected single-family housing sales using monthly pending listings from the preceding period (Table 1). Only one month in advance was projected due to the uncertainty surrounding the COVID-19 pandemic and the availability of reliable and timely data. Texas sales are expected to normalize for the second straight month, dipping 0.7 percent in August.