

Both U.S. and Texas’ construction permits shrank, posting the third decline in the last four months, signaling a future slowdown in national and state homebuilding. Although the projection on Texas’ year-end supplies decelerated, current supplies expanded as new listings and active listings grew. Record-high housing prices and robustly rising mortgage rates deterred many potential buyers. Housing sales lost nearly 5,600 transactions from January’s record level, shrinking 14.5 percent. Price disparities were conspicuous between Austin’s new-home and existing-home markets. Prices for the former were considerably less than the latter as pressure in the existing market intensified.
Supply1
Texas had been the No. 1 state for issuing housing permits since May 2006. In 2022, for every six single-family homebuilding permits issued in the U.S., one permit originated in Texas. Despite the large market share, under the projection of cooling housing markets, both national and Texas permits had a mid-single-digit reduction in May. The Lone Star State retreated 1,000 permits to a seasonally adjusted (SA) monthly rate of 15,000 units. Dallas—the second largest metro on the national list—contracted by 700 permits for the month. Furthermore, multifamily construction permits for Texas’ two-to-four units and five-plus units saw a double-digit reduction. This signals a forthcoming deceleration of housing supplies.
Lumber prices moderated at April’s price level, falling 14.5 percent year-over-year (YOY). Texas’ total housing starts hit a three-decade high last month with 26,915 SA units. The number returned to the year-ago average, hovering around 20,000 SA units this month. As starts for housing projects dipped, Texas’ single-family private construction values fell 10.4 percent month-over-month (MOM) to $3.7 billion, the largest monthly decline since last July. Private construction values shrunk in all metros except Austin as finished projects exited the local construction market faster than new projects entered. Although only falling marginally in May at an annualized rate, Dallas’ single-family construction appears to have lost momentum compared with Houston.
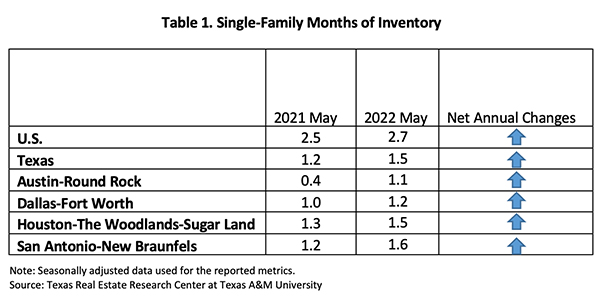
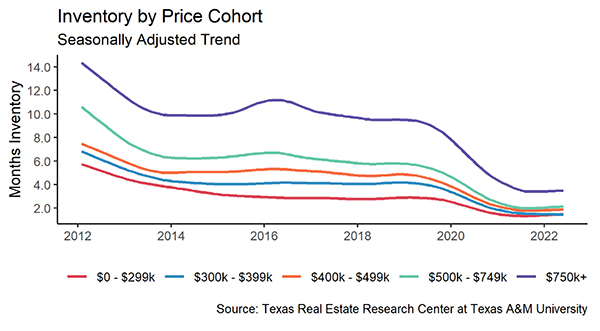
While new listings for existing homes continue to climb, new listings for new construction through the Multiple Listing Services (MLS) grew aggressively at 17.5 percent MOM. Overall, new listings grew for all four major metros and across all price cohorts. Overall active listings reflected the same trend. The rising number of homes ready for sale pulled Texas’ months of inventory (MOI) up to 1.5 months. A six-month MOI is considered a balanced housing market (Table 1). After hovering below the one-month benchmark for 19 consecutive months (since October 2020) and hitting a record low of 13 days in May 2021, Austin’s MOI finally rebounded above 31 days. The rising MOI means the sales pace to the number of available properties is improving. As Texas’ housing market frenzy started to ease, MOIs in the major metros all advanced four to ten days.
Prices
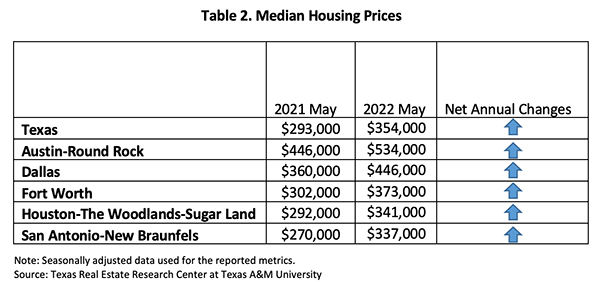
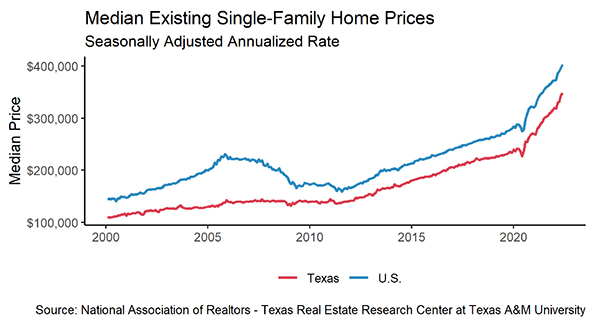
Although housing inventories slowly started to build up, housing prices did not immediately reflect the supply shift. The Texas median home price hit a record high every month starting in January 2021, and the median price rose to a record-breaking $354,000 this month, climbing over 25 percent since the beginning of 2021 (Table 2). All metros hit new price levels. Austin ($534,000) and Dallas ($446,000) were the two most expensive metros in which to own a single-family home. Amid all expanding metros, the median price growth was most notable in Austin where it rose almost 40 percent since January 2021. Data suggest in Austin it may be more affordable to buy a new home than hunt for an existing one. The median price for new homes sold in Austin through the MLS was $437,000, more than $100,000 less than the price of existing homes. In either case, housing in Austin is still out of reach for many potential buyers. Median prices in San Antonio ($337,000), Houston ($341,000), and Fort Worth ($373,000) advanced at a double-digit rate, albeit at a slower rate.
The Federal Reserve is expected to reduce its balance sheet assets and increase the Federal Funds rate several more times by the end of 2022. The ten-year U.S. Treasury bond yield shot up to 2.9 percent2, increasing 15 basis points in one month. The spread difference between the ten-year and the two-year bond yields rebounded 7 basis points to 0.3 percent, yet the spread between the two was still alarmingly low, signaling economic uncertainties and rising risks in the near future. The Federal Home Loan Mortgage Corporation’s 30-year fixed-rate, which for years hovered around 3 percent, elevated to 5.23 percent. The last time the mortgage rate was this high was in 2008. For more information on the effect of mortgage interest rates on purchase affordability, see “How Higher Interest Rates Affect Homebuying.”
The Texas Repeat Sales Home Price Index accounts for compositional price effects and provides a better measure of changes in single-family home values. Texas’ index corroborated substantial and unsustainable home-price appreciation, soaring 18.7 percent YOY. Dallas’ and Fort Worth’s index rose 26.4 and 24.6 percent, respectively, as home-price appreciation shot up in North Texas. Meanwhile, the metrics climbed around 19 percent in a year for the other three metros. Increasing home prices pressure housing affordability, particularly in an economic environment where mortgage rates are hiking and real wage growths are slow.
Demand
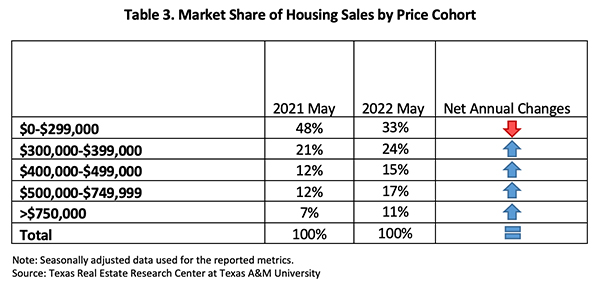
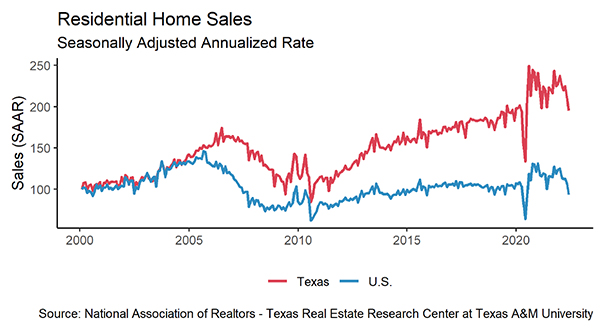
Record home prices and rapidly rising mortgage rates discouraged buyers and cooled the market. According to the MLS, total Texas housing sales peaked in January with nearly 39,000 transactions. Sales have declined each month since then. Total housing sales fell to a seasonally adjusted rate of 33,097, down 1,080 deals from April’s housing transactions. Sales in all major metros declined under the price pressures. Houston closed 9,100 sales, contributing one-third of the state’s total lost transactions. Dallas followed with 5,700 closed deals. Austin, Fort Worth, and San Antonio hovered around 3,000 units, each losing around 100 home transactions. Home appreciation drastically changed the price structure of home purchases. Housing sales slipped by double-digit percent for homes priced below $400,000, while transactions for more expensive homes (greater than $750,000) accelerated for the sixth month.
Texas’ average days on market (DOM) inched down to 28 days, the lowest on record. The historical low DOM indicated buyers’ eagerness to own a house. Austin and North Texas’ home purchases were the most frequent, closing in 20 days. Houston and San Antonio’s DOM inched down to 29 and 30 days, respectively. When days on market were differentiated based on the home market, the new home’s DOMs were notably higher than existing home’s, especially in the Houston area where homes lasted 61 days on average in the former market and 23 days in the latter. The existing-home market is hot.
Homes in the $300K and $400K price cohorts sold fastest, typically leaving the market in 27 days. Homes under $300K had a longer market duration. Many of these homes may be older and not market-ready.
Note: Data collection for Household Pulse Survey was paused in May because the U.S. Census Bureau was making survey revisions. The survey analysis will resume in June.
________________
1 All measurements are calculated using seasonally adjusted data, and percentage changes are calculated month over month, unless stated otherwise.
2 Bond and mortgage interest rates are nonseasonally adjusted. Loan-to-value ratios, debt-to-income ratios, and the credit score component are also nonseasonally adjusted.
Source – Joshua Roberson and Weiling Yan (July 25, 2022)
https://www.recenter.tamu.edu/articles/technical-report/Texas-Housing-Insight