
December 2021 DFW Area Real Estate Stats
https://youtu.be/nr1F7l4gPvM December 2021 stats are here and we have the numbers! Let’s see how the DFW real estate market ending 2021. Active listing fell slightly from
https://youtu.be/nr1F7l4gPvM December 2021 stats are here and we have the numbers! Let’s see how the DFW real estate market ending 2021. Active listing fell slightly from
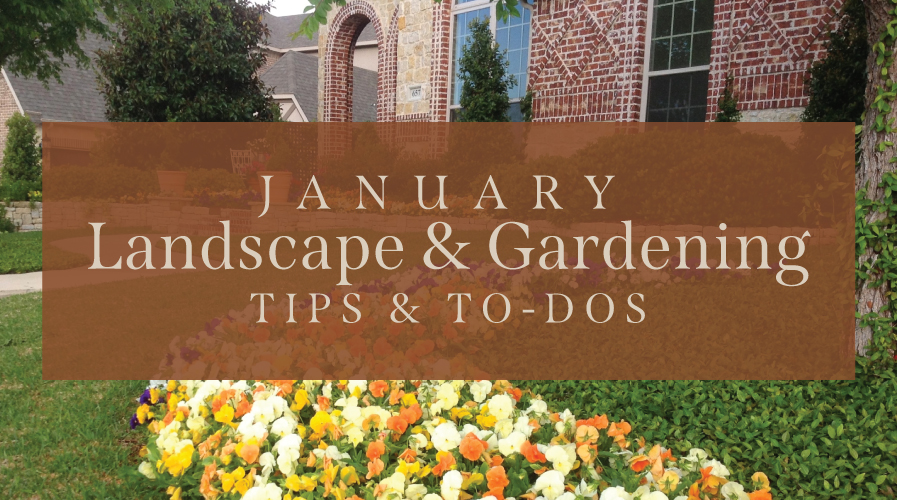
Need help planting a successful garden or landscape? Here are some January planting tips from the Dallas Arboretum horticulture staff and the Dallas County Master
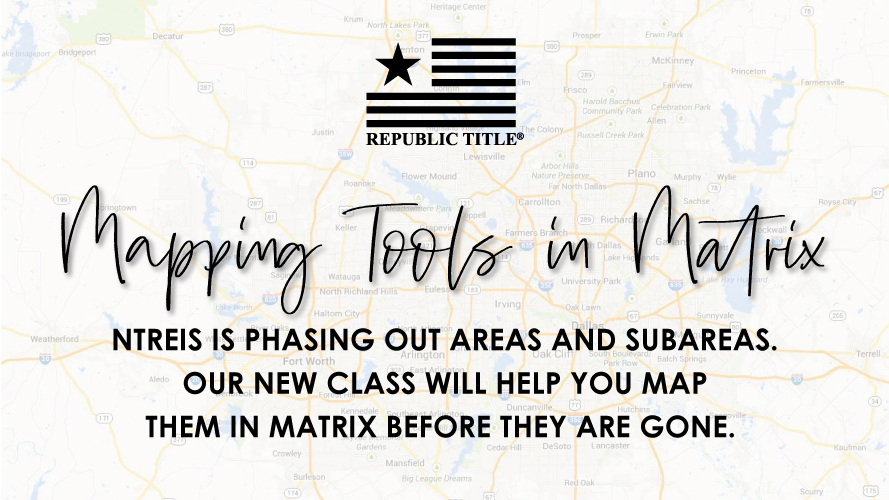
Over the next few months NTREIS users will be experiencing the phasing out of areas and subareas. NTREIS is rebuilding the Matrix system to be

Texas housing sales slowed in October but trended upward amid continued supply constraints. Along with higher mortgage interest rates, double-digit home-price appreciation chipped away at
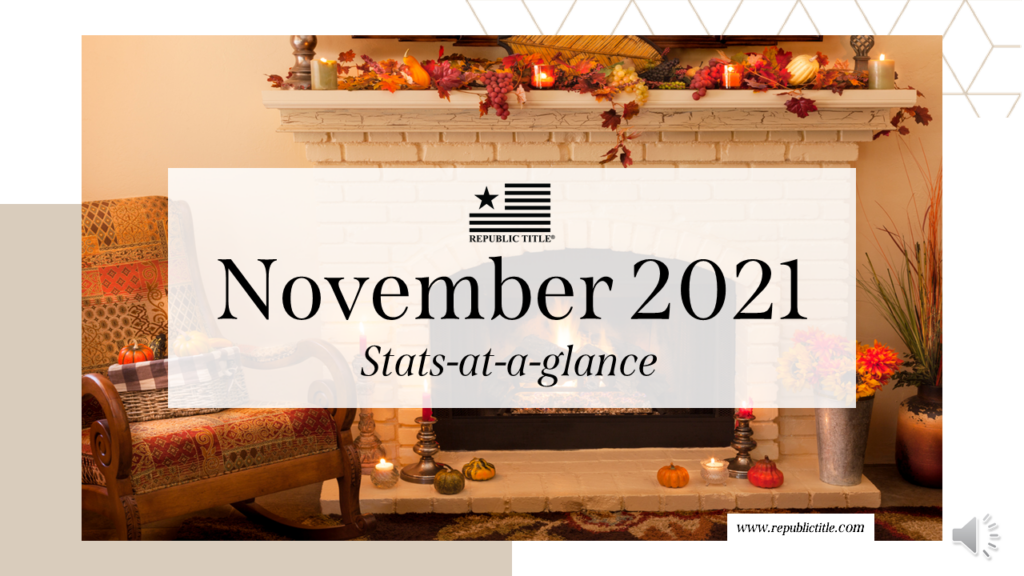
November 2021 North Texas real estate stats are out and we’ve got the numbers! Our stats infographics include a year over year comparison and area highlights
Republic Title is proud to announce that it has made donations totaling $100,000 to six North Texas nonprofits who are addressing the needs in North
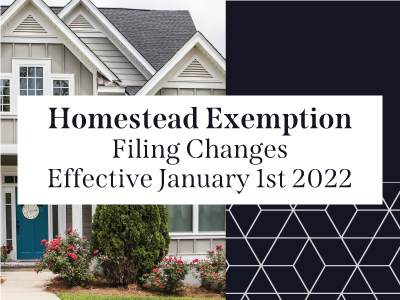
Homestead Exemption Filing Changes Effective January 1, 2022, a Buyer may file for a homestead exemption immediately after closing if the Seller did not have

Total Texas housing sales ticked up 0.9 percent during the third quarter as inventories remained relatively low in September. Most of the quarterly increase can
Our annual list of DFW area holiday events is here! From the Mistletoe Market to Menorah lightings and everything in between, there’s a little something

Need help planting a successful garden or landscape? Here are some November planting tips from the Dallas Arboretum horticulture staff and the Dallas County Master