June 2020 DFW Area Real Estate Stats

The June 2020 DFW area real estate statistics are in and we’ve got the numbers! Take a look at our stats infographics, separated by county, with MLS area stats on each county report as well! These infographics and video are perfect for social sharing so feel free to post them!

To see past month’s reports, please visit our resources section here.

For the full report from the Texas A&M Real Estate Research Center, click here. For NTREIS County reports click here.

Texas Housing Insight – May 2020

Here is the May 2020 Summary from Texas A&M Real Estate Center.


Total Texas housing sales continued to fall in May, but the decline slowed to a 2.1 percent monthly decrease. Nonetheless, the inventory of homes for sale fell to a record low of 3.2 months, possibly due to owners pulling their homes off the market or failing to list them in the first place during the COVID-19 pandemic. Increased caution during the buying process resulted in softer demand, pushing the average days on market up to 61 days. The Repeat Sales Home Price Index, however, suggested stable price gains.

The coronavirus outbreak is the greatest threat to the Texas housing market since the 1986-90 recession via disruptions to buyer and seller confidence, the negative income shock, and wariness of visiting or showing homes for sale. Mortgage applications for home purchases and the Real Estate Center’s single-family housing sales projection, however, implied that home sales were beginning to recover before the second wave of new coronavirus cases.

Supply*

The Texas Residential Construction Cycle (Coincident) Index, which measures current construction levels, inched up in May as the industry began rehiring some of the jobs shed during the economic shutdown. The Residential Construction Leading Index, however, continued to trend downward as falling housing starts offset increased permitting activity and decreased real interest rates, suggesting sluggish activity in the near future. The metropolitan leading indexes also extended downward trajectories.

Private bank loan data revealed construction activity accelerated 3.4 percent quarter over quarter (QOQ) during the first three months of 2020. After a sluggish second half of 2019, single-family investment increased 2.9 percent QOQ. Meanwhile, multifamily loan values rose for the fifth straight quarter, jumping 3.8 percent QOQ to a record-breaking $8.9 billion. Second-quarter financing, however, may stall as lending standards tightened at the onset of the pandemic.

As the statewide stay-at-home mandate expired and economic uncertainty temporarily calmed, single-family construction permits recovered 12.6 percent in May. Although levels remained nearly a fifth below that of peak issuance during February, Texas remained the national leader, contributing 17 percent of the national total. Houston topped the list with 3,035 nonseasonally adjusted permits, followed by Dallas-Fort Worth (DFW) with 2,799. Rockwall County accounted for much of the Dallas metropolitan division’s 14.1 percent improvement, the greatest increase in the Texas Urban Triangle, after adjusting for seasonality. San Antonio registered an upturn in activity, posting 787 nonseasonally adjusted permits. Issuance remained sluggish in Austin, however, with only 1,412 permits. In Texas’ multifamily sector, permits fell 18 percent, but the trend maintained a strong upward trajectory.

Total Texas housing starts fell 30.1 percent to a six-year low with particular weakness in the multifamily sector. Single-family private construction values increased 5.8 percent after adjusting for inflation with Houston posting the largest improvement, rising 20.2 percent, followed by San Antonio with a 10.0 percent climb. Values jumped 3.9 percent in Austin but extended a two-month fall in DFW, declining 3.7 percent.

Despite decreased sales, Texas’ months of inventory (MOI) fell to a historic 3.2 months as the state’s supply of active listings plummeted to its lowest level in three-and-a-half years. A total MOI around six months is considered a balanced housing market. Inventory for homes priced less than $300,000 slid to an all-time low of 2.4 months as the price range registered increased sales. On the other hand, the supply of active luxury home (homes priced more than $500,000) listings expanded for the first time this year while closed listings fell, pushing the MOI up to 7.6 months. This disparity exemplifies the shortage of affordable housing during a time when the rocky economic atmosphere may make lower-priced homes look more financially feasible to the potential homebuyer.

Inventory in the major metros decreased across the board in every price cohort except for homes priced more than $500,000. The supply of active listings fell the most in Central Texas, which, combined with falling sales, resulted in more substantial changes. Austin’s MOI slid to 1.9 months after two straight monthly increases, while the San Antonio metric recorded a historic low of just three months. In Dallas and Fort Worth, inventory inched down to 2.6 and 2.4 months, respectively. The Houston MOI was the only one above the statewide average at 3.4 months.

Demand

Public health precautions and social distancing measures during the previous couple of months continued to weigh on total housing sales, which decreased 2.1 percent in May. Sales for homes priced less than $300,000 increased marginally but remain one-fifth below peak levels this year. Still, Texas registered a smaller decline than the U.S. as a whole, as nationwide sales sank 6.6 percent.

North Texas sales fell 4.7 and 1.9 percent in Dallas and Fort Worth, respectively. Sales declined 7.7 percent in Austin and 3.0 percent in San Antonio. Houston was the exception with sales rising 1.9 percent. YTD levels are still behind last year’s pace during the first five months, much less record-breaking activity during February.

Reduced showing and visiting of homes during March and April translated to slightly softer housing demand, pushing Texas’ average days on market (DOM) up to 61 days and ending a year-long downward trend. The Houston and San Antonio DOMs hovered just above the statewide average, ticking up to 62 and 63 days, respectively. In Austin, the average home sold after 55 days, six days slower than the previous month. The metric in North Texas increased by five days to 57 and 50 days in Dallas and Fort Worth, respectively. Demand for existing homes softened more than for new homes in every location except Fort Worth, possibly reflecting more willingness to visit and purchase new construction.

The ongoing spread of the coronavirus kept interest rates at historically low levels, but an upturn in oil prices slowed the downward slide. The ten-year U.S. Treasury bond yield flattened at 0.7 percent, but the Federal Home Loan Mortgage Corporation’s 30-year fixed-rate dropped to its lowest reading on record at 3.2 percent. Mortgage applications for home purchases rose by a third in May after three straight decreases yet remained 4.5 percent below year-end levels. Refinance activity stumbled on the month, although applications were up 60.8 percent YTD.

Prices

The Texas median home price contracted 2.3 percent in May, falling to a near-annual low of $240,500. In year-over-year (YOY) terms, the median sale price appreciated just 1.6 percent, the smallest annual change since 2012. A shift in sales composition may explain the monthly decline, but the distribution was similar relative to the same period last year. Another explanation for the subdued price appreciation is that the state’s sale-to-list price ratio fell for the second consecutive month, with the recent decrease the steepest in nine years. The shift in leverage toward buyers coincided with softer demand.

At the metropolitan level, median home prices declined on a monthly basis in all but Austin, where the metric flattened to $317,700 following a 4.6 percent decrease the prior month. Annual growth was sluggish except in San Antonio, where the median price rose 3.5 percent YOY to $235,400, but the increase remained below the long-term average pace. The metric in both Fort Worth and Houston was $240,800, while Dallas’ median price fell to $287,300.

The Texas Repeat Sales Home Price Index, a better measure of changes in single-family home values, provides insight into how Texas home prices evolve. Although the index did decelerate on a monthly and annual basis, a YOY increase of 3.4 percent suggests the pandemic’s effect on home values has been minimal. Houston’s and San Antonio’s indexes grew less than the statewide measure, rising 2.5 and 3.1 percent YOY, respectively. Austin’s metric jumped 4.9 percent but recorded its slowest rate in seven months. Only in North Texas did the index accelerate, climbing 2.9 percent in Dallas and 4.0 percent in Fort Worth.

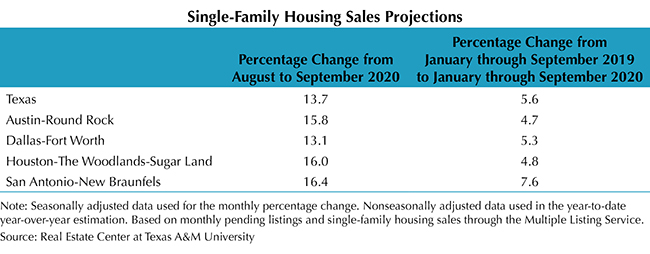
Single-Family Forecast

The Real Estate Center projected single-family housing sales using monthly pending listings from the preceding period (Table 1). Only one month in advance was projected due to the uncertainty surrounding the COVID-19 pandemic and the availability of reliable and timely data. Sales are expected to increase in June for the first time since February, when activity peaked. Texas’ single-family sales are estimated to rebound 33.7 percent, with Austin leading the major metros, climbing 39.1 percent. Dallas and Houston single-family sales are expected to jump 36 and 35 percent, respectively, while San Antonio’s sales increase 30 percent. Nevertheless, the data indicate a full recovery will not be reached in June. Even then, a third-quarter comeback may be threatened if the second wave of COVID-19 cases triggers another economic shutdown.


All measurements are calculated using seasonally adjusted data, and percentage changes are calculated month over month, unless stated otherwise.

Source – James P. Gaines, Luis B. Torres, Wesley Miller, Paige Silva, and Griffin Carter (July 14, 2020)

https://www.recenter.tamu.edu/articles/technical-report/Texas-Housing-Insight

Preparing Your Home For Sale

Remember: First Impressions are the Strongest!

When buyers make a decision to purchase a home, they do it emotionally!  The feeling they get from the house and the way they picture themselves enjoying the home are two of the most important factors in the decision to buy.  The following list offers suggestions to help the potential buyers create their own good feelings and visualize themselves owning your home.

EXTERIOR

  • Does the house need painting?
  • Are there any holes or cracks?
  • Are the walks and porches clean and in good repair?
  • Doe the front of the home give a “Welcome” appearance?
     LANDSCAPING
  • Does the yard look well maintained?
  • Trees and bushes trimmed/lawn mowed?
  • Is it free of weeds?
  • Are the decks and patios clean?
      ROOF
  • Does it leak, sag or have shingles missing?
  • Is the chimney in good shape?

INTERIOR

      WALLS
  • Any cracks or holes?
  • Is paint/wallpaper in good shape?
     KITCHEN
  • Are the appliances clean and working?
  • Are the cabinets/countertops in good condition and tidy?
  • Is the tile grout clean?
  • Is the sink stained, chipped or in need of re-caulking?
     CEILINGS
  • Are there any water stains, cracking or peeling?
  • Do they need painting?
     CARPETS
  • Are they clean, have spots or faded areas?
  • Do they need stretching?
     BATHROOM
  • Do the faucets work and sinks drain freely?
  • Are the toilets in good condition?
  • Are the shower doors shiny?
  • Do the tubs need caulking?
  • Is the floor in good condition?
  • Are the vanities/mirrors in good condition?
     WINDOWS
  • Do the drapes/shutters/shades work properly?
  • Are they clean and open and close easily?
  • Are any screens  bent?
     DOORS
  • Are they in good condition/need paint?
  • Do they seal tightly with no sagging or sticking?
  • Do you need to replace the storm doors?
     FIREPLACE
  • Is it clean and attractive?
  • Is the screen in good shape?
     ATTIC
  • Is it organized and clean?
  • Is there sufficient lighting
  • Does the access function well?
  • Are there any signs of insects/rodents
     GARAGE 
  • Is it organized and clean?
  • Is there sufficient lighting?

Before the Inspector Arrives

Remember: Repairs made prior to the inspection will save time and aggravation.

  • Cut tree limbs away from the house
  • Wash stained siding and brick to remove discoloration or mildew
  • Install splash blocks at downspouts
  • Clean gutters and repairs where necessary
  • Repair all rotted wood and paint to match
  • Remove any items against the house or garage
  • Repair and replace damaged screens
  • Clean chimney
  • Clean and inspect heater
  • Check A/C; it should cool to 20 degrees below outside temperature
  • Check condensing unit & clean away any debris, leaves, grass, etc.
  • Test all smoke detectors & add new batteries where necessary
  • Toilets should be secured (should not rock)
  • Make sure all tubs and/or showers do not leak into wall when water is sprayed from fixtures
  • Have all cracks in masonry repaired by professional mason
  • Repair dripping faucets

We hope these tips have been helpful to you in answering any questions you may have had. As always, please do not hesitate to contact your closer should you have any questions.
Thank you for allowing us to be a part of this transaction.

Click here to print the Preparing to List Your Home Checklist.

Using Links in Instagram

Since launching in 2010, Instagram has become one of the leading social media platforms and has transformed the way people do business. It’s no secret why businesses have spent hours developing and creating a strategy to grow and promote their business on Instagram. But as a real estate agent, do you know how to get the most out of the popular platform to help generate leads, market yourself, and engage with your sphere?  Whether you are new to Instagram or a seasoned pro, we want to help!

Why You Should Use Links on Instagram

Instagram has seen an impressive rise since it first launched in 2010. This has naturally made it a desirable outlet for marketers, and anyone else who wants to spread the word about their brand or website.

The problem is that, up until recently, Instagram has been extremely hesitant when it comes to enabling links. Even now, it’s not possible to add links directly to your posts through comments or post descriptions, even though this is something that has been possible on other social networks for a long time (Note: Stories can have links, however, you must have 10,000 followers to incorporate them).

However, there are still ways to incorporate links into your Instagram profile, and they’re well worth looking into. The key is knowing how to encourage those users to check out your key marketing links.

How to Use Links Effectively on Instagram

  1. Add a Link to Your User Profile

The simplest way to get a link on Instagram is to simply add it to your profile. The link will then appear right underneath your user bio, enabling visitors to click through. This is a perfect way to send people to your website’s home page, or to a special landing page.

However, you can also use this feature to get around the fact that you can’t add links to your post descriptions. All you need to do is include a link in your profile that is relevant to your most recent post. Then, add a message to the post itself, along the lines of: “Link in bio!” This is a common tactic, and it offers the added benefit of driving users to your profile.

Since you only get 1 link with Instagram (in your bio), we suggest that you check out one of these services.  They each have free services, as well as pro services.  The nice thing about them is that you can track each link to see how well they are performing in terms of engagement, page views & click through percentage rates.  Even better news – You can send followers to all your favorite sites including your real estate lead generation sites (see our example below using Linktr.ee):

  1. https://Linkin.bio
  2. https://linktr.ee

  1. Use a URL shortening service

The second method we recommend that you use are shortened and trackable links in your posts. You can easily create these using a URL shortening service and a link management platform (Bitly). That way, you’ll be able to track your links and see how well they perform on Instagram, which can help you optimize your efforts even further.

At first glance, it might seem it’s impossible to use links on Instagram.  However, while the platform is unusually restrictive with linking, it does offer numerous creative ways to implement links into your posts and profile.

Residential on the rise: The current and future state of real estate in North Texas

Expect a wave of moves to the suburbs and continued relocations as COVID-19 redirects, rather than deters, the DFW residential real estate market.

“History is the best predictor of the future, in my mind, and I feel like we’ve weathered some really great storms in the past 10 years since the last recession,” said Janet Allen, a senior vice president and leader of Republic Title’s team of Business Development representatives for the company’s 13 residential branches. “I honestly believe we’re going to be fine. I do believe that there’s going to be a big wave out to the suburbs. I’m seeing a little piece of that right now”

In addition to Allen, panelists included Fred Balda, president of Dallas-based residential development company Hillwood Communities; Rogers Healy, founder, owner and CEO of The Rogers Healy Cos. based in Dallas; and Brian Palmer, president of McKinney-based mortgage brokerage Pinnacle Funding Group Inc.

Below, panelists discuss the pandemic’s impact on the workforce, opportunities ahead in the residential space and more.


How has COVID-19 impacted your workforce or customers?

Fred Balda: Our two objectives were making sure the team was safe and able to work from home remotely, of course, and so I give a lot of credit to our IT group. They really got us up and running pretty quickly.

Second, the main objective was to keep the machine rolling. We needed to to continue to do business in a different manner – and I will say we fared very well. We are starting to bring our people back into the office now. I’m in the office right now and probably 20 percent of our people stayed in the office [since March]. We probably have 50 percent of our people back here working.

We are requiring testing, so before anybody comes back to the office, they must get tested. We’ve gone through two rounds of testing with our employees and it’s worked quite well. We have a pretty strict protocol. When I come to the office, I’m greeted by a nurse. I’ve got my mask on. She takes my temperature. And then she takes my oxygen level through a pulse oximeter. Only then and I able to enter the building.

I wear my mask all the way to my office. Whether I’m going to the cafeteria or to the restroom, or going to see anybody, I put the mask back on. It’s a deliberate protocol that we have instituted.

Rogers Healy: My approach is probably different than most real estate people. I’m a cautious guy and my grandma is almost 100 years old lives and in an assisted living facility and my fiancée has chronic asthma, so those two things are always going to trump bringing in revenue. I just lead with my head differently and with my heart.

We’ve adjusted well, and something that we’ve learned is in the world of real estate, especially residential, we become very routine, right?

Which means it’s hard for an older dog to learn new tricks, but we just really became attached to the word agile. And I think, being agile, you learn how to be proactive versus reactive.

The first thing I had to change was the way that I thought, because I’ve been in real estate for a long time and part of my assumption was I can’t be productive and mounted an office.

But it’s been a great surprise that our numbers have still increased year-over-year with everything going on, even with people working from home. I’m probably the most extreme business owner in terms of being cautious.

For example, our office is shut down. I can’t get into my own office. I haven’t heard of any owner locking themselves out, so it may seem extreme, but we all need to be taking precautions.

Brian Palmer: It really hasn’t been much different for me. I feel fortunate more than anything, because started to move to an electronic closing process a couple of years ago. I feel like the mortgage industry in its entirety is probably going to be forced to move into that electronic world, probably a lot faster because of the circumstances I’ve always balanced working from home, the office or wherever.

Most of our stuff is all done electronically through e-mail, phone calls and text messages until we get to the closing table, so nothing really changed for us in that regard.

Janet Allen: We have more than 400 employees spread across DFW. We did our very best to execute a plan quickly and actually had about 70 percent of our workforce working from home starting in March. Our residential people really stuck it out. They have done an incredible job and taking care of our customers, buyers, sellers, realtors, lenders and developers.

 We’ve talked about the challenges of COVID-19. What are some of the opportunities it presents?

Janet Allen: Last year, we started moving more into the digital space. I am so glad we did because it allowed us to get ahead of things, rather than fall behind when we had to move to a remote work environment.

The other thing is learning that we might be able to have people work from home a lot more often than in the past. Maybe they can actually do the job better.

This could result in more of a work-from-home situation for our employees in the future.

Fred Balda: I’m in the master-planned community business, building in the suburbs, and so the demographics are playing to our favor. You have a variety of demographics that are hitting us right now. There’s a millennial that obviously is creating families right now, and has basically located in the urban sectors, and there’s a big desire right now to move out of the urban area.

I think urban will survive, of course. But we are seeing this demand coming in, the urban sectors into suburban areas, more so than we’ve seen in the past.

The relocation activity has always been good here, so we’ve always been attracted new companies. It just seems to be accelerating more now.

I think our business in the long run, even short-term, is going to take off again. We were all expecting a bit of a drop off in 2020, maybe a hiccup. Obviously due to coronavirus, it was more than that – it went pretty deep. Nobody expected this kind of hit, so the opportunities I see are in the future. At least in our master-planned communities, we about why you’re moving out and why you are reconsidering your shelter.

You may need a bigger house, you need a better designed home, you need a cleaner home, you need to a better technology package for your home. New homes are able to really address that quite well. Our master plans right now are very appealing, because of all the normal amenities that we normally do, and you’re able to do it a little bit further out. All of our parks, and trails, and playgrounds, and those sorts of things are really a premium right now for folks coming in and want to see that sort of lifestyle. I think that’s a big focus.

But the rental side is really another opportunity now, too. We build lots of multifamily ourselves. The single-family rental right now is another focus of ours that I hope we can roll out, at least a pilot program, in the next six months or so. I think will go quite well. That’s another line of business that we’ve observed that really makes sense.

I think affordability is always going to be an issue here. We’d need to really address that interest rates have healthy affordability right now, that’s going to creep back up. How do you design homes that are semi-affordable right now in these in these places that people want to be?

Brian Palmer: I feel like it’s a great opportunity, just because there are going to be people that change their direction a little bit. For us, it’s just going to be full force ahead, to continue to try to serve the clients even better than what we already did.

We’re making sure that we can get to a full digital world. There are some things that Gov. Abbott has done in the interim that make it easier, like how notaries don’t necessarily have to be in front of anybody.

There are going to be some people that are going to be cautious and don’t want to go out, whereas others will and we want to serve those people, too.

 If Covid-19 becomes worse in coming months, do you think that it would it be a positive or negative impact on rental market? Do the obvious effects — prospective buyers putting purchases on hold; increase in unemployment numbers — balloon into something worse, or can North Texas weather it?

Rogers Healy: I think real estate is going to change to a hybrid of affordability and space.

We’re going to see that the days of the $30,000 millionaire are probably going to be over, because I think people would rather live somewhere in a rental home community. Which I think is going to be a trend we’re going to see in the next few years: people literally developing communities for that sole purpose, which we’ve never really seen happen.

Living on the penthouse right now is not as good as living on the first floor, for example, in a lot of these buildings, too. So we have seen a pretty big shift in trends and the amount of people that we’ve worked with on the first-time homebuyer front that normally would live within the loop or moving north … instead, they’re moving east and west, too.

We’re going to see pockets like Mansfield and Richardson get people in certain demographics who historically wouldn’t have purchased there. So, you know, it’s interesting to see what’s happening.

And DFW still has people moving here, too. You have to provide housing, but I think that it’s going to shift to where people are going to start renting and if they have to, they’re going to rent single-family detached homes, if they have the option to do so.

Fred Balda: I think we’ll be more prepared at this time. Chapter One was pre-coronavirus, which was stellar. It was just very robust, and people were moving in and it was going to be another banner year. Everything was looking really positive.

And then corona hits and we probably had about a six-week slowdown. In our business, it really probably dropped to a 50 percent level, from the prior 10 weeks or so. But there was still activity, which was interesting, to see that we still had that activity, even if it was 50 percent. And then, the last six weeks or so, we’re starting to come to work again and people are getting out. It’s been incredible.

I believe the next few weeks will be robust.

I think we are more prepared because now we can work remotely a little bit better. But let’s hope we find a solution to coronavirus right now, because it’s not fun. Let’s hope it’s not the new normal. We’ll get past this, but I appreciate being an essential business. I appreciate having the opportunity to sell homes and building new communities.

 How is DFW’s inventory right now — and how do you think it will look over the next year?

Rogers Healy: Surprisingly, inventory, up until about a month ago, was awful.

The last three weeks, especially in the larger home market above $3 million, it’s been gangbusters.

And in terms of a recession, it’s important how you interpret or communicate it. My favorite class in school was recess. Got me a break from the classes that were kind of work. And so I think that we have an opportunity to lead. Our industry said, “Hey, it’s OK to take a little bit of a break, right?” Because work is not going to define you. And we all work so hard.

It’s OK to just take a step back and relax. Because you know, it’s always going to be there, right?

I don’t know anything about the stock market, but I’ve watched it the last three months and it literally makes me nauseous.

One tweet can go and change the world and then the next day, another tweet changes the world the other way. That means I have people that may have to have to sell pretty quickly, right?

And on top of that, the thing that we’ve seen that’s been crazy is secondary homes are flying off the shelves as well. Historically, you don’t see lake houses farms and ranches so in the late spring and the summer. Because people already want them.

And we’ve seen that, and also the short-term rental market has been insane as far as inventories are concerned, too, like Airbnb-type places. I’m talking like 3-to 6-month places, where you don’t have to obviously have an appraisal. You can ask for whatever you want, and we’ve seen those things go crazy as well, because people want to get the heck out of town.

So inventory is starting to get a little bit healthier. But again, North Texas is the unicorn of real estate, versus some cities like New York, where you can’t even show properties at this time. And DFW has a shortage?

I don’t think we really had a recession. I think we’re at a time out.

Who knows what, the immediate future holds, but it’s a good time still to be in real estate, you know, four months into a pandemic. And that’s absolutely crazy.

Source – Dallas Business Journal – June 26, 2020 – https://www.bizjournals.com/dallas/news/2020/06/26/residential-real-estate-north-texas.html?iana=hpmvp_dal_news_headline


May 2020 DFW Area Real Estate Stats

The May 2020 DFW area real estate statistics are in and we’ve got the numbers! Take a look at our stats infographics, separated by county, with MLS area stats on each county report as well! These infographics and video are perfect for social sharing so feel free to post them!

To see past month’s reports, please visit our resources section here.

For the full report from the Texas A&M Real Estate Research Center, click here. For NTREIS County reports click here.

Digital Resources for REALTORS® to Take Your Business to the Next Level

There’s a plethora of resources at your fingertips that can help you grow your business and be a better REALTOR® to your clients. Here are a few of our favorites and where to find them.

STATS, INFOGRAPHICS & MARKETING MATERIALS
RPR®
RPR, or Realtors Property Resource, provides REALTORS® with data. Easily search properties, create and send branded reports, and view local market statistics, anytime, anyplace. www.narrpr.com or the NTREIS dashboard

ListReports
Generate marketing materials for your listing including open house flyers, property reports, neighborhood demographics, infographics with local information & more. www.listreports.com

Breakthrough™ Broker
Brand professionally created infographics for real estate agents, as well as postcards, social media posts and other marketing materials. Breakthrough™ Broker also has lead generation strategies and business planning tools as well. www.breakthroughbroker.com

MarketViewer
A real estate market analytics portal exclusively for members of TAR where you have instant access to market stats across thousands of geographies in Texas. www.texasrealestate.com/members/research/marketviewer

NTREIS
NTREIS Local Marketing Updates/Reports and Monthly Market Indicators each month with information from the previous month. www.ntreis.net/resources/statistics.asp

NTREIS Trends
An interactive market analytics tool, based on MLS data. It allows the user to instantly access nearly any view of the local housing market, all with an immersive interface. NTREIS dashboard

Texas A&M Real Estate Center
Housing activity statistics from over 50 MLS systems in Texas, released monthly. www.recenter.tamu.edu

TOOLS FOR FARMING
REiSource®
Specializing in data mining and lead generation, REiSource® is a nationwide database tool that helps you narrowly focus your business contacts and leads as well as helps to identify your most viable prospects based on sophisticated search options. Contact Republic Title Business Development Rep.

Remine
Remine puts REALTORS® in the center of the transaction. Remine’s interactive map and data-based filters help REALTORS® quickly and easily find new leads, track current and past opportunities. NTREIS dashboard

Realist® Tax
Realist® from CoreLogic® is a public-record database that seamlessly integrates with MLS to provide in-depth property and ownership data, market information, street and aerial maps, as well as market trends to its users. NTREIS dashboard

SOCIAL MEDIA CONTENT
Canva
Easily create beautiful and professional designs and documents to use in your business for social media, email marketing and even postcards & flyers. www.canva.com

Ripl
Create branded videos and images in minutes, then instantly post to all your social media accounts at once. www.ripl.com

Planoly
Plan, edit, and schedule your social media content now so you don’t have to later. All the Instagram and Pinterest visual planning and management tools you need in one easy tool. www.planoly.com

Unsplash
With over 1 million free high-resolution photographs, Unsplash is the perfect place to start when looking for images to use in correlation with your social content. www.unsplash.com

Print Version

Texas Housing Insight – April 2020

Here is the April 2020 Summary from Texas A&M Real Estate Center.

Texas Housing

Total Texas housing sales declined 17.6 percent in April amid economic uncertainty surrounding the COVID-19 pandemic. Showings of homes for sale were not explicitly prohibited by the month-long statewide stay-at-home order, but potential buyers and sellers were certainly more reluctant to host and attend in-person tours and open houses. Nevertheless, demand remained stable as the average days on market slid to 57 days, although loan applications for home purchases decreased while lenders implemented stricter lending standards.

On the supply side, both housings starts and building permits plunged more than 20 percent despite construction being considered an “essential” business under the statewide mandate. Median home-price appreciation decelerated but remained positive as corroborated by the Texas Repeat Sales Home Price Index. The coronavirus outbreak is the greatest threat to the Texas housing market since the 1986-90 recession via disruptions to buyer and seller confidence, the negative income shock, and wariness of visiting and showing homes for sale. The Real Estate Center, however, projects the rate of decline in single-family housing sales will slow in May relative to April.

Supply*

Contemporaneous and anticipated construction activity continued to fall during the coronavirus-induced downturn. The Texas Residential Construction Cycle (Coincident) Index, which measures current construction levels, sank to its lowest reading since 2017 as industry employment plummeted. Decreased building permits and housing starts offset falling interest rates, pulling the Residential Construction Leading Index down to levels around those last seen in January 2007.

As economic uncertainty ramped up due to coronavirus concerns, single-family construction permits nosedived 22.2 percent. Nevertheless, Texas remained the national leader with Houston and Dallas issuing 2,829 and 1,856 nonseasonally adjusted permits, respectively, despite declining about 25 percent. Other locales registered more moderate decreases between 11 and 17 percent, but San Antonio permits fell for the sixth consecutive month to 632. Austin issued 1,618 permits, double the per capita statewide rate, while Fort Worth posted 1,002. On the other hand, Texas’ multifamily permits improved for the second straight month, increasing 16.1 percent.

Total Texas housing starts fell more than 20 percent to a year-and-a-half low as building activity slowed under social distancing rules. Meanwhile, single-family private construction values dropped 26.9 percent in April to a seven-year low after adjusting for inflation. Every major metro registered a steep decline, with San Antonio values contracting by a third. Houston’s metric sank 22 percent after flattening the previous month, while Austin and DFW values decreased for the second straight month. Single-family construction, however, is expected to rebound in the coming months as housing demand remains relatively stable.

The state’s supply of active listings fell to its lowest level year to date (YTD), offsetting plummeting sales and pulling Texas’ months of inventory (MOI) down to 3.4 months. A total MOI around six months is considered a balanced housing market. Inventory for homes priced less than $300,000 (where four-fifths of total sales take place) slid to 2.7 months. On the other hand, luxury home inventory (consisting of homes priced more than $500,000) ticked up for the first time in eight months as falling sales outweighed a decline in the supply of active listings. So, despite falling sales, the overall market remained relatively tight and in short supply.

On the metropolitan level, the Houston MOI registered the greatest drop but remained above the statewide level at 3.6 months. North Texas inventory flattened at 2.7 and 2.5 months in Dallas and Fort Worth, respectively. San Antonio’s MOI increased slightly to 3.3 months, while Austin’s metric reached 2.1 months. Most of the expansion happened in the higher price ranges. 

Demand

With COVID-19 impacts well underway, total housing sales dropped 17.6 percent in April to their lowest level since 2015, decreasing in every price cohort. Homes priced less than $300,000, however, accounted for two-thirds of the decline, corresponding to the sales composition. Texas sales decelerated from a double-digit pace in the first two months of the year relative to the same period in 2019 to just a 1.5 percent clip when comparing the first four months of the year.

Sales activity in the Metropolitan Statistical Areas (MSAs) declined at a faster rate than the previous month, with Austin and Houston sales volumes falling by a fifth. Sales plunged 18.7 percent in DFW, largely due to decreases in the $200,000-$300,000 price cohort. San Antonio was the only major metro to not register reductions across the price spectrum as homes priced from $400,000-$500,000 reached an all-time high. However, the MSA’s total sales still slid 14.3 percent.

Despite massive layoffs across the state, housing demand remained healthy as Texas’ average days on market (DOM) extended a year-long downward trend, sinking to 57 days. Some of this resiliency may reflect disproportionate job losses occurring at the lower-end of the earnings spectrum which primarily consists of renter households. Austin’s metric slipped to its lowest level in five years at 47 days, while the San Antonio DOM inched down to 59 days. The average home in Houston sold after 59 days, stabilizing around its year-ago level. Demand softened slightly in North Texas as the DOM ticked up to 52 and 44 days in Dallas and Fort Worth, respectively but remained strong compared with the statewide average.

Ongoing concerns, such as the global coronavirus pandemic and critically low oil prices, pulled interest rates down in April. Both the ten-year U.S. Treasury bond yield and the Federal Home Loan Mortgage Corporation’s 30-year fixed-rate dropped to their lowest readings on record at 0.7 and 3.3 percent, respectively. Despite the former reaching a series low, mortgage applications for home purchases decreased for the third straight month plummeting 28.5 percent YTD amid coronavirus-related disruptions to the housing market and stricter lending standards. Applications to refinance home loans fell 13.2 percent in April but maintained positive YTD growth after doubling since year end in the first quarter. However, Center staff expects applications volumes to recover in the coming months assuming housing demand remains stable.

Prices

The Texas median home price flattened at $247,400, posting its lowest annual growth rate this year at 4.2 percent. Austin’s median home price sank to $316,400 after double-digit YOY hikes the previous two months when the proportion of homes priced more than $300,000 exceeded 60 percent for the first time ever. Home-price appreciation in Dallas and Houston also decelerated to around 3 percent, with the metric hovering around $296,700 and $248,800, respectively. On the other hand, YOY growth in Fort Worth and San Antonio accelerated, pushing the median price up to $252,900 in the former and $240,600 in the latter.

The Texas Repeat Sales Home Price Index, a better measure of changes in single-family home values, provides insight into how Texas home prices evolve. The index indicated home price appreciation decelerated in April on both the state and metropolitan levels. Texas’ index rose just 3.6 percent YOY, with the larger locales sliding well under the statewide average. The Dallas and Houston metrics increased only 2.3 and 2.6 percent, respectively. Austin’s index maintained the highest annual growth rate of 6 percent. The Fort Worth and San Antonio indices slowed to 3.8 and 3.2 percent YOY growth, respectively, contrasting median home price data. Favorable housing affordability relative to other parts of the country supported the Lone Star State’s economic growth after the housing bubble burst a decade ago. Texas needs to maintain affordability for the housing market to remain a stalwart in the current recession and subsequent recovery.  

The Real Estate Center projected single-family housing sales using monthly pending listings from the preceding period (see Table 1). Only one month in advance was projected due to the uncertainty surrounding the COVID-19 pandemic and the availability of reliable and timely data. Although activity is expected to worsen, the rate of decline decelerated at the statewide level, from a 13.6 percent decrease in April to an anticipated 10.1 percent decrease in May. The drop in single-family sales in DFW and Houston is also expected to slow with the metric falling 10.4 and 7.4 percent, respectively. Central Texas, on the other hand, contradicted the overall state trend as the sales are estimated to plummet at a faster rate in May, 17.6 and 11.0 percent in Austin and San Antonio, respectively, relative to the previous month.

All measurements are calculated using seasonally adjusted data, and percentage changes are calculated month over month, unless stated otherwise.

Source – James P. Gaines, Luis B. Torres, Wesley Miller, Paige Silva, and Griffin Carter (June 11, 2020)

https://www.recenter.tamu.edu/articles/technical-report/Texas-Housing-Insight

Definitions and Rules of a Deferred 1031 Exchange

1031 Exchange
An event where a taxpayer exchanges or trades real property held for investment or used in a trade or business for other real property and defers the capital gains tax on the transaction.

Tax Deferred
The capital gains tax which would have been paid on the sale of the real property is not paid but is deferred to be paid at a later time when the property traded for is sold in a non-exchange sale.

Property Held for use in a Trade or Business
Any real property used by a taxpayer in its business. This could be an office building, warehouse, ranch, shop, garage, farm, etc.

Investment Property
This is real estate purchased to produce an investment income or an investment gain on resale. It can include, but is not limited to apartments, a rent house or raw land.

Like-Kind Property
In the exchange world, “like-kind” does NOT mean you must exchange an apartment project (investment property) for another apartment project, or raw land for raw land, it means that you must exchange real estate for real estate. This permits, within the categories of “held for investment” or “used in your trade or business”, the exchange of apartments for land, or office buildings for apartments, etc., as long as the old properties sold and the new properties acquired are either held for investment or used in a trade of business. The property sold and the property acquired do not have to be exactly alike, they just have to be real estate and fall in the category of “held for investment” or “used in your trade or business”.

Relinquished Property
Relinquished Property is the real estate held for investment or use in your trade or business which is sold or “relinquished”. Think of the Relinquished Property as the property being sold and the Replacement Property as the real property being acquired.

Replacement Property
Replacement Property is the real estate acquired by the taxpayer/seller in a 1031 exchange as replacement for the relinquished property.

Exchange Proceeds
The cash received by the Qualified Intermediary through the sale by the taxpayer of the Relinquished Property and any debt paid on the property sold. In order to defer all of the tax on a sale you must spend all of the cash proceeds received or more if you want to and you must borrow the same amount of money or more if you need or want to that was used to pay off any loan or loans on the property sold. You will pay the tax on any cash proceeds not used to buy Replacement Property or any loan paid off in your sale that was not replaced with same or greater payoff amount of loan on the Replacement property.

The 45-Day Rule
You must identify by written notice (signed by you) to your Qualified Intermediary the Replacement Property or Properties (you can identify more than one possible Replacement Property) you want to buy within 45 days after you close the Relinquished Property. Do not count the date of closing; count 45 days after the closing date and that is the end of the “Designation or Identification Period” – the true end, whether it’s a Saturday, Sunday or any legal holiday. Better get this part completed on that date as a minimum. Before that date is better. After that date, your exchange may be disqualified.

The 180 Day Rule
You must close, fund, and acquire (do it all) the Replacement Properties within 180 days after you close the Relinquished Property. Do not count the date of closing; count 180 days after the closing and that’s the “drop-dead” date to completely acquire the Replacement Property – the true end, whether it’s a Saturday, Sunday or any legal holiday. Better complete this part on this day as a minimum. Before that date is better. After that date, your exchange may be disqualified.

Three Property Rule
Try to designate three Replacement Properties or less to purchase, generally, because if you stay with three or less, you don’t have to worry with anything other than being sure it is like-kind property. If you designate four or more, then you must deal with the “200% Rule”.

The 200% Rule
This rule only comes into play if you designate more than three properties as possible Replacement Properties. If you do, add up the “fair market values” of all the properties designated and be sure that this aggregate number is not more than the gross sales price of the Relinquished Properties times 2. If it is more and you don’t fall within the “95% Rule”, your exchange is outside the safe harbor and may fail.

 The 95% Rule
This is an exception to the consequences of violating the 200% Rule, which applies if you violate the “Three Property Rule”. If your sum of the fair market values of more than three Replacement Properties is greater than two times your sales price of the Relinquished Property, you are still “safe” if you acquire 95% in value of these designated properties, which means that you really need to buy all of the Replacement Properties you designated.

Exception to the 180 Day Rule
You don’t get 180 days to complete the exchange if you have to file your Federal income tax return for the year in which your relinquished property sold before the 180th day. If your tax return for the year in which your relinquished property sold is due on April 15th and your 180th day falls in May, you have to complete your acquisition of the replacement property before April 15th even if there are more days left in the 180 day time frame. BUT, if you file an extension to your tax return, then this exception doesn’t apply. Remember to file the extension if you are in this situation.

Direct Deeding
1031 Exchange allow Direct Deeding, making it all much simpler. In previous years, the exchange taxpayer deeded the property to be sold to the Qualified Intermediary who would then deed to the buyer of the Relinquished Property, and the seller of the Replacement Property would deed to the Qualified Intermediary who would deed to the exchange taxpayer. You don’t have to do this anymore. You can deed the Relinquished Property directly to your buyer, and receive the Replacement Property deed direct from the seller.

For more information on 1031 Exchange, please reach out to our Texas Escrow Company team:

Bill Kramer
Executive Chairman
214.855.8850
[email protected]

Helen Wooten
Exchange Assistant
214.855.8879
[email protected]

Disclaimer: This information is a summary of some of the common terms involved with 1031 deferred tax exchanges. Do not rely on this summary alone to make an exchange decision, or think that there isn’t much more involved than what is described in these simple definitions. Exchange decisions should be based on conversations with a tax advisor, an accountant, a Qualified Intermediary, and a tax attorney.

Top 5 Reasons to Refinance Your Home Right Now

With interest rates at all-time lows, now is the time to consider refinancing.  Did you know there are title policy discounts available to some homeowners when refinancing?  There is! Here are the top 5 reasons to refi now.

LOW RATES

Mortgage interest rates are at an all time low and are currently averaging at 3.25% but can be as low as 2.5% for some!

SAVE MONEY

Securing a rate 1-2% lower than your current mortgage can save you hundreds of dollars a month.

PAY DOWN / PAY OUT

Alleviate the burden of high interest debt by refinancing your loan with a new, lower rate or shorter term loan to potentially save thousands of dollars over the course of your loan.

AVAILABLE TITLE POLICY CREDITS

If the loan you will be refinancing is a previously insured loan that is less than 4 years old you may be entitled to a 50% credit on the cost of the new title policy. If the loan being paid off is between 4 and 8 years old you may be entitled to a 25% credit on the cost of the new title policy.

REMODEL OR MAJOR ONE-TIME PURCHASE

Take advantage of the equity you have in your home to
take out a home equity loan for that remodel you’ve been
thinking about for years or for a major one-time purchase.

For more information on refinancing, or to discuss your options contact your local lender.  If you have questions about title insurance and fees contact your local Republic Title Office.

Print Version