Recently released third-quarter private bank loan data revealed a slowdown from last year’s rapid clip as lending standards continued to tighten during the pandemic and an uncertain economic outlook. Loan values for multifamily properties flattened in 3Q2020 while one- to-four-unit investment declined for the second straight quarter, sinking 6 percent quarter over quarter.
On the bright side, single-family construction permits accelerated 6 percent in October, marking the sixth straight monthly increase after the previous month’s reading was revised upward. Houston topped the list, issuing 4,492 nonseasonally adjusted permits, followed by Dallas-Fort Worth with 4,243 permits. The metric in Central Texas reached 2,019 and 1,064 in Austin and San Antonio, respectively, pushing monthly growth to nearly 10 percent after adjusting for seasonality. On the other hand, Texas’ multifamily permits fell 6.3 percent year-to-date (YTD) compared with the same period last year due to a considerable step back in the volatile apartment sector. Issuance for two-to-four-unit buildings, however, posted an all-time high of 1,083 nonseasonally permits, largely due to new duplex developments in North Texas.
Total Texas housing starts extended an upward trajectory, although the rate of increase slowed to 2.3 percent as lumber prices were one-and-a-half times greater than year-ago levels. The Department of Commerce recently lowered lumber tariffs from 20 to 9 percent, however, which should help reduce homebuilder costs in the new year. Meanwhile, single-family private construction values continued to normalize from record-breaking activity in August, but the trend also remained positive. More than half of the monthly decrease was attributed to DFW, where values sank 14.1 percent following three consecutive improvements. The other major metros posted more moderate declines, falling about 4 percent in both Austin and Houston and 2.9 percent in San Antonio.
Record sales chipped away at the state’s supply of active listings, pulling Texas’ months of inventory (MOI) down to an all-time low of 2.1 months. A total MOI around six months is considered a balanced housing market. Inventory for homes priced less than $300,000 was even more constrained, sliding below 1.6 months. The MOI for luxury homes (homes priced more than $500,000), although elevated at 5.2 months, decreased for the fifth straight month as the influx of new listings slowed.
Inventory dropped to unprecedented levels in the major metros as well, with the metric in San Antonio matching the statewide average. The MOI dipped to 1.7 and 1.5 months in Dallas and Fort Worth, respectively, and sank to one month in Austin. Houston’s MOI fell below 2.5 months, although inventory increased for homes priced between $400,000 and $500,000, the only segment in the state’s major metropolitan areas where supply expanded.
Demand
Total housing sales rose 5.1 percent, pushing activity to an all-time high of more than 38,600 transactions during this period of historically low mortgage interest rates. The increase was concentrated in homes priced more than $200,000, which comprised nearly four-fifths of the market, the greatest share yet. Cumulative sales this year exceeded last year’s ten-month sum by 7.5 percent compared with 4.9 percent nationwide. The current rate of sales, however, is likely unsustainable given Texas’ depleted inventory.
Sales volumes in the major metros also expanded, led by Houston, where the metric surged 6.5 percent with growth across the price spectrum. Austin sales climbed 5.8 percent as YTD activity in the luxury home market accounted for 23 percent of total transactions compared with just over 18 percent last year. In North Texas, the metric improved 4.5 and 4.2 percent in Dallas and Fort Worth, respectively. San Antonio’s sales ticked up by a more modest 2.9 percent as the $400,000-$500,000 price cohort stumbled on the month.
Texas’ average days on market (DOM) slid to an all-time low of 48 days, corroborating robust demand despite the pandemic. Houston and San Antonio also posted unprecedented readings, with the metric dropping to 45 and 51 days, respectively. Austin’s DOM reached a post-Great Recession low of 35 days, while the average home sold after 36 days in Fort Worth and 39 days in Dallas.
Expansionary monetary measures by the Federal Reserve and better-than-expected economic data instilled confidence in the bond market, however modest. The ten-year U.S. Treasury bond yield inched up for the third straight month to 0.8 percent2. On the other hand, persistent uncertainty surrounding the pandemic, due to a dubious timeline for a second round of fiscal stimulus and a resurgence in positive COVID-19 cases, kept interest rates hovering at historically low levels. The Federal Home Loan Mortgage Corporation’s 30-year fixed-rate fell to an unprecedented reading below 2.8 percent (series starting in 1971). Mortgage rates also slid to decades-low levels within Texas during September, sinking to 2.92 and 2.86 percent for non-GSE and GSE loans3, respectively. The drop in rates pushed home-purchase applications up 17.5 percent YTD in October, while refinance activity advanced 73 percent. (For more information, see Finding a Representative Interest Rate for the Typical Texas Mortgagee.)
In September, the median loan-to-value ratio (LTV) and debt-to-income ratio (DTI) for the “typical” Texas conventional-loan mortgage decreased from 87.4 to 86.9 and 36.8 to 36.4, respectively. Meanwhile, the median credit score stabilized at 743 after reaching a three-decade high of 751 in June when average consumer credit scores rose during the pandemic due to early relief actions taken by the federal government and lenders, which helped some households pay off debt and save money. The median LTV of the typical Texas borrower who obtained a loan from a government-sponsored enterprise (GSE) declined from 84.8 to 83.7. The overall trend of improved credit profiles may reflect tightening lending standards as economic uncertainty prevails.
Prices
The Texas median home price accelerated 12 percent year over year (YOY) in October to a record-breaking $273,300. A shift in the composition of sales toward higher-priced homes due to constrained inventories at the lower end of the price spectrum contributed to the increase in prices. Annual price growth tipped into the double-digits at the metropolitan level as well. The median price in Austin and Dallas rose almost 13 percent each to $366,600 and $330,500, respectively. San Antonio’s metric ($259,500) jumped 10.7 percent, while Houston’s median price ($269,300) elevated 10.3 percent. Fort Worth had the smallest home price appreciation, growing 9.1 percent to $272,600.
The Texas Repeat Sales Home Price Index accounts for compositional price effects and provides a better measure of changes in single-family home values. The index suggested more moderate home-price appreciation than the change in the median price, although it still shot up 6.9 percent annually. Out of the major metros, Austin’s metric rose at a pace closest to its home-price growth, soaring 11.6 percent YOY. The index in San Antonio and Fort Worth climbed 7.4 and 7.0 percent, respectively. The Dallas and Houston indexes grew at a more moderate but still impressive clip, increasing 6.6 percent in the former and 4.8 percent in the latter.
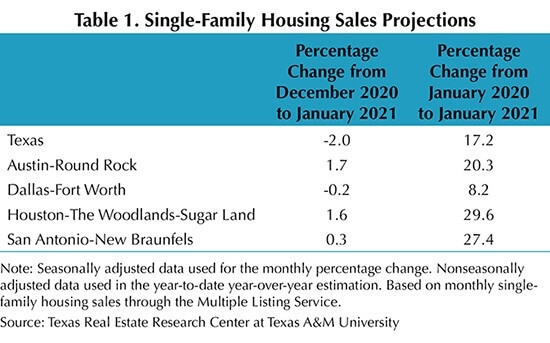
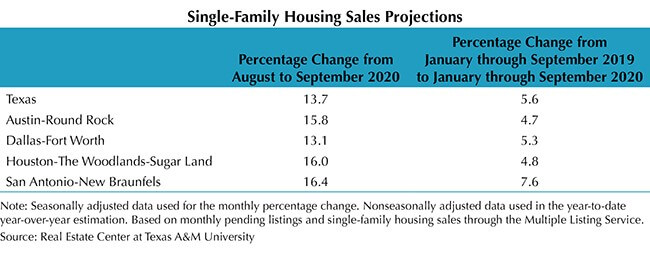
Single-Family Forecast
The Real Estate Center projected single-family housing sales using monthly pending listings from the preceding period (Table 1). Only one month in advance was projected due to the uncertainty surrounding the COVID-19 pandemic and the availability of reliable and timely data. Texas sales are expected to decline 2.3 percent in November from October, but the YOY comparisons for the first ten months of the year are significantly positive. On a monthly basis, the metric in DFW may decrease 4 percent, while possibly falling 2.1 and 1.6 percent in Houston and Austin, respectively. San Antonio sales are predicted to post a monthly increase of 2.5 percent.
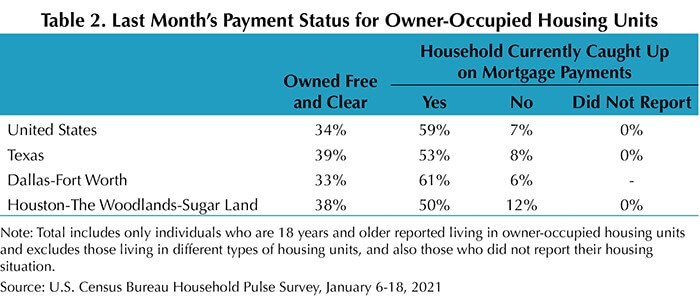
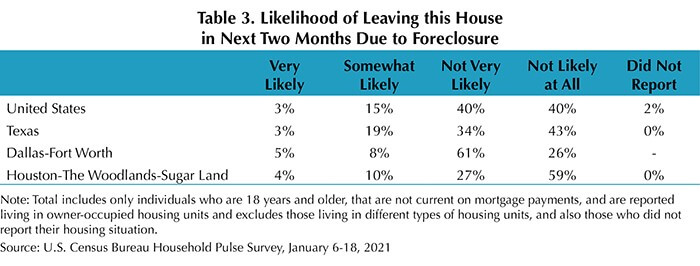
Household Pulse Survey
According to the U.S. Census Bureau’s Household Pulse Survey, 8 percent of Texas homeowners were behind on their mortgage payments during October, greater than the national rate of 6 percent (Table 2). Although the proportion of homes owned free and clear in DFW and Houston was greater than the state average, the percentage of households delinquent was also higher than the statewide rate. Twenty-nine percent of the respondents in Texas who were not current expected foreclosure to be either very likely or somewhat likely in the next two months compared with just 19 percent nationwide (Table 3). That same metric was also higher in the state’s largest metro areas, a reversal from the prior month. Currently, the Center for Disease Control’s federal foreclosure moratoriums are in place until Dec. 31, 2020. However, the Federal Housing Finance Agency has extended the foreclosure moratorium for properties owned by Fannie Mae and Freddie Mac (the Enterprises) until Jan. 31, 2021. Continued stability in the housing market is essential to Texas’ economic recovery.