The Texas housing market was off to a solid start at the beginning of 2020 as mortgage interest rates declined. Sales activity plummeted in March and April, however, due to the emergence of COVID-19 and a mandated economic shutdown across the state. Nevertheless, homebuying demand accelerated during the summer for those less affected by the pandemic as remote-work-and-school spaces prompted the desire for additional space in the house, interest rates continued to fall, and more millennials entered the housing market. Almost 393,200 homes were sold through the Multiple Listing Services (MLS) during 2020, a near double-digit percentage increase from activity the previous year. On the other hand, homeowners were cautious about listing their homes on the market and hosting in-person showings, contributing to a plummet in available inventory, particularly for homes priced less than $300,000. In an environment of robust demand and shrinking supply, home-price appreciation surged, pressuring housing affordability.
The same factors that defined 2020 will remain relevant in the new year. The housing market will continue to be characterized by strong demand but constrained inventory and substantial price growth. Nevertheless, the Texas Real Estate Research Center expects single-family sales to increase 8.4 percent in 2021. Containment of the coronavirus and government support is essential for a positive economic and housing outlook during ongoing pandemic-related uncertainty. (For additional commentary, see the 2021 Texas Housing & Economic Outlook.)
Supply*
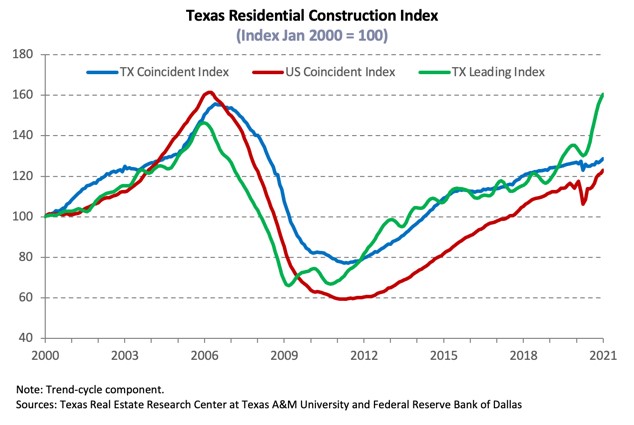
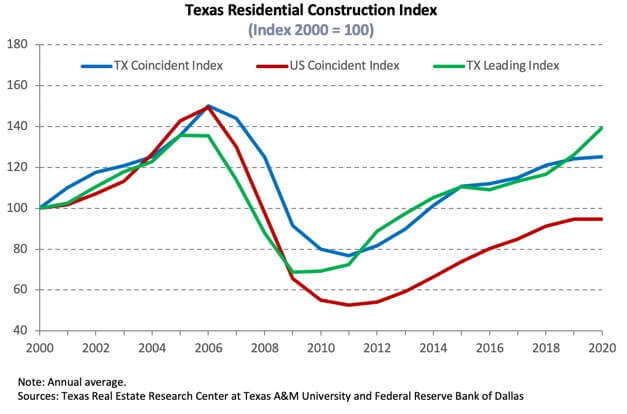
The Texas Residential Construction Cycle (Coincident) Index, which measures current construction activity, flattened in 2020 as industry hiring was sluggish during the pandemic. The Texas Residential Construction Leading Index, however, reached an all-time high in 2020 due to record low interest rates and strong building permits and housing starts, indicating construction activity will pick up in the new year. These metrics in Texas’ major Metropolitan Statistical Areas (MSAs) trended upward, especially in Austin and Houston, supporting a positive outlook.
In response to supply shortages, developers accelerated activity at the earliest stage of the construction cycle. According to Zonda, formally known as MetroStudy, the number of new vacant developed lots (VDLs) in the Texas Urban Triangle elevated 8.8 percent annually in 2020 to reach 116,500, four-fifths of 2006 levels. Lot development in Houston and San Antonio rose for the third straight year, climbing 12.0 and 29.8 percent, respectively, with improvement in all price ranges except for homes priced less than $200,000. Dallas-Fort Worth (DFW) activity rebounded 4.5 percent after contracting in 2019, but the increase was limited to the upper-end of the price spectrum. Meanwhile, Austin’s metric normalized after skyrocketing the previous year.
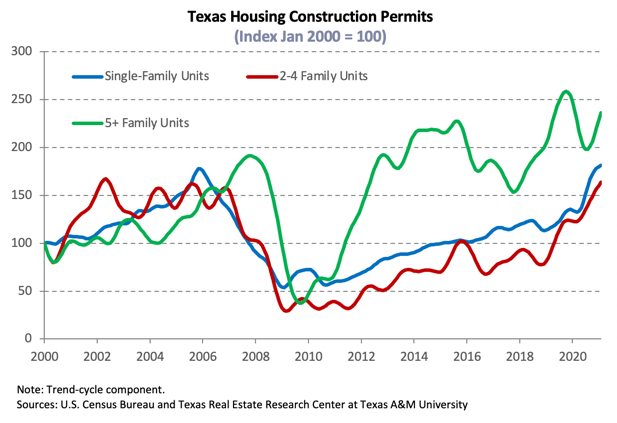
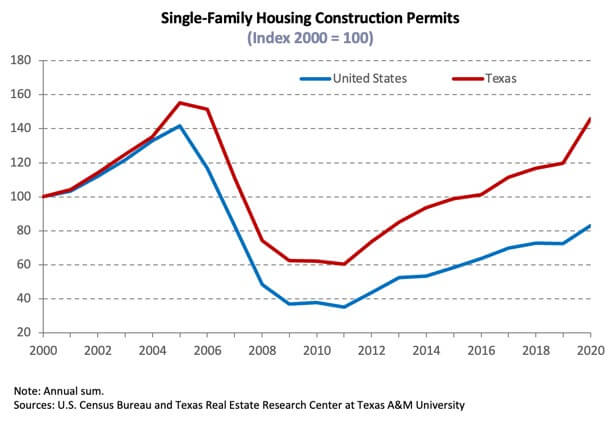
Strong lot development was matched by a near-record 153,600 single-family housing construction permits issued in Texas. The statewide metric accelerated 21.9 percent and comprised 16 percent of the national total during 2020. Austin posted an all-time high of 21,400 permits while the growth rate in DFW exceeded the state average at 24.2 percent to issue more than 43,500 permits. Activity in Houston and San Antonio increased by one-fifth, resulting in 48,100 and 10,700 permits, respectively.
Total Texas housing starts fell into double-digit negative growth territory during the first half of the year amid pandemic-related declines in activity. Despite soaring lumber prices, the metric rebounded strongly in the third quarter, pushing overall annual improvement up 9.5 percent. Per Zonda, single-family starts in the Texas Urban Triangle rose 18.9 percent, largely due to increased activity in the $200,000-$400,000 price range as starts for homes priced less than $200,000 stepped back after a brief reprieve the previous year due to rising construction costs. Single-family starts in North Texas and Houston skyrocketed 21.0 and 20.2 percent, respectively. San Antonio starts sustained strong growth, jumping 19.2 percent. Although the pace decelerated in Austin, the metro still started more than 21,300 single-family homes, leading the Texas Urban Triangle in per capita terms. Tariffs on Canadian lumber were reduced from 20 to 9 percent in December, providing some relief to construction costs in 2021, although lumber prices remain extremely high.
Even with the economic shutdown in spring, $37.9 billion of new construction poured into Texas’ single-family market amid growing demand stemming from population growth and a shift in preferences for more livable space. Single-family private construction values climbed 13.9 percent annually after adjusting for inflation. Similar to other supply-side indicators, DFW and Houston accounted for the majority of the statewide increase after sluggish activity in 2019. Austin recorded a decade of growth while San Antonio posted double-digit percent improvement for the second consecutive year.
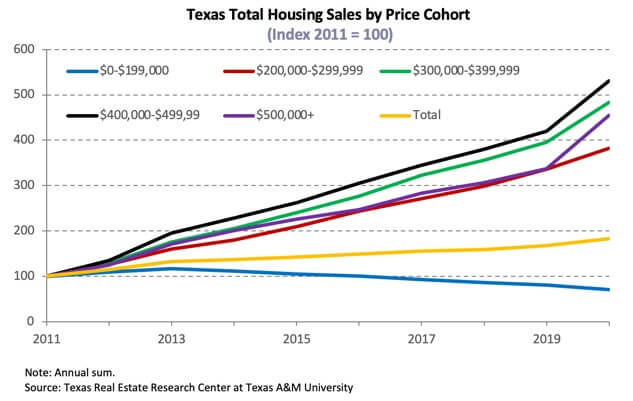
Robust demand and a decline in the number of new MLS listings contributed to the first annual decrease in active listings since 2015, pulling Texas’ total months of inventory (MOI) down to 1.7 months. A total MOI of around six to 6.5 months is considered a balanced housing market. Inventory fell across all price cohorts, but the metric for homes priced less than $300,000 averaged just 1.3 months. Even the MOI for luxury homes (priced more than $500,000) sank from 5.0 to 2.9 months as constrained supply at the lower end of the price spectrum pushed buyers toward higher-priced homes.
Inventory was most depleted in Austin where the MOI plummeted below 0.6 months. The North Texas metric slid below the state average, falling to 1.2 and 1.1 months in Dallas and Fort Worth, respectively. Houston’s MOI sank for the second straight year to two months but remained the most elevated out of the major MSAs. San Antonio inventory hovered above the statewide metric, although the metro was still supply-limited with an MOI of 1.7 months.
Demand
More than 393,100 Texas homes sold through MLSs in 2020, a 9.4 percent increase over the previous year. The surge in homebuying highlighted the disparate impacts of the pandemic across the socioeconomic spectrum; in general, families who bought a house were more likely to be able to work from home and keep their jobs during the pandemic compared with many lower-income and lower-skilled renter households who struggled financially. The bottom end of the market (homes priced less than $200,000) dragged on overall activity, plunging double-digits in percentage terms amid a severe lack of supply and rising construction costs. Nevertheless, overall sales outpaced the national growth rate (7.1 percent) for the fourth straight year.
At the metropolitan level, San Antonio led with growth of 11.5 percent. Despite year-end declines in activity, Dallas and Austin sales still increased 9.8 and 8.4 percent annually, respectively, after home-price appreciation slowed in 2019. Transactions in Fort Worth accelerated 6.3 percent after modest improvement the previous year, while Houston’s metric climbed 9.2 percent.
In the new-home market, each major MSA posted double-digit sales growth per Zonda, boosting overall activity. Similar to total sales, San Antonio recorded the greatest annual percentage increase of 17.7 percent, selling 15,000 new homes in 2020. Notably, sales for homes priced less than $200,000 ticked up for the second straight year after the same price cohort accounted for a quarter of the metro’s single-family starts in 2019. Austin’s metric reached 21,000 for the first time, largely due to elevated sales for homes priced $300,000 and $400,000, while DFW registered 40,800 new-home sales. Both locales registered accelerated activity during the second half of the year. Despite a low oil-price environment, new-home sales in Houston surged 12.8 percent to 34,500 compared with three consecutive annual declines between 2015-17.
According to the U.S. Census Bureau’s Current Population Survey/Housing Vacancy Survey, Texas homeownership normalized during fourth quarter 2020 to average 66.5 percent over the year compared with the national rate of 66.6 percent. Homeownership increased annually at the metropolitan level as well despite fourth-quarter declines. The rate in Austin and Houston shot up to 65.4 and 65.2 percent, respectively. DFW’s metric climbed to an all-time high of 64.7 percent (series starting in 2005), while 64.2 percent of San Antonio’s total housing units were owner-occupied. The overall rise in homeownership was largely due to elevated home purchases by millennials spurred by historically low mortgage interest rates. Young adults who moved back home with their parents during the pandemic due to job losses or remote schooling, which decreased the number of households, may have contributed to the elevated rate.
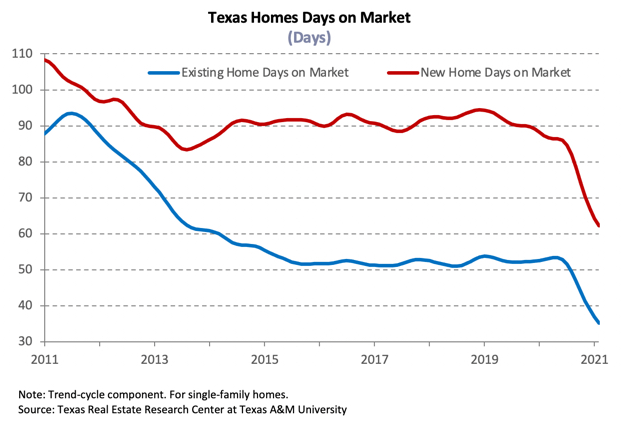
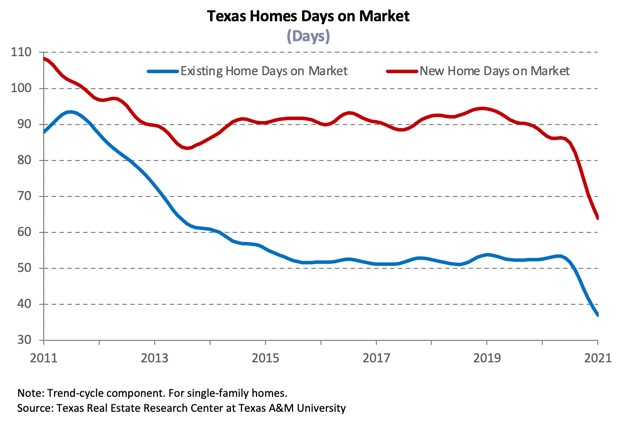
Amid record-breaking sales activity, Texas’ average days on market (DOM) slid to 55 days, corroborating robust housing demand. Austin and Dallas both shed a week off their DOMs, sinking to 45 and 46 days, respectively. The average home sold even faster in Fort Worth after just 42 days on the market. Demand was slightly softer in San Antonio than the rest of the state, but the metric still fell to 57 days. Meanwhile, the Houston DOM ticked down to 54 days.
Economic uncertainty surrounding the COVID-19 pandemic prompted investors to purchase safe-haven assets at an accelerated rate during the first half of the year, pulling interest rates to historically low levels. Expansionary monetary measures by the Federal Reserve and development on the vaccine front generated higher growth expectations, pushing interest rates up in the fourth quarter, but the ten-year U.S. Treasury bond yield still fell 125 basis points in 2020, averaging a record-low 0.9 percent. Meanwhile, the Federal Home Loan Mortgage Corporation’s 30-year fixed-rate sank to 3.1 percent. Mortgage rates slid to decades-low levels within Texas, falling from 4.2 to 3.2 percent for conventional, or non-GSE, loans. For GSE borrowers, the median mortgage rate was slightly higher during 2020 at 3.3 percent but still a significant decline from 4.4 percent the previous year. Texans capitalized on lower rates, pushing mortgage applications for home purchases up 24 percent compared with 2019. Refinance mortgage applications, which are more sensitive to interest rate fluctuations, more than doubled during the same time period after tripling during 2019. The growth rate of refinances is expected to decelerate in 2021 as the pool of households able to refinance shrinks. (For more information, see Finding a Representative Interest Rate for the Typical Texas Mortgagee.)
Corroborating tightening lending standards during the economic downturn, the debt-to-income ratio (DTI) constituting the “typical” Texas non-GSE mortgage decreased from 37.6 to 36.3 in 2020. The median credit score increased from 738 to a multidecade high of 746 as average consumer credit scores rose due to relief actions taken by the federal government and lenders that helped some households pay off debt and save money. The median loan-to-value ratio (LTV) flattened at 86.7 for non-GSE loans, while the GSE metric sank from 86.2 to 85.9. The DTI for GSE borrowers also ticked down, falling from 37.2 to 35.8. Despite a projected rise in delinquencies in the new year, lending standards are predicted to ease somewhat in 2021 due to expectations of overall better loan performance.
Prices
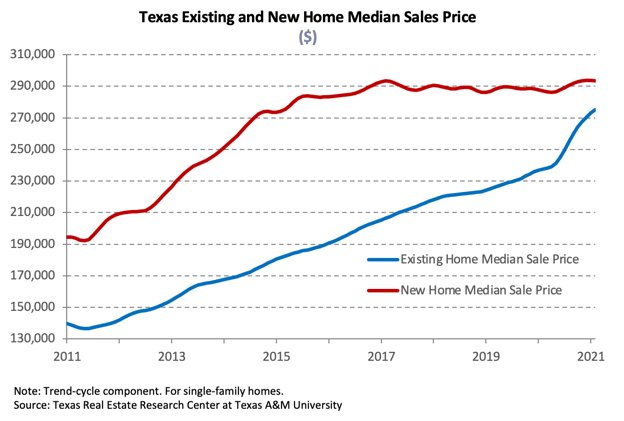
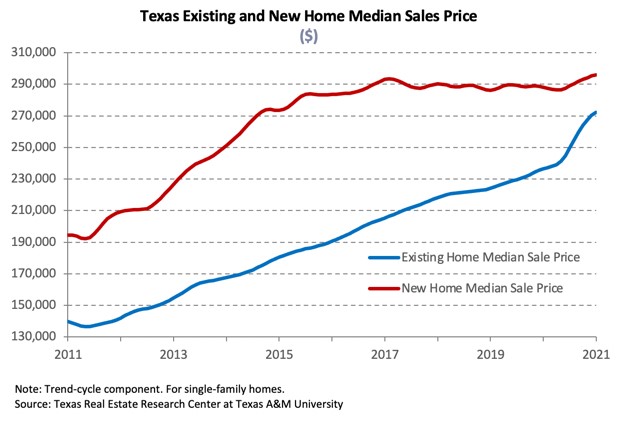
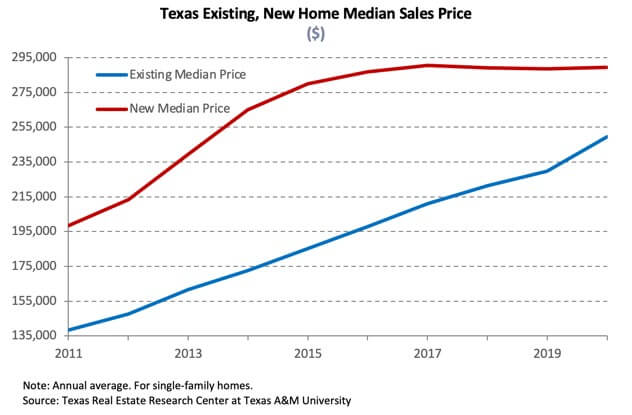
Robust demand and dwindling inventory pushed home-price growth to its highest level since 2013 when prices were still recovering from the Great Recession. The Texas median home price skyrocketed 7.9 percent annually to $259,000 relative to a 3.2 percent pace in 2019. The $19,000 increase is partially due to a distributional shift in sales activity away from the lower-end of the price spectrum to higher-priced homes. Central Texas led the major metros in median price growth with the metric rising 9.2 and 8.4 percent to $344,000 and $249,400 in Austin and San Antonio, respectively. The Dallas metric rose to $311,000 while the median price in both Fort Worth and Houston jumped to $260,000.
The Texas Repeat Sales Home Price Index, a better measure of changes in single-family home values, provides insight into how Texas home prices evolve. Home-price appreciation accelerated 5.2 percent annually during 2020 amid strong demand during the second half of the year. In Austin, the index soared at its fastest clip since 2014 at 8.3 percent. The North Texas metric increased 5.1 and 4.3 percent in Fort Worth and Dallas, respectively, while San Antonio landed in the middle, posting 4.9 percent growth. Houston’s index rose at a more moderate rate of 3.9 percent.
Elevated home prices offset historically low mortgage rates, capping affordability gains during 4Q2020 after strong improvement in 2019. Houston was the most affordable major MSA with an index of 1.9, indicating that a family earning the median income could afford a home costing 90 percent more than the median sales price. The metro also posted the largest percentage increase relative to year-ago levels, followed by Fort Worth, where the metric jumped to 1.8. The index flattened at 1.7 in both Austin and San Antonio, as well as in Dallas. Housing affordability is important to Texas’ demographic advantages that have supported the state’s economic prosperity over the past decade.
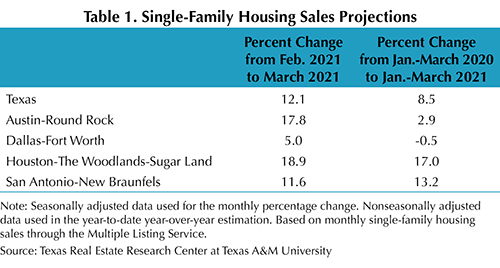
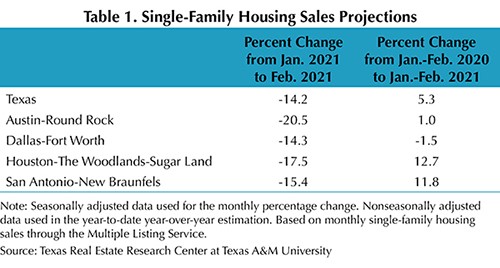
Single-Family Forecast
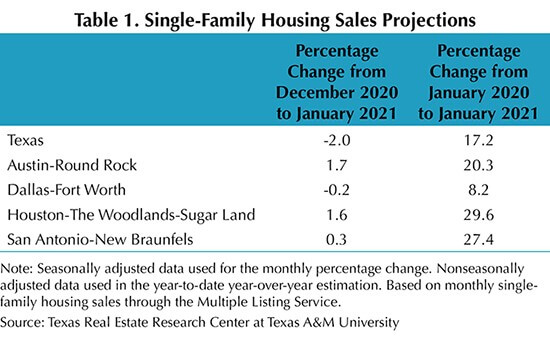
The Center projected single-family housing sales using monthly pending listings from the preceding period (Table 1). Only one month in advance was projected due to the uncertainty surrounding the COVID-19 pandemic and the availability of reliable and timely data. Texas sales are expected to decline 2 percent from December 2020. At the metropolitan level, transactions are predicted to flatten in Dallas and San Antonio but may increase 1.7 and 1.6 percent in Austin and Houston, respectively. On the bright side, activity relative to January 2020 was largely positive across the state and in each of the major MSAs, corroborating strong demand and an overall healthy housing market to start the new year.