January 2022 DFW Area Real Estate Stats
January stats are here and we have the numbers! Our stats infographics include a year over year comparison and area highlights for single family homes and condos broken down by MLS area. We encourage you to share these infographics and video with your sphere. For more stats information, pdfs and graphics of our stats including detailed information […]
2021 DFW Real Estate Year-End Stats at a Glance

We’ve taken our monthly stats-at-a-glance reports from January through December of 2021, totaled, averaged, and compared the data to the numbers from 2020. The result is an annual report of the DFW area real estate market in 2021. The annual totals reiterate the lack of inventory we saw in 2021, indicating a very strong seller’s […]
December 2021 DFW Area Real Estate Stats

https://youtu.be/nr1F7l4gPvM December 2021 stats are here and we have the numbers! Let’s see how the DFW real estate market ending 2021. Active listing fell slightly from November, but that is to be expected over the holiday season. As expected due to the lack of inventory, the overall number of sales is down in all counties while […]
January Landscape & Gardening Tips & To-dos

Need help planting a successful garden or landscape? Here are some January planting tips from the Dallas Arboretum horticulture staff and the Dallas County Master Gardeners that can help keep your home garden looking beautiful this winter, whilst having it ready and set up for success in Spring. January’s focus is prep! Decide what plants […]
NTREIS Phasing Out Areas and Subareas
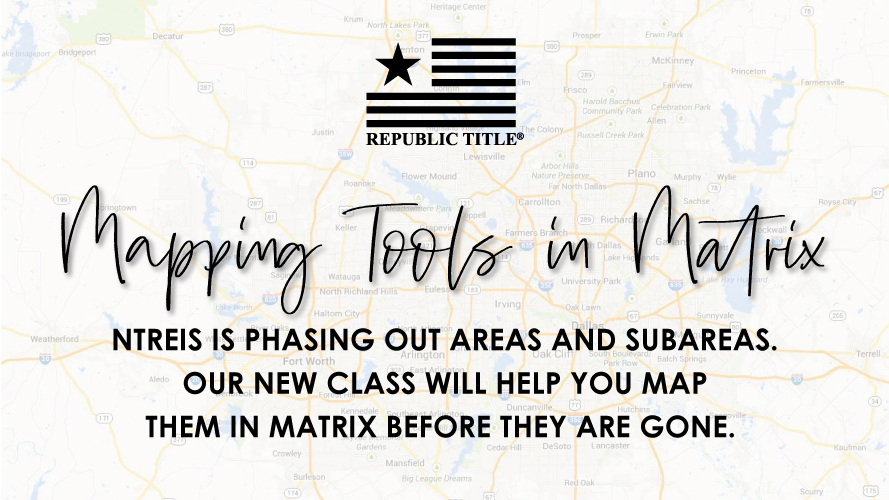
Over the next few months NTREIS users will be experiencing the phasing out of areas and subareas. NTREIS is rebuilding the Matrix system to be in compliance with the Real Estate Standards Organization (RESO) data dictionary. Through this process, the area/subarea fields will not be included. The decision was made over two years ago to […]
Texas Housing Insight October 2021

Texas housing sales slowed in October but trended upward amid continued supply constraints. Along with higher mortgage interest rates, double-digit home-price appreciation chipped away at housing affordability. Elevated demand persisted as homes averaged roughly one month on the market. On the supply side, single-family housing permits increased for the second consecutive month, but housing starts […]
November 2021 DFW Area Real Estate Stats

November 2021 North Texas real estate stats are out and we’ve got the numbers! Our stats infographics include a year over year comparison and area highlights for single family homes and condos broken down by MLS area. We encourage you to share these infographics and video with your sphere. For more stats information, pdfs and graphics […]
Important Homestead Exemption Changes Effective January 1st
Homestead Exemption Filing Changes Effective January 1, 2022, a Buyer may file for a homestead exemption immediately after closing if the Seller did not have a homestead exemption on the property for the current tax year. For more important tax exemption information for new homeowners, please read below or download our Tax Exemption Resource. Important […]
Texas Housing Insight – September 2021 Summary

Total Texas housing sales ticked up 0.9 percent during the third quarter as inventories remained relatively low in September. Most of the quarterly increase can be attributed to accelerated activity for existing homes priced above $300,000, offsetting the decline in new-home sales and reduced transactions in the lower price ranges. Texas’ homeownership rate decreased amid […]
October 2021 DFW Area Real Estate Stats
https://youtu.be/CpSmPSDTH20 October 2021 North Texas real estate stats are out and we’ve got the numbers! Our stats infographics include a year over year comparison and area highlights for single family homes and condos broken down by MLS area. We encourage you to share these infographics and video with your sphere. October 2021 stats alert! The third quarter […]